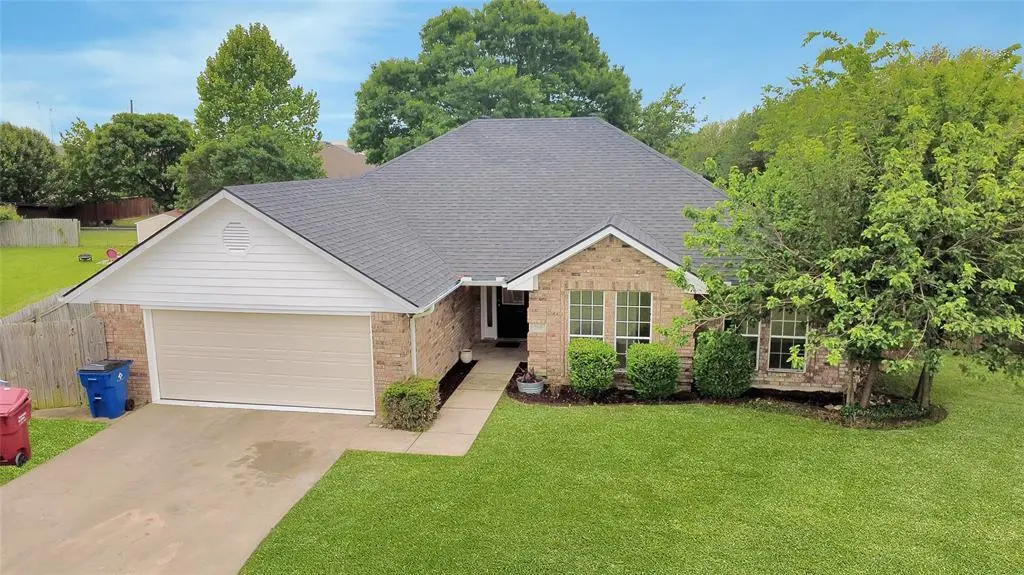
709 Elm Cir · Van Alstyne, TX
Flood risk 1/10 · Minimal
- FEMA flood zone
- X (unshaded)
- Chance of flooding over 30 yrs
- 0.0%
- Est. flood insurance / yr
- $507 – $1,088
Fire risk 6/10 · Moderate
- Est. fire insurance / yr
- $1,222 – $2,270
Heat risk 7/10 · Major
- Hot days now (above 110°F)
- 7 days/yr
- Hot days in 30 yrs
- 22 days/yr
Wind risk 6/10 · Moderate
- Chance of severe wind over 30 yrs
- 27.0%
Air-quality risk 3/10 · Minor
- Unhealthy air days now
- 2 days/yr
- Unhealthy air days in 30 yrs
- 3 days/yr
Risk factors via First Street. Map © Google.
Why this score? — see what drove the D grade
The composite is a weighted blend of 9 inputs, each scored 0–100. Each bar is that input's sub-score; the figure is the points it added to the 100-point composite (weight × sub-score).
- ARV discount +15.0/15.0
- Cash flow +7.2/30.0
- Schools +5.3/10.0
- Livability +3.8/5.0
- 1% rule +2.9/10.0
- Rent growth +2.5/5.0
- Condition / age +2.5/5.0
- DSCR +1.4/10.0
- Appreciation +0.0/10.0
$268,000
🖨 Deal sheet 📄 Offer letter ✓ Due diligence
Listing remarks MLS
Very Nice Brick home in nice neighborhood, quite, great school district, Small town atmosphere. Seller is offering carpet allowance. Wood burning fireplace for those cold winter nights.
Key facts
- Extra storage space
- Quiet cul-de-sac
- Large laundry room
Tags
Property features AI
Finance
- Other: Property on less than 0.5 acre (approx. 0.23 acre); Cul-de-sac parcel; Building restrictions apply
- HOA & community: No association
Exterior
- Parking: Attached garage; 2-car garage; 2 covered parking spaces
- Utilities: City water; City sewer; No municipal utility district
- Home design: Single family residence; One story; Residential property; Built in 1995
- Construction: Brick and siding exterior; Composition roof; Preowned
- Exterior features: Covered porch; Covered patio/porch; Fenced yard; Cul-de-sac lot; Few trees; Interior lot; Grassed vegetation
Interior
- Kitchen: Dishwasher; Disposal
- Bedrooms: Primary bedroom (level 1) with dual sinks, garden tub, and walk-in closet; Bedroom (level 1) with walk-in closet; Bedroom (level 1) with walk-in closet
- Flooring: Carpet; Ceramic tile
- Bathrooms: 2 full bathrooms
- Heating & cooling: Central heating (electric); Central air (electric); Attic fan; Ceiling fans
- Interior features: Eat-in kitchen; Pantry; Tile countertops; One living area; One dining area; Fireplace (gas)
- Laundry & utility: Washer hookup; Electric dryer hookup
Neighborhood map
What this means for you Summary
Snapshot
- This is a 3-bed/2.0-bath single-family listed at $268k.
Deal economics
- At list price, monthly cash flow is $-366 ($-4k/yr) — negative.
- To cash-flow at today's rent, offer at most $203k (24.1% below list).
- To meet the 1% rule (rent ≥ 1% of price), the offer needs to be $213k (20.7% below list).
- Recommended offer: $203k (24.1% below list) — sets the bar for cash-flow.
- Cap rate 4.7% vs local median 2.7% in Van Alstyne — top-decile yield for the area; either an underpriced asset or a hidden risk that comps aren't pricing in. Stress-test before assuming the spread holds.
Location & tenants
- Location reads 75/100 on livability (#134 in TX, #3,950 nationally) — a middle-class / working-renter tenant base. Strengths: crime A+, employment A+, cost of living A+; Watch: amenities F, commute F, health & safety F.
- Van Alstyne ISD (rural): math 62% / reading 59% proficiency, ranked #51 of 826 in TX (top 6%) — acceptable for families but not a draw, mixed tenant base, ~2y average lease.
- Zoned schools: Bob And Lola Sanford El (math 63% / reading 53%, grade C+, #480 of 4,322 statewide, top 11%, 598 students, 26% FRL) — zoned schools at 26% FRL track the district average.
- Market conditions: 624 active listings in the ZIP; 20 comparable units currently listed for rent nearby; rentals at typical pace (median 17d on market — plan ~3-4 weeks tenant-placement turnaround); high-income renter base; 2,272 units permitted in Grayson County in 2024 (750 in 5+ unit buildings).
Forward outlook
- Local home prices are declining (-3.0%/yr); year-one equity from $2k of loan paydown is wiped out by about $8k of value loss. Plan a longer hold.
- Grayson County population projected at +12% by 2050 — modest demand growth; plan on rents tracking national, not racing it.
Negotiation context
- It's been on market 46 days — a 3% lower offer ($260k) is reasonable based on typical stale-listing flexibility.
- 5 sale attempts since 17y ago with the ask held roughly flat each time — persistent listings suggest the price (not the market) is what's stuck; bring a comps-based counter.
Risks & watch-outs
- Climate carrying-cost: major wind risk, 27% chance of damaging wind over 30y; major wildfire risk; extreme-heat days projected 7→22/yr by 2055 (HVAC capex compounding) — expect insurance premiums to compound above CPI over the hold.
Questions for the listing agent
- What do current leases actually rent for vs. the listed asking? Can we see a recent rent roll and the last 12 months of T-12 income?
- It's been on market 46 days. Have you received any prior offers? Is the seller open to a 24% concession, seller financing, or rate buy-down credit?
- Is there a deadline driving the sale (1031 exchange, divorce, estate, relocation)? That informs how much negotiation room exists.
- Schools are B-rated — typically a magnet for longer-tenancy family renters. What's the average tenant stay here, and is there a school-zone premium baked into asking?
- The area grade is low — what's the realistic commute time and amenity access for the typical tenant pool here? Any planned neighborhood developments (good or bad) we should know about?
- What's the average days-on-market for RENTAL listings here right now (not sales)? A rising rental-DOM trend means longer vacancies and softer asking-rent achievability than the comps imply.
- What's the recent tenant-quality profile in this submarket — average credit score on applications, eviction rate, late-payment / NSF rate, and stable-employment percentage? A property-management company in the area should have these aggregated.
- How much new for-sale + rental construction is in the pipeline within 1–3 miles? Heavy new supply typically softens prices + rents 12–24 months out; constrained supply supports both.
Investment metrics
- 1% rule
- 0.79% ✗
- Cap rate
- 4.65%
- Cash-on-cash
- -5.86%
- DSCR
- 0.74
- GRM
- 10.5
CMA / ARV
- ARV (median comp)
- $334,343
- List price
- $268,000
- Delta
- -19.84%
- Verdict
- UNDERPRICED
- Comps
- 20 within 1.0 mi
Show comp detail 12 sales within ~0.75 mi
| Address | Dist | Beds/Ba | Sqft | Sold | Price | $/sf | Match |
|---|---|---|---|---|---|---|---|
| 905 Ravenwood Ln | 0.22mi | 3/2.0 | 1,590 (-2%) | 2mo | $280,000 | $176 | 85 |
| 709 Billups Cir | 0.13mi | 3/2.0 | 1,614 (-0%) | 11mo | $320,000 | $198 | 84 |
| 807 Birch Cir | 0.06mi | 3/2.0 | 1,755 (+8%) | 2mo | $330,000 | $188 | 82 |
| 810 Hix Cir | 0.08mi | 3/2.5 | 1,775 (+10%) | 13mo | $350,000 | $197 | 68 |
| 937 Billups Dr | 0.23mi | 3/2.0 | 1,717 (+6%) | 14mo | $295,000 | $172 | 68 |
| 2205 Maple Ridge Dr | 0.34mi | 4/2.0 (+1) | 1,826 (+13%) | 2mo | $350,000 | $192 | 57 |
| 279 Kincaid St | 0.58mi | 3/2.0 | 1,746 (+8%) | 7mo | $299,900 | $172 | 54 |
| 45 Kepler Rd | 0.68mi | 3/2.0 | 1,682 (+4%) | 11mo | $379,000 | $225 | 53 |
| 940 Billups Dr | 0.23mi | 4/2.0 (+1) | 1,861 (+15%) | 14mo | $345,000 | $185 | 48 |
| 558 Nunnalee Ave | 0.63mi | 3/2.0 | 1,400 (-14%) | 13mo | $240,000 | $171 | 37 |
| 627 N Preston Ave | 0.74mi | 3/2.0 | 1,857 (+15%) | 5mo | $342,500 | $184 | 37 |
| 689 N Preston Ave | 0.71mi | 3/2.0 | 1,413 (-13%) | 12mo | $299,000 | $212 | 35 |
Match score weights: distance 35% · size 25% · config 20% · recency 20%. Top-matched comps best support the ARV.
Projected returns pro-forma
-3.0% appreciation · 3.0% rent growth · sell at horizon
- IRR
- -26.3%
- Equity multiple
- 0.11×
- Total profit
- $-66,599
- Equity at exit
- $39,960
- IRR
- -23.0%
- Equity multiple
- -0.16×
- Total profit
- $-87,412
- Equity at exit
- $23,172
Cash invested: $75,040 (down + closing). Projections, not guarantees.
Landlord ↔ Tenant lean methodology
- Overall (STATE)
- 87 Strongly Landlord-Friendly
- State Texas
- 87 Strongly Landlord-Friendly · R+5
- County
- — inherits STATE
- City
- — inherits STATE
ZIP-level market 75495
- Home prices YoY
- -10.4%
- Active inventory
- 624
- Price-to-rent
- 10.5×
Monthly cashflow live
- Estimated rent
- $2,125 high interval (Pro) →
- Mortgage (P&I)
- −$1,405
- Tax from tax record
- −$528 /mo · $6,335/yr
- Insurance
- −$112
- HOA
- −$0
- Vacancy / Maint / Mgmt
- −$446
- Net cashflow
- $-366
Break-even live
UW: 25.0% down · 7.5% · 30yr · 1.5% tax · 5.0% vac · 8.0% maint · 8.0% mgmt
Financing live
Cash to close
- Down payment
- $67,000
- Closing costs
- $8,040
- Reserves months
- —
- Total cash needed
- —
Loan-product check · same deal, 3 products live
Conventional
25% down · 7.5% · 30yr
- Down + closing
- —
- Monthly P&I
- —
- Monthly cashflow
- —
- DSCR
- —
- Eligible?
- —
Personal DTI + credit; lowest rate.
DSCR
20% down · 8.5% · 30yr
- Down + closing
- —
- Monthly P&I
- —
- Monthly cashflow
- —
- DSCR
- —
- Eligible?
- —
No personal income docs; deal must DSCR.
Hard money
10% down · 12.0% · 12mo
- Down + closing
- —
- Monthly P&I
- —
- Monthly cashflow
- —
- DSCR
- —
- Eligible?
- —
Short-term bridge; refi at stabilization.
Rent comps 20 comps
| Address | Beds | Baths | Sqft | Rent | $/sqft | DOM | Units | Dist |
|---|---|---|---|---|---|---|---|---|
| 712 Billups Cir Van Alstyne, TX | 3.0 | 2.0 | 1489 | $1,950 | $1.31 | 11d | 1 | 0.10mi |
| 920 Ravenwood Ln Van Alstyne, TX | 3.0 | 2.0 | 1560 | $1,895 | $1.21 | 18d | 1 | 0.22mi |
| 933 Ravenwood Ln Van Alstyne, TX | 4.0 | 2.0 | 1900 | $2,099 | $1.10 | 43d | 1 | 0.26mi |
| 1005 Stanridge Ln Van Alstyne, TX | 4.0 | 2.0 | 1942 | $2,250 | $1.16 | 12d | 1 | 0.33mi |
| 417 Vawter Dr Van Alstyne, TX | 4.0 | 2.0 | 1816 | $2,199 | $1.21 | 18d | 1 | 0.50mi |
| 525 Gilcrease Van Alstyne, TX | 3.0 | 2.0 | 1208 | $1,895 | $1.57 | 43d | 1 | 0.69mi |
| 524 Hickory Ridge Dr Van Alstyne, TX | 4.0 | 2.0 | 2213 | $2,300 | $1.04 | 18d | 1 | 0.82mi |
| 523 N Preston Ave Van Alstyne, TX | 3.0 | 2.0 | 1876 | $2,150 | $1.15 | 16d | 1 | 0.82mi |
| 523 N Preston Ave Unit 523 Van Alstyne, TX | 3.0 | 2.0 | 1900 | $2,150 | $1.13 | 16d | 1 | 0.82mi |
| 523 N Preston Ave Van Alstyne, TX | 3.0 | 2.0 | 1876 | $2,150 | $1.15 | 4d | 1 | 0.82mi |
| 509 Brook View Dr Van Alstyne, TX | 4.0 | 2.5 | 1798 | $2,350 | $1.31 | 12d | 1 | 0.89mi |
| 182 Douglas Ln Van Alstyne, TX | 2.0 | 2.0 | 1212 | $1,800 | $1.49 | 22d | 1 | 0.92mi |
| 470 E Marshall St Van Alstyne, TX | 3.0 | 2.0 | 1770 | $2,000 | $1.13 | 4d | 1 | 1.06mi |
| 266 W Fulton St Van Alstyne, TX | 3.0 | 2.0 | 1547 | $1,675 | $1.08 | 7d | 1 | 1.09mi |
| 313 Hopson St Van Alstyne, TX | 4.0 | 3.0 | 2178 | $2,350 | $1.08 | 43d | 1 | 1.11mi |
| 320 Glenwick Ln Van Alstyne, TX | 4.0 | 2.5 | 1824 | $2,090 | $1.15 | 43d | 1 | 1.11mi |
| 321 Hopson St Van Alstyne, TX | 4.0 | 2.5 | 1619 | $2,100 | $1.30 | 5d | 1 | 1.13mi |
| 135 E Fulton St Van Alstyne, TX | 4.0 | 2.0 | 2232 | $2,195 | $0.98 | 11d | 1 | 1.13mi |
| 412 Glenwick Ln Van Alstyne, TX | 4.0 | 2.5 | 1861 | $2,200 | $1.18 | 7d | 1 | 1.18mi |
| 1185 E Jefferson St Van Alstyne, TX | 3.0 | 2.0 | 1449 | $2,000 | $1.38 | 20d | 1 | 1.23mi |
Listing history 22 events
-
2026-06-10status $268,000 Pending 46 DOM
-
2026-06-09days on market $268,000 Active Option Contract 46 DOM
-
2026-06-08days on market $268,000 Active Option Contract 45 DOM
-
2026-06-07statusdays on market $268,000 Active Option Contract 44 DOM
-
2026-06-04days on market $268,000 Active 41 DOM
-
2026-06-03days on market $268,000 Active 40 DOM
-
2026-06-02days on market $268,000 Active 39 DOM
-
2026-06-01days on market $268,000 Active 38 DOM
-
2026-05-31days on market $268,000 Active 37 DOM
-
2026-05-18historical Active Option Contract 465-char remark
-
2026-05-07status Active 465-char remark
-
2026-04-28historical Active Option Contract 465-char remark
-
2026-04-23$270,000 Active 465-char remark
-
2019-12-19soldstatus
-
2019-12-17soldstatus Sold 185-char remark
Show marketing remark (185 chars)
Very Nice Brick home in nice neighborhood, quite, great school district, Small town atmosphere. Seller is offering carpet allowance. Wood burning fireplace for those cold winter nights.
-
2019-11-27status Pending 185-char remark
Show marketing remark (185 chars)
Very Nice Brick home in nice neighborhood, quite, great school district, Small town atmosphere. Seller is offering carpet allowance. Wood burning fireplace for those cold winter nights.
-
2019-10-25$182,500 Active 185-char remark
Show marketing remark (185 chars)
Very Nice Brick home in nice neighborhood, quite, great school district, Small town atmosphere. Seller is offering carpet allowance. Wood burning fireplace for those cold winter nights.
-
2009-12-22soldstatus
-
2009-12-21soldstatus
Show marketing remark (464 chars)
Great property is vacant & move-in ready. Eligible for USDA $0 down financing wac. Kitchen has Kenmore range, wood edge counters, European style cabinets, pantry, track lighting and more. Wood-burning fireplace, vaulted ceiling in family room with windows on south side. Master bath has jet tub, dbl vanities, sep shower, built-ins in walk-in closet. Fresh paint & new carpets, certile in entry & master bath. Storage building and large backyard.
-
2009-12-08historical
Show marketing remark (464 chars)
Great property is vacant & move-in ready. Eligible for USDA $0 down financing wac. Kitchen has Kenmore range, wood edge counters, European style cabinets, pantry, track lighting and more. Wood-burning fireplace, vaulted ceiling in family room with windows on south side. Master bath has jet tub, dbl vanities, sep shower, built-ins in walk-in closet. Fresh paint & new carpets, certile in entry & master bath. Storage building and large backyard.
-
2009-09-09$129,500
Show marketing remark (464 chars)
Great property is vacant & move-in ready. Eligible for USDA $0 down financing wac. Kitchen has Kenmore range, wood edge counters, European style cabinets, pantry, track lighting and more. Wood-burning fireplace, vaulted ceiling in family room with windows on south side. Master bath has jet tub, dbl vanities, sep shower, built-ins in walk-in closet. Fresh paint & new carpets, certile in entry & master bath. Storage building and large backyard.
-
1995-02-22soldstatus
ⓘ Source: listings_history table (triggers on properties + properties_extension) + one-shot
backfill from property_details.listing_events for pre-trigger history.
Tax reassessment forecast TX · Resets to sale price
- Current annual tax
- $6,335 · $528/mo
- Projected year-2 tax
- $6,335 · $528/mo
- Expected delta
- $0/yr ($0/mo · 0.0%)
ⓘ Screening estimate from a state-policy table — verify with the county assessor before closing.
Climate risk First Street
- Flood 1/10 Low FEMA zone X (unshaded) · 0% chance over 30 yrs
- Wildfire 6/10 Major
- Heat 7/10 Severe 7 d/yr ≥110°F today · 22 d/yr by 30 yrs out
- Wind 6/10 Major 27% chance of damaging wind over 30 yrs
- Air quality 3/10 Moderate 2 unhealthy d/yr today · 3 by 30 yrs out
Nearby sold comps map
Loading sold comps map…
Walkable amenities ~0.75 mi
Loading nearby amenities…
Taxation est. · year 1
- Rental income
- $25,501
- − Mortgage interest
- −$15,012
- − Property taxes
- −$6,335
- − Insurance
- −$1,340
- − Repairs & maintenance
- −$2,040
- − Management
- −$2,040
- − Depreciation
- −$7,796
- Taxable loss
- −$9,063
- Est. tax savings @ 24.0%
- +$2,175
- After-tax cash flow
- $-2,219/yr
For passive investors: Depreciation is non-cash, so a rental often shows a tax loss while cash-flowing — sheltering income. Rental losses are passive: they offset passive income freely, and up to $25,000/yr can offset ordinary (W-2) income if you actively participate and your MAGI is under $100k (phasing out to $0 by $150k); unused losses carry forward. On sale, claimed depreciation is recaptured at up to 25%, and gains may owe capital-gains tax (a 1031 exchange can defer both). Figures are a year-1 estimate at your 24.0% rate — not tax advice; consult a CPA.
Schools (NCES district)
- District
- Van Alstyne ISD
- NCES district ID
- 4843890
- Math proficiency
- 62% ▼ -1.00%
- Reading proficiency
- 59% ▼ -2.00%
- Median HH income
- $68,451
- Composite
- 53.28/100
- National rank
- #1491
- State rank
- #51 of 826 in TX
Livability — Van Alstyne
- Score
- 75/100
- State rank
- #134
- US rank
- #3950
Category grades
Schools grade is shown separately in the Schools card above.
Census & demographics
- Census place
- Van Alstyne, TX
- County
- Grayson County · 108,053 people
- City population
- 11,120
- Metro
- Sherman-Denison, TX
- Population (ZIP)
- 11,120
- Household income
- $111,563
- Rent vs Own
- Severe rent burden
- 93.0
Population outlook (Grayson County) Hauer SSP2
- Today (2025)
- 134,540 people
- By 2030
- 138,653 · +3.1%
- By 2040
- 145,958 · +8.5%
- By 2050
- 151,218 · +12.4%
- By 2075
- 161,802 · +20.3%
- By 2100
- 159,036 · +18.2%
Race, ethnicity, and origin ACS 2023
- Neighborhood character
- Predominantly White (70%)
- Race & ethnicity
- White 70% Hispanic / Latino 20% Two or more races 15% Black 4%
- Hispanic origin (detail)
- Mexican 19%
- Common ancestry
- Lithuanian 5% Slovak 3% Italian 2%
- Foreign-born
- 9% · Canada
- Languages at home
- 83% English-only · Spanish 15% Russian/Polish/Slavic 1% Tagalog/Filipino 1%
Political lean MEDSL · Grayson
- 2024 margin
- Solid R (+54.3) · D 22.5% · R 76.7%
- 2008→2024 swing
- -16.4pp toward R · 2008: -37.9pp · 2024: -54.3pp
- All cycles
- 2024: R+54.3 2020: R+49.9 2016: R+53.1 2012: R+48.0 2008: R+37.9
Not yet ingested
- Civics
- —
Market trends
- HPI YoY
- ▼ -32.06%
- Current HPI
- 274.6361
- Rent YoY
- —
- Metro
- Sherman-Denison, TX
- State GDP YoY
- ▲ 3.95%
- F500 in state
- 110
Industry mix (Fortune 500 HQ in TX)
| Industry | F500 HQs | Revenue |
|---|---|---|
| Energy | 16 | $1,198B |
|
||
| Technology | 5 | $198B |
|
||
| Engineering / Construction | 4 | $72B |
|
||
| Energy Services | 3 | $60B |
|
||
| Utilities | 3 | $41B |
|
||
| Healthcare | 2 | $330B |
|
||
Price history
+106.9% since first listed17 events — show timeline
- 2026-06-09 Pending — NTREIS
- 2026-06-04 Contingent — NTREIS
- 2026-05-28 Price Changed $268,000 NTREIS
- 2026-05-28 Relisted — NTREIS
- 2026-05-18 Contingent — NTREIS
- 2026-05-07 Relisted — NTREIS
- 2026-04-28 Contingent — NTREIS
- 2026-04-23 Listed $270,000 NTREIS
- 2019-12-19 Sold (Public Records) — Public Records
- 2019-12-17 Sold (MLS) — NTREIS
- 2019-11-27 Pending — NTREIS
- 2019-10-25 Listed $182,500 NTREIS
- 2009-12-22 Sold (Public Records) — Public Records
- 2009-12-21 Sold (MLS) — NTREIS
- 2009-12-08 Listing Removed — NTREIS
- 2009-09-09 Listed $129,500 NTREIS
- 1995-02-22 Sold (Public Records) — Public Records
Property tax history
+4.1%/yrLatest (2025): $6,335 · -5.2% YoY. Source: county tax records.
Cash-flow waterfall
monthlySold comps — $/sqft
last 12 mo · ≤1 miLoading sold comps…