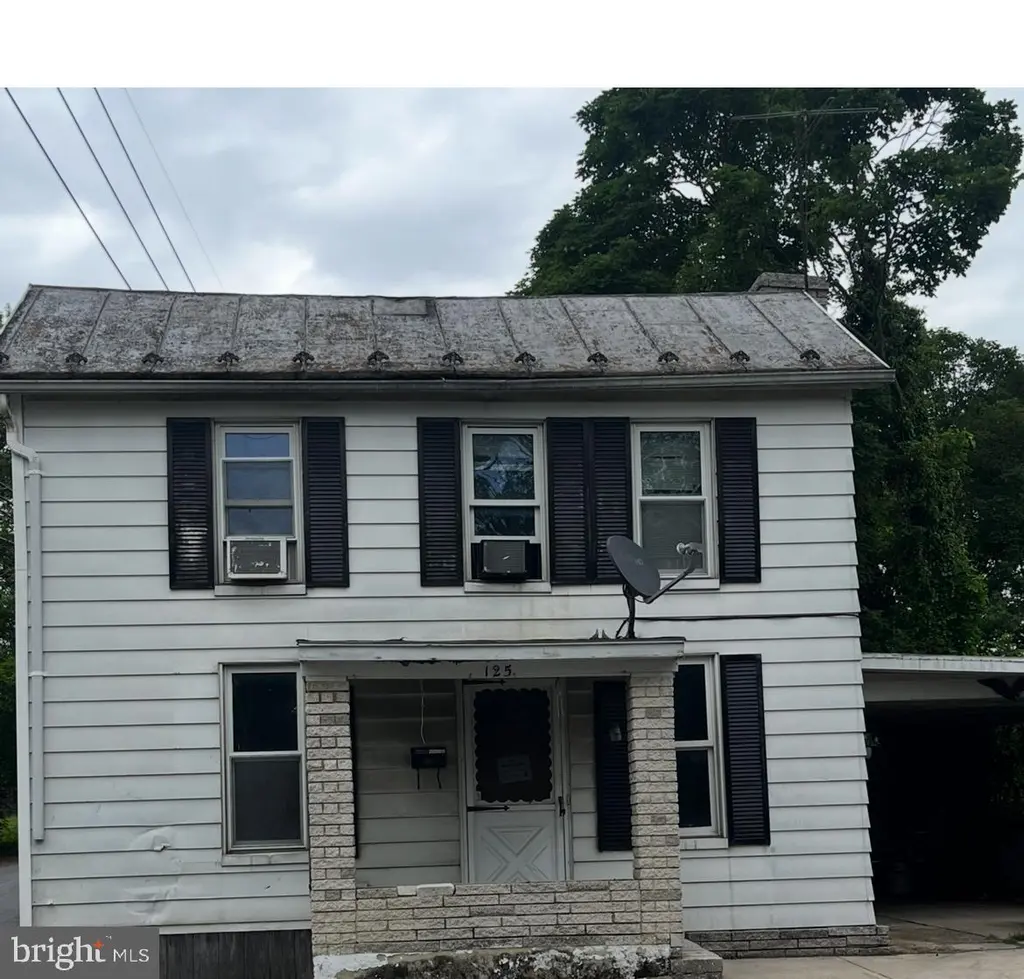
125 N Washington St · Shippensburg, PA
Flood risk 1/10 · Minimal
- FEMA flood zone
- X (unshaded)
- Chance of flooding over 30 yrs
- 0.0%
- Est. flood insurance / yr
- $507 – $1,088
Fire risk 2/10 · Minimal
- Est. fire insurance / yr
- $511 – $949
Heat risk 5/10 · Moderate
- Hot days now (above 100°F)
- 7 days/yr
- Hot days in 30 yrs
- 15 days/yr
Wind risk 2/10 · Minimal
- Chance of severe wind over 30 yrs
- 2.0%
Air-quality risk 2/10 · Minimal
- Unhealthy air days now
- 1 days/yr
- Unhealthy air days in 30 yrs
- 2 days/yr
Risk factors via First Street. Map © Google.
Why this score? — see what drove the D+ grade
The composite is a weighted blend of 9 inputs, each scored 0–100. Each bar is that input's sub-score; the figure is the points it added to the 100-point composite (weight × sub-score).
- Cash flow +13.8/30.0
- ARV discount +13.6/15.0
- DSCR +4.2/10.0
- Schools +3.5/10.0
- Livability +3.5/5.0
- 1% rule +3.2/10.0
- Rent growth +2.5/5.0
- Condition / age +2.5/5.0
- Appreciation +0.0/10.0
$179,900
🖨 Deal sheet (PDF) 📄 Offer letter ✓ Due diligence
Listing remarks
Fixer upper - Has been used solely as a rental property, some students, some families. 2 story (4 bdrm 1 1/2 bath) First floor LR, large eat-in kitchen, 1 bdrm and powder room. Laundry in side entrance mudroom. 2 floor has 3 bdrm and full bath. Fully fenced back yard with mature trees. Great investment/rental. Listing agent is part owner and has financial interest.
Key facts
- 6,534 sq ft lot
- 3 parking spots
- Built 1920
Property features AI
Finance
- Other: Property condition listed as below average
- Financial info: Ownership: Fee simple; Not in a federal flood zone; Ground rent paid annually
Exterior
- Parking: Attached carport (1 space); Two off-street parking spaces (3 total garage and parking spaces)
- Utilities: Public water; Public sewer; Municipal trash service
- Home design: Detached property; Metal roof; Frame construction with vinyl and aluminum siding
- Construction: Crawl space foundation
- Exterior features: Corner lot with rear yard; Fully chain link fenced
Interior
- Bedrooms: Three bedrooms on the upper level; One bedroom on the main level
- Bathrooms: One full bathroom on the upper level; One half bathroom on the main level
- Heating & cooling: Forced air heating; Natural gas heat; Electric hot water
- Interior features: Level entry on main; Basement with interior access and connecting stairway (partial)
- Laundry & utility: Laundry on the main floor
Neighborhood map
What this means for you Summary
Snapshot
- This is a 3-bed/1.5-bath single-family listed at $180k.
Deal economics
- At list price, monthly cash flow is $18 ($215/yr) — positive.
- The deal already cash-flows at list — no discount required.
- To meet the 1% rule (rent ≥ 1% of price), the offer needs to be $148k (17.6% below list).
- Recommended offer: $148k (17.6% below list) — sets the bar for 1% rule.
- Cap rate 6.4% vs local median 3.5% in Shippensburg — top-decile yield for the area; either an underpriced asset or a hidden risk that comps aren't pricing in. Stress-test before assuming the spread holds.
Location & tenants
- Location reads 70/100 on livability (#741 in PA) — a middle-class / working-renter tenant base. Strengths: crime A+, cost of living A+, health & safety A; Watch: employment D+, amenities F, commute F.
- Shippensburg Area SD (town): math 31% / reading 52% proficiency, ranked #335 of 539 in PA (top 62%) — families likely to look elsewhere, expect single-tenant / working-renter base with shorter leases.
- Zoned schools: James Burd El Sch (math 37% / reading 57%, grade D-, #737 of 1,518 statewide, top 52%, 502 students, 57% FRL); Shippensburg Area Ms (math 17% / reading 49%, grade F, #346 of 512 statewide, top 69%, 786 students, 55% FRL); Shippensburg Area Shs (math 71% / reading 30%, grade D+, #131 of 437 statewide, top 30%, 1,138 students, 46% FRL) — zoned schools average 53% FRL vs 30% district-wide (22 pts higher); higher-poverty schools than district average — tighter screening recommended.
- Market conditions: 162 active listings in the ZIP; 12 comparable units currently listed for rent nearby; rentals at typical pace (median 25d on market — plan ~3-4 weeks tenant-placement turnaround); 1,052 units permitted in Cumberland County in 2024 (310 in 5+ unit buildings).
Forward outlook
- Local home prices are declining (-3.0%/yr); year-one equity from $1k of loan paydown is wiped out by about $5k of value loss. Plan a longer hold.
- Cumberland County population projected at +17% by 2050 — long-run rental-demand tailwind backs the buy-and-hold thesis.
Negotiation context
- Only 10 days on market — expect competitive offers; lowballing is unlikely to land.
- Current owner paid $50k; list at $180k implies a 261% gain — meaningful room to come down on a strong offer.
Risks & watch-outs
- Watch-outs: built in 1920 — expect roof / HVAC / electrical / plumbing capex.
- Climate carrying-cost: extreme-heat days projected 7→15/yr by 2055 (HVAC capex compounding) — expect insurance premiums to compound above CPI over the hold.
Questions for the listing agent
- Built in 1920 — when were the roof, HVAC, electrical panel, plumbing, and water heater last replaced?
- Is there a deadline driving the sale (1031 exchange, divorce, estate, relocation)? That informs how much negotiation room exists.
- The area grade is low — what's the realistic commute time and amenity access for the typical tenant pool here? Any planned neighborhood developments (good or bad) we should know about?
- What's the average days-on-market for RENTAL listings here right now (not sales)? A rising rental-DOM trend means longer vacancies and softer asking-rent achievability than the comps imply.
- What's the recent tenant-quality profile in this submarket — average credit score on applications, eviction rate, late-payment / NSF rate, and stable-employment percentage? A property-management company in the area should have these aggregated.
- How much new for-sale + rental construction is in the pipeline within 1–3 miles? Heavy new supply typically softens prices + rents 12–24 months out; constrained supply supports both.
Investment metrics
- 1% rule
- 0.82% ✗
- Cap rate
- 6.41%
- Cash-on-cash
- 0.43%
- DSCR
- 1.02
- GRM
- 10.1
CMA / ARV
- ARV (on-the-fly)
- $208,244
- Comps found
- 12
Show comp detail 12 sales within ~0.75 mi
| Address | Dist | Beds/Ba | Sqft | Sold | Price | $/sf | Match |
|---|---|---|---|---|---|---|---|
| 312 E Garfield St | 0.38mi | 3/1.5 | 1,334 (+1%) | 2mo | $240,000 | $180 | 78 |
| 461 E King St | 0.35mi | 3/1.5 | 1,309 (-1%) | 11mo | $180,000 | $138 | 74 |
| 112 E Burd St | 0.16mi | 2/2.0 (-1) | 1,236 (-6%) | 6mo | $175,000 | $142 | 70 |
| 20 Richard Ave | 0.17mi | 4/1.5 (+1) | 1,468 (+11%) | 5mo | $150,000 | $102 | 64 |
| 306 E King St | 0.19mi | 3/1.5 | 1,454 (+10%) | 12mo | $151,500 | $104 | 64 |
| 305 Walnut St | 0.43mi | 3/1.5 | 1,248 (-5%) | 10mo | $265,000 | $212 | 63 |
| 400 S Penn St | 0.63mi | 2/1.0 (-1) | 1,364 (+4%) | 3mo | $245,000 | $180 | 55 |
| 28 S Washington St | 0.28mi | 2/1.5 (-1) | 1,513 (+15%) | 2mo | $230,000 | $152 | 55 |
| 14 W Burd St | 0.35mi | 4/3.0 (+1) | 1,440 (+9%) | 3mo | $189,900 | $132 | 55 |
| 253 Walnut St | 0.43mi | 3/2.0 | 1,432 (+9%) | 13mo | $250,000 | $175 | 53 |
| 116 N Fayette St | 0.48mi | 4/2.0 (+1) | 1,428 (+8%) | 13mo | $225,000 | $158 | 46 |
| 301 Roxbury Rd | 0.69mi | 3/1.0 | 1,155 (-12%) | 2mo | $195,500 | $169 | 43 |
Match score weights: distance 35% · size 25% · config 20% · recency 20%. Top-matched comps best support the ARV.
Projected returns pro-forma
-3.0% appreciation · 3.0% rent growth · sell at horizon
- IRR
- -15.6%
- Equity multiple
- 0.44×
- Total profit
- $-28,046
- Equity at exit
- $26,824
- IRR
- -7.2%
- Equity multiple
- 0.54×
- Total profit
- $-23,090
- Equity at exit
- $15,554
Cash invested: $50,372 (down + closing). Projections, not guarantees.
Landlord ↔ Tenant lean methodology
- Overall (STATE)
- 62 Landlord-Friendly
- State Pennsylvania
- 62 Landlord-Friendly · EVEN
- County
- — inherits STATE
- City
- — inherits STATE
ZIP-level market 17257
- Home prices YoY
- -17.3%
- Active inventory
- 162
- Price-to-rent
- 10.1×
Monthly cashflow live
- Estimated rent
- $1,482 high interval (Pro) →
- Mortgage (P&I)
- −$943
- Tax from tax record
- −$135 /mo · $1,616/yr
- Insurance
- −$75
- HOA
- −$0
- Vacancy / Maint / Mgmt
- −$311
- Net cashflow
- $18
Break-even live
Sensitivity live
| Price | -10% $120 | -5% $69 | +0% $18 | +5% $-33 | +10% $-84 |
|---|---|---|---|---|---|
| Rent | -10% $-99 | -5% $-41 | +0% $18 | +5% $76 | +10% $135 |
| Rate | -1.0pp $108 | -0.5pp $64 | base $18 | +0.5pp $-29 | +1.0pp $-76 |
UW: 25.0% down · 7.5% · 30yr · 1.5% tax · 5.0% vac · 8.0% maint · 8.0% mgmt
Financing live
Cash to close
- Down payment
- $44,975
- Closing costs
- $5,397
- Reserves months
- —
- Total cash needed
- —
Loan-product check · same deal, 3 products live
Conventional
25% down · 7.5% · 30yr
- Down + closing
- —
- Monthly P&I
- —
- Monthly cashflow
- —
- DSCR
- —
- Eligible?
- —
Personal DTI + credit; lowest rate.
DSCR
20% down · 8.5% · 30yr
- Down + closing
- —
- Monthly P&I
- —
- Monthly cashflow
- —
- DSCR
- —
- Eligible?
- —
No personal income docs; deal must DSCR.
Hard money
10% down · 12.0% · 12mo
- Down + closing
- —
- Monthly P&I
- —
- Monthly cashflow
- —
- DSCR
- —
- Eligible?
- —
Short-term bridge; refi at stabilization.
Rent comps 12 comps
| Address | Beds | Baths | Sqft | Rent | $/sqft | DOM | Units | Dist |
|---|---|---|---|---|---|---|---|---|
| 14 Kenneth Ave Shippensburg, PA | 1.0–4.0 | 2.0 | 745 | $1,630 | $2.19 | 15d | 1 | 0.26mi |
| 9 E Burd St Unit 1 Shippensburg, PA | 3.0 | 1.0 | 1400 | $1,400 | $1.00 | 45d | 1 | 0.27mi |
| 401 E Neff St Shippensburg, PA | 2.0 | 1.0 | 1400 | $1,295 | $0.93 | 23d | 1 | 0.27mi |
| 34 N Earl St Unit 2 Shippensburg, PA | 3.0 | 1.0 | 1550 | $1,350 | $0.87 | 25d | 1 | 0.33mi |
| 307 N Fayette St Shippensburg, PA | 3.0 | 1.0 | 1300 | $1,795 | $1.38 | 15d | 1 | 0.59mi |
| 1007 Hot Point Ave Shippensburg, PA | 4.0 | 2.5 | 1654 | $1,550 | $0.94 | 45d | 1 | 0.61mi |
| 735 E King St Shippensburg, PA | 3.0 | 2.0 | 1664 | $1,850 | $1.11 | 45d | 1 | 0.66mi |
| 2 Morningstar Ln Unit The Villa Shippensburg, PA | 4.0 | 2.0 | 1400 | $1,500 | $1.07 | 25d | 1 | 0.67mi |
| 2 Morningstar Ln Shippensburg, PA | 4.0 | 2.0 | 1400 | $1,500 | $1.07 | 15d | 1 | 0.72mi |
| 100 Bard Dr Shippensburg, PA | 2.0–4.0 | 1.0–2.5 | 1116 | $1,522 | $1.36 | 15d | 6 | 0.74mi |
| 353 Farmington Dr Shippensburg, PA | 3.0–4.0 | 2.0 | 1675 | $1,900 | $1.13 | 15d | 1 | 1.02mi |
| 100 Deerfield Ln Shippensburg, PA | 3.0 | 2.0 | 1264 | $1,595 | $1.26 | 25d | 1 | 1.43mi |
Listing history 19 events
-
2026-06-22days on market $179,900 Active 10 DOM
-
2026-06-18days on market $179,900 Active 7 DOM
-
2026-06-17days on market $179,900 Active 6 DOM
-
2026-06-16days on market $179,900 Active 5 DOM
-
2026-06-15days on market $179,900 Active 4 DOM
-
2026-06-14days on market $179,900 Active 2 DOM
-
2026-06-13statusdays on market $179,900 Active 1 DOM
-
2026-06-10days on market $179,900 Coming Soon 15 DOM
-
2026-06-09days on market $179,900 Coming Soon 14 DOM
-
2026-06-08days on market $179,900 Coming Soon 13 DOM
-
2026-06-07days on market $179,900 Coming Soon 12 DOM
-
2026-06-03days on market $179,900 Coming Soon 8 DOM
-
2026-06-02days on market $179,900 Coming Soon 7 DOM
-
2026-06-01days on market $179,900 Coming Soon 6 DOM
-
2026-05-31days on market $179,900 Coming Soon 5 DOM
-
2026-05-31days on market $179,900 Coming Soon 4 DOM
-
2026-05-26historical $179,900
-
1995-07-14soldstatus $49,900
-
1986-07-22soldstatus $50,100
ⓘ Source: listings_history table (triggers on properties + properties_extension) + one-shot
backfill from property_details.listing_events for pre-trigger history.
Tax reassessment forecast PA · Partial reset (capped growth)
- Current annual tax
- $1,616 · $135/mo
- Projected year-2 tax
- $2,229 · $186/mo
- Expected delta
- +$613/yr (+$51/mo · 37.9%)
ⓘ Screening estimate from a state-policy table — verify with the county assessor before closing.
Climate risk First Street
- Flood 1/10 Low FEMA zone X (unshaded) · 0% chance over 30 yrs
- Wildfire 2/10 Low
- Heat 5/10 Major 7 d/yr ≥100°F today · 15 d/yr by 30 yrs out
- Wind 2/10 Low 2% chance of damaging wind over 30 yrs
- Air quality 2/10 Low 1 unhealthy d/yr today · 2 by 30 yrs out
Nearby sold comps map
Loading sold comps map…
Walkable amenities ~0.75 mi
Loading nearby amenities…
Taxation est. · year 1
- Rental income
- $17,786
- − Mortgage interest
- −$10,077
- − Property taxes
- −$1,616
- − Insurance
- −$900
- − Repairs & maintenance
- −$1,423
- − Management
- −$1,423
- − Depreciation
- −$5,233
- Taxable loss
- −$2,886
- Est. tax savings @ 24.0%
- +$693
- After-tax cash flow
- $907/yr
For passive investors: Depreciation is non-cash, so a rental often shows a tax loss while cash-flowing — sheltering income. Rental losses are passive: they offset passive income freely, and up to $25,000/yr can offset ordinary (W-2) income if you actively participate and your MAGI is under $100k (phasing out to $0 by $150k); unused losses carry forward. On sale, claimed depreciation is recaptured at up to 25%, and gains may owe capital-gains tax (a 1031 exchange can defer both). Figures are a year-1 estimate at your 24.0% rate — not tax advice; consult a CPA.
Schools (NCES district)
- District
- Shippensburg Area SD
- NCES district ID
- 4221570
- Math proficiency
- 31% ▼ -21.00%
- Reading proficiency
- 52% ▼ -14.00%
- Median HH income
- $47,585
- Composite
- 35.42/100
- National rank
- #4938
- State rank
- #335 of 539 in PA
Livability — Shippensburg
- Score
- 70/100
- State rank
- #741
- US rank
- #7436
Category grades
Schools grade is shown separately in the Schools card above.
Census & demographics
- Census place
- Shippensburg, PA
- County
- Cumberland County · 257,673 people
- City population
- 29,204
- Metro
- Harrisburg-Carlisle, PA
- Population (ZIP)
- 29,204
- Household income
- $71,181
- Rent vs Own
- Severe rent burden
- 855.0
Population outlook (Cumberland County) Hauer SSP2
- Today (2025)
- 267,950 people
- By 2030
- 278,105 · +3.8%
- By 2040
- 296,552 · +10.7%
- By 2050
- 312,937 · +16.8%
- By 2075
- 349,233 · +30.3%
- By 2100
- 361,875 · +35.1%
Race, ethnicity, and origin ACS 2023
- Neighborhood character
- Predominantly White (89%)
- Race & ethnicity
- White 89% Black 4% Two or more races 3% Hispanic / Latino 3% Asian 2%
- Common ancestry
- Romanian 2% Slovak 2% Serbian 1%
- Foreign-born
- 4% · Canada, China
- Languages at home
- 90% English-only · German/W. Germanic 5% Spanish 2% Other Indo-European 1%
Political lean MEDSL · Cumberland
- 2024 margin
- Lean R (+9.4) · D 44.6% · R 54.1% · Other 1.3%
- 2008→2024 swing
- +4.2pp toward D · 2008: -13.6pp · 2024: -9.4pp
- All cycles
- 2024: R+9.4 2020: R+10.6 2016: R+18.6 2012: R+18.5 2008: R+13.6
Not yet ingested
- Civics
- —
Market trends
- HPI YoY
- ▼ -62.12%
- Current HPI
- 297.1586
- Rent YoY
- —
- Metro
- Harrisburg-Carlisle, PA
- State GDP YoY
- ▲ 1.68%
- F500 in state
- 34
Industry mix (Fortune 500 HQ in PA)
| Industry | F500 HQs | Revenue |
|---|---|---|
| Healthcare | 2 | $309B |
|
||
| Insurance | 2 | $27B |
|
||
| Telecommunications / Media | 1 | $124B |
|
||
| Industrial Distribution | 1 | $22B |
|
||
| Financial Services | 1 | $20B |
|
||
| Chemicals / Materials | 1 | $18B |
|
||
Price history
+259.1% since first listed3 events — show timeline
- 2026-05-26 Coming Soon $179,900 BRIGHT MLS
- 1995-07-14 Sold (Public Records) $49,900 Public Records
- 1986-07-22 Sold (Public Records) $50,100 Public Records
Property tax history
+2.6%/yrLatest (2026): $1,616 · +3.1% YoY. Source: county tax records.
Cash-flow waterfall
monthlySold comps — $/sqft
last 12 mo · ≤1 miLoading sold comps…