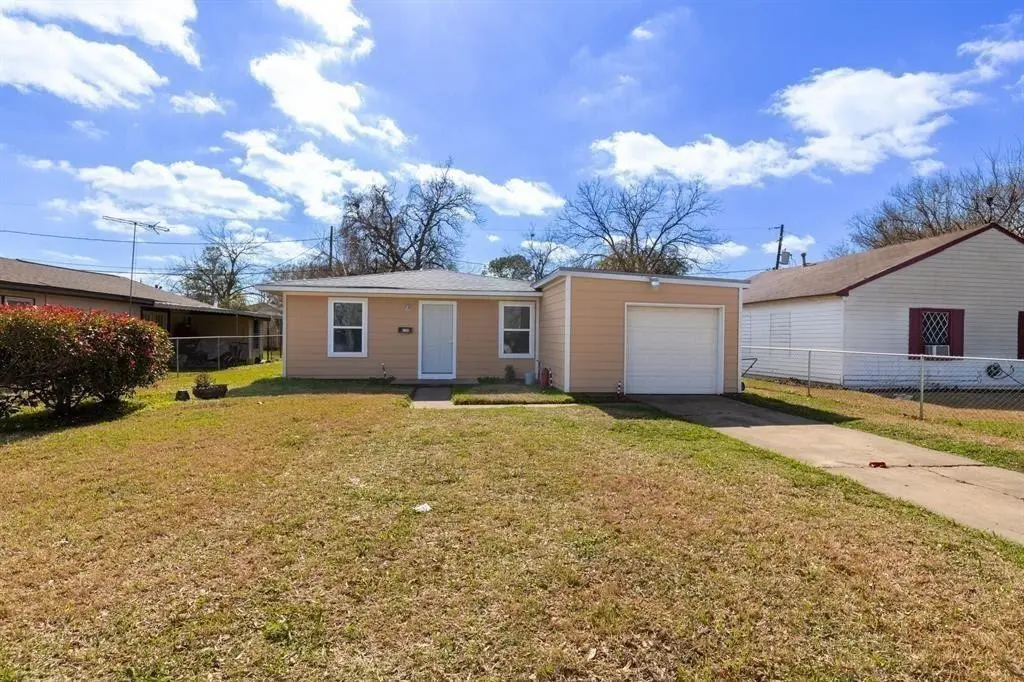
2506 6th St · Galena Park, TX
Flood risk 1/10 · Minimal
- FEMA flood zone
- X (unshaded)
- Chance of flooding over 30 yrs
- 0.0%
- Est. flood insurance / yr
- $507 – $1,088
Fire risk 3/10 · Minor
- Est. fire insurance / yr
- $1,222 – $2,270
Heat risk 9/10 · Severe
- Hot days now (above 109°F)
- 7 days/yr
- Hot days in 30 yrs
- 24 days/yr
Wind risk 9/10 · Severe
- Chance of severe wind over 30 yrs
- 99.0%
Air-quality risk 2/10 · Minimal
- Unhealthy air days now
- 2 days/yr
- Unhealthy air days in 30 yrs
- 2 days/yr
Risk factors via First Street. Map © Google.
Why this score? — see what drove the D- grade
The composite is a weighted blend of 9 inputs, each scored 0–100. Each bar is that input's sub-score; the figure is the points it added to the 100-point composite (weight × sub-score).
- Cash flow +8.1/30.0
- Appreciation +7.5/10.0
- ARV discount +6.9/15.0
- 1% rule +3.8/10.0
- Livability +3.4/5.0
- Schools +2.8/10.0
- Rent growth +2.5/5.0
- Condition / age +2.5/5.0
- DSCR +2.2/10.0
$149,900
🖨 Deal sheet (PDF) 📄 Offer letter ✓ Due diligence
Listing remarks
Welcome to 2506 6th Street in Galena Park! This charming 3-bedroom, 1.-bathroom home is ready for you to move in and make it your own. Roof replaced and brand-new HVAC This property offers a cozy and modern living space in a desirable neighborhood. Don't miss out on the opportunity to call for your new home sweet home! House has NOT FLOODED!
Key facts
- 4,321 sq ft lot
- Garage
- Built 1951
Property features AI
Exterior
- Parking: Attached garage (1 space)
- Utilities: Public water; Public sewer
- Home design: Residential property; Single-story (first floor living)
- Construction: Vinyl siding; Composition roof; Slab foundation; Built in 1951
- Exterior features: Fenced backyard; Cleared lot; Concrete road frontage
Interior
- Kitchen: Refrigerator
- Bedrooms: Primary bedroom (first floor); Bedroom (first floor); Bedroom (first floor)
- Flooring: Tile
- Bathrooms: 1 full bathroom
- Heating & cooling: Central heating (gas); Central air conditioning (electric)
- Interior features: Ceiling fan(s)
- Laundry & utility: Washer hookup; Electric dryer hookup
Neighborhood map
What this means for you Summary
Snapshot
- This is a 3-bed/1.0-bath single-family listed at $150k.
Deal economics
- At list price, monthly cash flow is $-145 ($-2k/yr) — negative.
- To cash-flow at today's rent, offer at most $124k (17.1% below list).
- To meet the 1% rule (rent ≥ 1% of price), the offer needs to be $131k (12.4% below list).
- Recommended offer: $124k (17.1% below list) — sets the bar for cash-flow.
- Cap rate 5.1% vs local median 4.1% in Galena Park — meaningfully above typical; check what's discounted (condition, days-on-market, listing class) to confirm the premium yield is real.
Location & tenants
- Location reads 68/100 on livability (#456 in TX) — a middle-class / working-renter tenant base. Strengths: crime A+, cost of living A+, housing A+; Watch: amenities F, commute F, employment D-.
- Galena Park ISD (suburban): math 32% / reading 33% proficiency, ranked #578 of 826 in TX (top 70%) — families likely to look elsewhere, expect single-tenant / working-renter base with shorter leases; 74% free/reduced lunch — lower-income household profile, screen leases tightly.
- Zoned schools: Galena Park El (math 31% / reading 36%, grade F, #2,174 of 4,322 statewide, top 51%, 597 students, 88% FRL); Galena Park Middle (math 28% / reading 31%, grade F, #1,077 of 1,662 statewide, top 66%, 943 students, 88% FRL); Galena Park H S (math 37% / reading 36%, grade F, #924 of 1,632 statewide, top 57%, 1,914 students, 87% FRL).
- Market conditions: 38 active listings in the ZIP; 5 comparable units currently listed for rent nearby; rentals leasing fast (median 7d on market — plan ~1-2 weeks tenant-placement turnaround); 29,883 units permitted in Harris County in 2024 (8,621 in 5+ unit buildings).
Forward outlook
- In year one you build about $8k of equity ($1k loan paydown + $7k appreciation (5.0% local appreciation)).
- Harris County population projected at +47% by 2050 — long-run rental-demand tailwind backs the buy-and-hold thesis.
- By year 5, paydown + projected appreciation supports a ~$37k cash-out refi (75% LTV) — recoverable capital for the next deal without selling this one.
Negotiation context
- It's been on market 54 days — a 3% lower offer ($145k) is reasonable based on typical stale-listing flexibility.
- 9 sale attempts since 7y ago with the ask held roughly flat each time — persistent listings suggest the price (not the market) is what's stuck; bring a comps-based counter.
Risks & watch-outs
- Watch-outs: property tax is 2.7% of price; built in 1951 — expect roof / HVAC / electrical / plumbing capex.
- Climate carrying-cost: severe wind risk, 99% chance of damaging wind over 30y; extreme-heat days projected 7→24/yr by 2055 (HVAC capex compounding) — expect insurance premiums to compound above CPI over the hold.
Questions for the listing agent
- What do current leases actually rent for vs. the listed asking? Can we see a recent rent roll and the last 12 months of T-12 income?
- It's been on market 54 days. Have you received any prior offers? Is the seller open to a 17% concession, seller financing, or rate buy-down credit?
- Built in 1951 — when were the roof, HVAC, electrical panel, plumbing, and water heater last replaced?
- Property tax is high relative to price — has the assessment been appealed recently, and will the sale trigger a re-assessment?
- Is there a deadline driving the sale (1031 exchange, divorce, estate, relocation)? That informs how much negotiation room exists.
- Schools are D-rated, which usually means shorter tenancies and higher turnover. Who's the typical renter profile here, and what's been the actual vacancy rate?
- The area grade is low — what's the realistic commute time and amenity access for the typical tenant pool here? Any planned neighborhood developments (good or bad) we should know about?
- What's the average days-on-market for RENTAL listings here right now (not sales)? A rising rental-DOM trend means longer vacancies and softer asking-rent achievability than the comps imply.
- What's the recent tenant-quality profile in this submarket — average credit score on applications, eviction rate, late-payment / NSF rate, and stable-employment percentage? A property-management company in the area should have these aggregated.
- How much new for-sale + rental construction is in the pipeline within 1–3 miles? Heavy new supply typically softens prices + rents 12–24 months out; constrained supply supports both.
Investment metrics
- 1% rule
- 0.88% ✗
- Cap rate
- 5.13%
- Cash-on-cash
- -4.14%
- DSCR
- 0.82
- GRM
- 9.5
CMA / ARV
- ARV (median comp)
- $147,951
- List price
- $149,900
- Delta
- 1.32%
- Verdict
- FAIR
- Comps
- 20 within 1.0 mi
Show comp detail 7 sales within ~0.75 mi
| Address | Dist | Beds/Ba | Sqft | Sold | Price | $/sf | Match |
|---|---|---|---|---|---|---|---|
| 506 Sage Dr | 0.04mi | 2/1.0 (-1) | 1,008 (+10%) | 4mo | $137,000 | $136 | 74 |
| 2106 6th St | 0.50mi | 3/1.0 | 936 (+2%) | 1mo | $140,000 | $150 | 73 |
| 1304 Pugh Dr | 0.55mi | 2/1.0 (-1) | 955 (+4%) | 5mo | $194,000 | $203 | 58 |
| 1407 Craig Dr | 0.50mi | 2/1.0 (-1) | 872 (-5%) | 10mo | $161,500 | $185 | 55 |
| 2107 7th St | 0.51mi | 2/1.0 (-1) | 889 (-3%) | 21mo | $140,000 | $157 | 48 |
| 153 De Haven St | 0.52mi | 2/1.0 (-1) | 880 (-4%) | 23mo | $150,000 | $170 | 45 |
| 2105 12th St | 0.59mi | 2/1.5 (-1) | 810 (-12%) | 10mo | $163,000 | $201 | 38 |
Match score weights: distance 35% · size 25% · config 20% · recency 20%. Top-matched comps best support the ARV.
Projected returns pro-forma
4.96% appreciation · 3.0% rent growth · sell at horizon
- IRR
- 9.3%
- Equity multiple
- 1.60×
- Total profit
- $25,100
- Equity at exit
- $84,594
- IRR
- 11.0%
- Equity multiple
- 3.01×
- Total profit
- $84,254
- Equity at exit
- $145,707
Cash invested: $41,972 (down + closing). Projections, not guarantees.
Landlord ↔ Tenant lean methodology
- Overall (STATE)
- 87 Strongly Landlord-Friendly
- State Texas
- 87 Strongly Landlord-Friendly · R+5
- County
- — inherits STATE
- City
- — inherits STATE
ZIP-level market 77547
- Home prices YoY
- 2.0%
- Active inventory
- 38
- Price-to-rent
- 9.5×
Monthly cashflow live
- Estimated rent
- $1,314 high interval (Pro) →
- Mortgage (P&I)
- −$786
- Tax from tax record
- −$334 /mo · $4,010/yr
- Insurance
- −$62
- HOA
- −$0
- Vacancy / Maint / Mgmt
- −$276
- Net cashflow
- $-145
Break-even live
Sensitivity live
| Price | -10% $-60 | -5% $-102 | +0% $-145 | +5% $-187 | +10% $-230 |
|---|---|---|---|---|---|
| Rent | -10% $-249 | -5% $-197 | +0% $-145 | +5% $-93 | +10% $-41 |
| Rate | -1.0pp $-69 | -0.5pp $-107 | base $-145 | +0.5pp $-184 | +1.0pp $-223 |
UW: 25.0% down · 7.5% · 30yr · 1.5% tax · 5.0% vac · 8.0% maint · 8.0% mgmt
Financing live
Cash to close
- Down payment
- $37,475
- Closing costs
- $4,497
- Reserves months
- —
- Total cash needed
- —
Loan-product check · same deal, 3 products live
Conventional
25% down · 7.5% · 30yr
- Down + closing
- —
- Monthly P&I
- —
- Monthly cashflow
- —
- DSCR
- —
- Eligible?
- —
Personal DTI + credit; lowest rate.
DSCR
20% down · 8.5% · 30yr
- Down + closing
- —
- Monthly P&I
- —
- Monthly cashflow
- —
- DSCR
- —
- Eligible?
- —
No personal income docs; deal must DSCR.
Hard money
10% down · 12.0% · 12mo
- Down + closing
- —
- Monthly P&I
- —
- Monthly cashflow
- —
- DSCR
- —
- Eligible?
- —
Short-term bridge; refi at stabilization.
Rent comps 5 comps
| Address | Beds | Baths | Sqft | Rent | $/sqft | DOM | Units | Dist |
|---|---|---|---|---|---|---|---|---|
| 423 Armstrong St Houston, TX | 3.0 | 2.0 | 1090 | $1,499 | $1.38 | 0d | 1 | 0.12mi |
| 403 Armstrong St Houston, TX | 3.0 | 2.0 | 909 | $1,399 | $1.54 | 0d | 1 | 0.19mi |
| 335 Delaware St Houston, TX | 2.0 | 1.0 | 784 | $940 | $1.20 | 14d | 1 | 0.23mi |
| 9743 Veyblum St Unit B Houston, TX | 3.0 | 2.0 | 872 | $1,145 | $1.31 | 7d | 1 | 0.93mi |
| 9713 Stedman St Unit b Houston, TX | 3.0 | 2.0 | 872 | $1,095 | $1.26 | 45d | 1 | 1.08mi |
Listing history 40 events
-
2026-06-21days on market $149,900 Active 54 DOM
-
2026-06-18days on market $149,900 Active 51 DOM
-
2026-06-17days on market $149,900 Active 50 DOM
-
2026-06-16days on market $149,900 Active 49 DOM
-
2026-06-15days on market $149,900 Active 48 DOM
-
2026-06-13days on market $149,900 Active 46 DOM
-
2026-06-13days on market $149,900 Active 45 DOM
-
2026-06-09days on market $149,900 Active 42 DOM
-
2026-06-08days on market $149,900 Active 41 DOM
-
2026-06-07days on market $149,900 Active 40 DOM
-
2026-06-04days on market $149,900 Active 37 DOM
-
2026-06-03days on market $149,900 Active 36 DOM
-
2026-06-02days on market $149,900 Active 35 DOM
-
2026-06-01days on market $149,900 Active 34 DOM
-
2026-05-31days on market $149,900 Active 33 DOM
-
2026-04-28$149,900 Active 343-char remark
-
2026-04-13historical
-
2025-05-16$155,000 Active
-
2025-05-16historical
-
2025-03-31price $165,000
-
2025-01-07$170,000 Active
-
2025-01-07historical
-
2024-09-16price $185,999
-
2024-08-24$195,999 Active
-
2024-08-20historical
-
2024-06-24$189,999 Active
-
2024-06-24historical
-
2024-02-02$199,999 Active
-
2023-11-01historical
-
2023-04-17price $205,000
-
2023-01-26$185,000 Active
-
2023-01-26historical
-
2022-09-06price $195,000
-
2022-04-29$205,000 Active
-
2019-10-16soldstatus
-
2019-10-15soldstatus Sold
-
2019-10-04status Pending
-
2019-09-27$74,900 Active
-
2019-08-22soldstatus
-
1988-01-02soldstatus
ⓘ Source: listings_history table (triggers on properties + properties_extension) + one-shot
backfill from property_details.listing_events for pre-trigger history.
Tax reassessment forecast TX · Resets to sale price
- Current annual tax
- $4,010 · $334/mo
- Projected year-2 tax
- $4,010 · $334/mo
- Expected delta
- $0/yr ($0/mo · 0.0%)
ⓘ Screening estimate from a state-policy table — verify with the county assessor before closing.
Climate risk First Street
- Flood 1/10 Low FEMA zone X (unshaded) · 0% chance over 30 yrs
- Wildfire 3/10 Moderate
- Heat 9/10 Extreme 7 d/yr ≥109°F today · 24 d/yr by 30 yrs out
- Wind 9/10 Extreme 99% chance of damaging wind over 30 yrs
- Air quality 2/10 Low 2 unhealthy d/yr today · 2 by 30 yrs out
Nearby sold comps map
Loading sold comps map…
Walkable amenities ~0.75 mi
Loading nearby amenities…
Taxation est. · year 1
- Rental income
- $15,764
- − Mortgage interest
- −$8,397
- − Property taxes
- −$4,010
- − Insurance
- −$750
- − Repairs & maintenance
- −$1,261
- − Management
- −$1,261
- − Depreciation
- −$4,361
- Taxable loss
- −$4,275
- Est. tax savings @ 24.0%
- +$1,026
- After-tax cash flow
- $-713/yr
For passive investors: Depreciation is non-cash, so a rental often shows a tax loss while cash-flowing — sheltering income. Rental losses are passive: they offset passive income freely, and up to $25,000/yr can offset ordinary (W-2) income if you actively participate and your MAGI is under $100k (phasing out to $0 by $150k); unused losses carry forward. On sale, claimed depreciation is recaptured at up to 25%, and gains may owe capital-gains tax (a 1031 exchange can defer both). Figures are a year-1 estimate at your 24.0% rate — not tax advice; consult a CPA.
Schools (NCES district)
- District
- Galena Park ISD
- NCES district ID
- 4820250
- Math proficiency
- 32% ▼ -20.00%
- Reading proficiency
- 33% ▼ -7.00%
- Median HH income
- $43,158
- Composite
- 27.62/100
- National rank
- #6927
- State rank
- #578 of 826 in TX
Livability — Galena Park
- Score
- 68/100
- State rank
- #456
- US rank
- #9227
Category grades
Schools grade is shown separately in the Schools card above.
Census & demographics
- Census place
- Galena Park, TX
- City population
- 9,380
- Population (ZIP)
- 9,380
Population outlook (Harris County) Hauer SSP2
- Today (2025)
- 5,571,493 people
- By 2030
- 6,089,821 · +9.3%
- By 2040
- 7,142,806 · +28.2%
- By 2050
- 8,185,864 · +46.9%
- By 2075
- 10,574,329 · +89.8%
- By 2100
- 12,109,958 · +117.4%
Race, ethnicity, and origin ACS 2023
- Neighborhood character
- Predominantly Hispanic (90%)
- Race & ethnicity
- Hispanic / Latino 90% Two or more races 46% Black 5% White 4%
- Hispanic origin (detail)
- Mexican 88%
- Foreign-born
- 32% · Canada
- Languages at home
- 21% English-only · Spanish 79%
Political lean MEDSL · Harris
- 2024 margin
- Lean D (+5.5) · D 52.0% · R 46.4% · Other 1.6%
- 2008→2024 swing
- +3.9pp toward D · 2008: 1.6pp · 2024: 5.5pp
- All cycles
- 2024: D+5.5 2020: D+13.3 2016: D+12.4 2012: D+0.1 2008: D+1.6
Not yet ingested
- Civics
- —
Market trends
- HPI YoY
- ▲ 4.96%
- Current HPI
- 252.9899
- Rent YoY
- —
- Metro
- —
- State GDP YoY
- ▲ 3.95%
- F500 in state
- 110
Industry mix (Fortune 500 HQ in TX)
| Industry | F500 HQs | Revenue |
|---|---|---|
| Energy | 16 | $1,198B |
|
||
| Technology | 5 | $198B |
|
||
| Engineering / Construction | 4 | $72B |
|
||
| Energy Services | 3 | $60B |
|
||
| Utilities | 3 | $41B |
|
||
| Healthcare | 2 | $330B |
|
||
Price history
+100.1% since first listed25 events — show timeline
- 2026-04-28 Listed $149,900 HARMLS
- 2026-04-13 Listing Removed — HARMLS
- 2025-05-16 Listing Removed — HARMLS
- 2025-05-16 Listed $155,000 HARMLS
- 2025-03-31 Price Changed $165,000 HARMLS
- 2025-01-07 Listing Removed — HARMLS
- 2025-01-07 Listed $170,000 HARMLS
- 2024-09-16 Price Changed $185,999 HARMLS
- 2024-08-24 Listed $195,999 HARMLS
- 2024-08-20 Listing Removed — HARMLS
- 2024-06-24 Listing Removed — HARMLS
- 2024-06-24 Listed $189,999 HARMLS
- 2024-02-02 Listed $199,999 HARMLS
- 2023-11-01 Listing Removed — HARMLS
- 2023-04-17 Price Changed $205,000 HARMLS
- 2023-01-26 Listing Removed — HARMLS
- 2023-01-26 Listed $185,000 HARMLS
- 2022-09-06 Price Changed $195,000 HARMLS
- 2022-04-29 Listed $205,000 HARMLS
- 2019-10-16 Sold (Public Records) — Public Records
- 2019-10-15 Sold (MLS) — HARMLS
- 2019-10-04 Pending — HARMLS
- 2019-09-27 Listed $74,900 HARMLS
- 2019-08-22 Sold (Public Records) — Public Records
- 1988-01-02 Sold (Public Records) — Public Records
Property tax history
+8.4%/yrLatest (2025): $4,010 · -3.2% YoY. Source: county tax records.
Cash-flow waterfall
monthlySold comps — $/sqft
last 12 mo · ≤1 miLoading sold comps…