338 Main St Unit 8H · San Francisco, CA
Flood risk 1/10 · Minimal
- FEMA flood zone
- X (unshaded)
- Chance of flooding over 30 yrs
- 0.0%
- Est. flood insurance / yr
- $507 – $1,088
Fire risk 1/10 · Minimal
- Est. fire insurance / yr
- $659 – $1,223
Heat risk 2/10 · Minimal
- Hot days now (above 79°F)
- 7 days/yr
- Hot days in 30 yrs
- 15 days/yr
Wind risk 1/10 · Minimal
- Chance of severe wind over 30 yrs
- —
Air-quality risk 8/10 · Major
- Unhealthy air days now
- 15 days/yr
- Unhealthy air days in 30 yrs
- 15 days/yr
Risk factors via First Street. Map © Google.
Why this score? — see what drove the D- grade
The composite is a weighted blend of 9 inputs, each scored 0–100. Each bar is that input's sub-score; the figure is the points it added to the 100-point composite (weight × sub-score).
- ARV discount +15.0/15.0
- Appreciation +7.1/10.0
- Rent growth +5.0/5.0
- Schools +5.0/10.0
- Livability +3.8/5.0
- Condition / age +2.5/5.0
- Cash flow +1.2/30.0
- 1% rule +0.3/10.0
- DSCR +0.0/10.0
$945,000
🖨 Deal sheet (PDF) 📄 Offer letter ✓ Due diligence
Listing remarks MLS
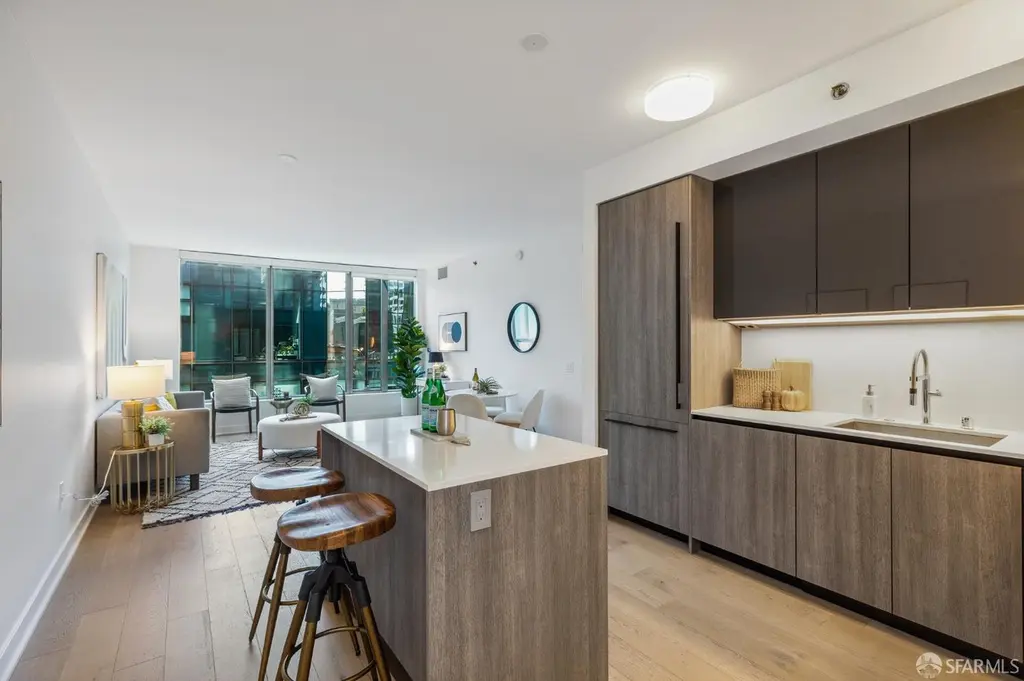
Welcome to this bright 8th-floor residence at LUMINA! Showcasing an open layout where the living/dining room flows into the modern kitchen with a convenient island, featuring Gaggenau appliances, SieMatic Cabinets, and premium Caesarstone quartz countertops. Luxury upgrades include expensive wood floors throughout, custom closet organizers, Nest smart thermostat, custom window treatments, and more. Designed by Bernardo Fort-Brescia of Arquitectonica, LUMINA offers residents world-class amenities such as a full-length saline lap pool, a 7,000 sq. ft. state-of-the-art gym, landscaped outdoor spaces, a rooftop, valet parking, 24-hour door service, and front desk service. On the ground floor of LUMINA, Woodlands Market offers organic and natural products from local suppliers, prepared foods, and a coffee bar. Walking distance to the Embarcadero waterfront, Ferry Building, the Financial District, South Beach Marina, SF Giants Ballpark, the Golden State Warriors' new arena, cafes, and some of the best fine dining in the city.
Key facts
- $1,360 HOA
- Garage
- Community pool
Neighborhood map
What this means for you Summary
Snapshot
- This is a 1-bed/1.0-bath condo listed at $945k.
Deal economics
- At list price, monthly cash flow is $-4k ($-46k/yr) — negative.
- To cash-flow at today's rent, offer at most $268k (71.6% below list).
- To meet the 1% rule (rent ≥ 1% of price), the offer needs to be $498k (47.3% below list).
- Recommended offer: $268k (71.6% below list) — sets the bar for cash-flow.
- Cap rate 1.4% vs local median 2.1% in San Francisco — below-typical yield; the buyer is paying a premium for something (appreciation thesis, condition, location) that the cap rate doesn't capture.
Location & tenants
- Location reads 76/100 on livability (#90 in CA, #3,143 nationally) — a middle-class / working-renter tenant base. Strengths: amenities A+, commute A+, employment A+; Watch: crime F, cost of living F.
- San Francisco Unified (urban): math 50% / reading 56% proficiency, ranked #322 of 1,400 in CA (top 23%) — acceptable for families but not a draw, mixed tenant base, ~2y average lease.
- Zoned schools: Lilienthal (Claire) Elementary (669 students, 19% FRL); Giannini (A.P.) Middle (1,192 students, 34% FRL); Lowell High (2,632 students, 37% FRL) — zoned schools average 30% FRL vs 49% district-wide (19 pts lower); this property's tenant base skews higher-income than the district average.
- Market conditions: Rents rising fast (+19.7%/yr); 119 active listings in the ZIP; 40 comparable units currently listed for rent nearby; rentals leasing fast (median 5d on market — plan ~1-2 weeks tenant-placement turnaround); high-income renter base; 750 units permitted in San Francisco County in 2024 (688 in 5+ unit buildings).
Forward outlook
- In year one you build about $47k of equity ($7k loan paydown + $40k appreciation (4.3% local appreciation)).
- San Francisco County population projected at +39% by 2050 — long-run rental-demand tailwind backs the buy-and-hold thesis.
- By year 2, paydown + projected appreciation supports a ~$75k cash-out refi (75% LTV) — recoverable capital for the next deal without selling this one.
Negotiation context
- It's been on market 31 days — a 3% lower offer ($917k) is reasonable based on typical stale-listing flexibility.
- 6 sale attempts since 6y ago with the ask held roughly flat each time — persistent listings suggest the price (not the market) is what's stuck; bring a comps-based counter.
Risks & watch-outs
- Watch-outs: HOA is 27% of rent.
Questions for the listing agent
- What do current leases actually rent for vs. the listed asking? Can we see a recent rent roll and the last 12 months of T-12 income?
- It's been on market 31 days. Have you received any prior offers? Is the seller open to a 72% concession, seller financing, or rate buy-down credit?
- What does the HOA fee cover, when was the last increase, and are there any pending special assessments or reserve-fund shortfalls?
- Any open or pending special assessments — roof, HVAC, plumbing, elevator, façade? What's the per-unit balance and payoff schedule, and is the seller paying it off at close or rolling it to the buyer?
- Is there a deadline driving the sale (1031 exchange, divorce, estate, relocation)? That informs how much negotiation room exists.
- Schools are B-rated — typically a magnet for longer-tenancy family renters. What's the average tenant stay here, and is there a school-zone premium baked into asking?
- Crime grade is F in this area — have there been break-ins, vandalism, or insurance claims at this property in the last 3 years? What carrier currently insures it and at what premium?
- The area grade is low — what's the realistic commute time and amenity access for the typical tenant pool here? Any planned neighborhood developments (good or bad) we should know about?
- What's the average days-on-market for RENTAL listings here right now (not sales)? A rising rental-DOM trend means longer vacancies and softer asking-rent achievability than the comps imply.
- What's the recent tenant-quality profile in this submarket — average credit score on applications, eviction rate, late-payment / NSF rate, and stable-employment percentage? A property-management company in the area should have these aggregated.
- How much new apartment / multifamily construction is in the pipeline within 1–3 miles? Heavy new supply (>2% of stock underway) typically softens rents 12–24 months out; light construction supports rent growth.
Investment metrics
- 1% rule
- 0.53% ✗
- Cap rate
- 1.43%
- Cash-on-cash
- -17.37%
- DSCR
- 0.23
- GRM
- 15.8
CMA / ARV
- ARV (median comp)
- $1,144,927
- List price
- $945,000
- Delta
- -17.46%
- Verdict
- UNDERPRICED
- Comps
- 20 within 1.0 mi
Projected returns pro-forma
4.27% appreciation · 8.0% rent growth · sell at horizon
- IRR
- -2.3%
- Equity multiple
- 0.86×
- Total profit
- $-37,988
- Equity at exit
- $494,032
- IRR
- 3.6%
- Equity multiple
- 1.68×
- Total profit
- $181,038
- Equity at exit
- $820,153
Cash invested: $264,600 (down + closing). Projections, not guarantees.
Landlord ↔ Tenant lean methodology
- Overall (CITY)
- 0 Strongly Tenant-Friendly
- State California
- 18 Strongly Tenant-Friendly · D+13
- County
- — inherits STATE
- City San Francisco
- 0 Strongly Tenant-Friendly · D+57
ZIP-level market 94105
- Home prices YoY
- 2.4%
- Rents YoY
- 19.7%
- Active inventory
- 119
- Price-to-rent
- 15.8×
Monthly cashflow live
- Estimated rent
- $4,979 high interval (Pro) →
- Mortgage (P&I)
- −$4,956
- Tax from tax record
- −$1,054 /mo · $12,649/yr
- Insurance
- −$394
- HOA
- −$1,360
- Vacancy / Maint / Mgmt
- −$1,046
- Net cashflow
- $-3,830
Break-even live
Sensitivity live
| Price | -10% $-3,295 | -5% $-3,563 | +0% $-3,830 | +5% $-4,098 | +10% $-4,365 |
|---|---|---|---|---|---|
| Rent | -10% $-4,223 | -5% $-4,027 | +0% $-3,830 | +5% $-3,633 | +10% $-3,437 |
| Rate | -1.0pp $-3,354 | -0.5pp $-3,590 | base $-3,830 | +0.5pp $-4,075 | +1.0pp $-4,324 |
UW: 25.0% down · 7.5% · 30yr · 1.5% tax · 5.0% vac · 8.0% maint · 8.0% mgmt
Financing live
Cash to close
- Down payment
- $236,250
- Closing costs
- $28,350
- Reserves months
- —
- Total cash needed
- —
Loan-product check · same deal, 3 products live
Conventional
25% down · 7.5% · 30yr
- Down + closing
- —
- Monthly P&I
- —
- Monthly cashflow
- —
- DSCR
- —
- Eligible?
- —
Personal DTI + credit; lowest rate.
DSCR
20% down · 8.5% · 30yr
- Down + closing
- —
- Monthly P&I
- —
- Monthly cashflow
- —
- DSCR
- —
- Eligible?
- —
No personal income docs; deal must DSCR.
Hard money
10% down · 12.0% · 12mo
- Down + closing
- —
- Monthly P&I
- —
- Monthly cashflow
- —
- DSCR
- —
- Eligible?
- —
Short-term bridge; refi at stabilization.
Rent comps 40 comps
| Address | Beds | Baths | Sqft | Rent | $/sqft | DOM | Units | Dist |
|---|---|---|---|---|---|---|---|---|
| 333 Main St San Francisco, CA | 1.0 | 1.0 | 835 | $4,950 | $5.93 | 45d | 1 | 0.01mi |
| 301 Main St Unit 20C San Francisco, CA | 1.0 | 1.0 | 758 | $5,950 | $7.85 | 26d | 1 | 0.03mi |
| 280 Spear St San Francisco, CA | 1.0–2.0 | 1.0 | 865 | $6,100 | $7.05 | 45d | 2 | 0.10mi |
| 403 Main St Unit 206N San Francisco, CA | 1.0 | 1.0 | 910 | $5,200 | $5.71 | 26d | 1 | 0.10mi |
| 201 Harrison St Unit 3A San Francisco, CA | 1.0 | 1.0 | 572 | $1,900 | $3.32 | 23d | 1 | 0.11mi |
| 400 Beale St San Francisco, CA | 1.0 | 1.0 | 812 | $4,260 | $5.25 | 45d | 1 | 0.13mi |
| 400 Beale St San Francisco, CA | 2.0 | 1.0–2.0 | 1167 | $6,425 | $5.50 | 22d | 2 | 0.13mi |
| 399 Fremont St San Francisco, CA | 2.0 | 1.0–2.0 | 825 | $6,620 | $8.02 | 0d | 44 | 0.14mi |
| 299 Fremont St San Francisco, CA | 1.0 | 1.0 | 536 | $5,829 | $10.88 | 0d | 7 | 0.15mi |
| 38 Bryant St #806 San Francisco, CA | 1.0 | 1.0 | 582 | $3,995 | $6.86 | 45d | 1 | 0.16mi |
| 340 Fremont St San Francisco, CA | 3.0 | 1.0–3.0 | 1146 | $5,697 | $4.97 | 3d | 5 | 0.17mi |
| 355 1st St Unit S302 San Francisco, CA | 2.0 | 2.0 | 939 | $5,800 | $6.18 | 45d | 1 | 0.20mi |
| 88 Howard St San Francisco, CA | 1.0 | 1.0 | 578 | $4,960 | $8.57 | 0d | 10 | 0.21mi |
| 500 Folsom St San Francisco, CA | 1.0 | 1.0 | 676 | $6,987 | $10.34 | 0d | 18 | 0.24mi |
| 390 1st St San Francisco, CA | 2.0 | 1.0–2.0 | 676 | $5,814 | $8.60 | 0d | 12 | 0.25mi |
| 3 Bayside Village Pl San Francisco, CA | 2.0 | 1.0–2.0 | 686 | $5,168 | $7.53 | 0d | 22 | 0.25mi |
| 45 Lansing St San Francisco, CA | 1.0 | 1.0 | 640 | $5,332 | $8.32 | 0d | 4 | 0.26mi |
| 501 Delancey St #182 San Francisco, CA | 1.0 | 1.0 | 640 | $3,200 | $5.00 | 16d | 1 | 0.27mi |
| 39 Tehama St San Francisco, CA | 1.0–2.0 | 1.0–2.0 | 1291 | $4,760 | $3.69 | 0d | 13 | 0.31mi |
| 631 Folsom St San Francisco, CA | 2.0 | 2.0 | 1054 | $6,400 | $6.07 | 26d | 1 | 0.43mi |
| 219 Brannan St Unit 2B San Francisco, CA | 2.0 | 2.0 | 1062 | $6,000 | $5.65 | 7d | 1 | 0.44mi |
| 1 Pine St San Francisco, CA | 1.0 | 1.0 | 846 | $3,900 | $4.61 | 20d | 1 | 0.45mi |
| 2 Townsend St San Francisco, CA | 1.0–2.0 | 1.0–2.0 | 786 | $4,800 | $6.11 | 0d | 4 | 0.48mi |
| 1 Hawthorne St Unit 8G San Francisco, CA | 1.0 | 1.0 | 846 | $4,200 | $4.96 | 20d | 1 | 0.49mi |
| 1 St Francis Pl San Francisco, CA | 3.0 | 1.0–2.0 | 923 | $4,246 | $4.60 | 0d | 4 | 0.52mi |
| 88 Townsend St #311 San Francisco, CA | 1.0 | 1.0 | 632 | $4,450 | $7.04 | 26d | 1 | 0.56mi |
| 460 Davis Ct San Francisco, CA | 3.0 | 1.0–2.5 | 907 | $6,264 | $6.91 | 0d | 15 | 0.66mi |
| 555 Bryant St San Francisco, CA | 2.0 | 1.0–2.0 | 687 | $5,338 | $7.77 | 0d | 10 | 0.70mi |
| 555 4th St #539 San Francisco, CA | 1.0 | 1.0 | 752 | $4,500 | $5.98 | 45d | 1 | 0.73mi |
| 821 Folsom St #401 San Francisco, CA | 1.0 | 1.0 | 652 | $3,650 | $5.60 | 26d | 1 | 0.77mi |
| 601 4th St #1523 San Francisco, CA | 1.0 | 1.0 | 1085 | $6,070 | $5.59 | 0d | 1 | 0.78mi |
| 260 King St #717 San Francisco, CA | 1.0 | 1.0 | 759 | $4,850 | $6.39 | 4d | 1 | 0.79mi |
| 255 King St San Francisco, CA | 3.0 | 1.0–2.5 | 1228 | $5,628 | $4.58 | 0d | 1 | 0.88mi |
| 540 Stockton St Apt 8 San Francisco, CA | 2.0 | 1.0 | 725 | $5,370 | $7.41 | 4d | 1 | 0.89mi |
| 1023 3rd St San Francisco, CA | 2.0 | 1.0–2.0 | 743 | $7,675 | $10.33 | 3d | 13 | 0.92mi |
| 400 Clementina St #1449 San Francisco, CA | 1.0–2.0 | 1.0–2.0 | 775 | $3,970 | $5.12 | 3d | 2 | 0.93mi |
| 900 Folsom St San Francisco, CA | 2.0 | 1.0–2.0 | 863 | $5,105 | $5.92 | 0d | 27 | 0.94mi |
| 2 Mint Plz San Francisco, CA | 2.0 | 1.0 | 800 | $4,500 | $5.62 | 45d | 1 | 0.99mi |
| 737 Bush St San Francisco, CA | 1.0 | 1.0 | 750 | $2,595 | $3.46 | 16d | 1 | 1.01mi |
| 434 Minna St San Francisco, CA | 2.0 | 1.0–2.0 | 719 | $5,231 | $7.27 | 0d | 15 | 1.01mi |
HOA detail condo
- Monthly dues
- $1,360 · $16,320/yr
- Likely covers
- waterpoolgym
- Assessments
- None detected in remarks — confirm with the listing agent.
Listing history 21 events
-
2026-06-15statusdays on market $945,000 Pending 31 DOM
-
2026-06-13days on market $945,000 Active 30 DOM
-
2026-06-13days on market $945,000 Active 29 DOM
-
2026-06-09days on market $945,000 Active 26 DOM
-
2026-06-08days on market $945,000 Active 25 DOM
-
2026-06-07days on market $945,000 Active 24 DOM
-
2026-06-04days on market $945,000 Active 21 DOM
-
2026-06-03days on market $945,000 Active 20 DOM
-
2026-06-02days on market $945,000 Active 19 DOM
-
2026-06-01days on market $945,000 Active 18 DOM
-
2026-05-31days on market $945,000 Active 17 DOM
-
2026-05-14status Active 1035-char remark
Show marketing remark (1035 chars)
Welcome to this bright 8th-floor residence at LUMINA! Showcasing an open layout where the living/dining room flows into the modern kitchen with a convenient island, featuring Gaggenau appliances, SieMatic Cabinets, and premium Caesarstone quartz countertops. Luxury upgrades include expensive wood floors throughout, custom closet organizers, Nest smart thermostat, custom window treatments, and more. Designed by Bernardo Fort-Brescia of Arquitectonica, LUMINA offers residents world-class amenities such as a full-length saline lap pool, a 7,000 sq. ft. state-of-the-art gym, landscaped outdoor spaces, a rooftop, valet parking, 24-hour door service, and front desk service. On the ground floor of LUMINA, Woodlands Market offers organic and natural products from local suppliers, prepared foods, and a coffee bar. Walking distance to the Embarcadero waterfront, Ferry Building, the Financial District, South Beach Marina, SF Giants Ballpark, the Golden State Warriors' new arena, cafes, and some of the best fine dining in the city.
-
2026-04-08historical 1035-char remark
Show marketing remark (1035 chars)
Welcome to this bright 8th-floor residence at LUMINA! Showcasing an open layout where the living/dining room flows into the modern kitchen with a convenient island, featuring Gaggenau appliances, SieMatic Cabinets, and premium Caesarstone quartz countertops. Luxury upgrades include expensive wood floors throughout, custom closet organizers, Nest smart thermostat, custom window treatments, and more. Designed by Bernardo Fort-Brescia of Arquitectonica, LUMINA offers residents world-class amenities such as a full-length saline lap pool, a 7,000 sq. ft. state-of-the-art gym, landscaped outdoor spaces, a rooftop, valet parking, 24-hour door service, and front desk service. On the ground floor of LUMINA, Woodlands Market offers organic and natural products from local suppliers, prepared foods, and a coffee bar. Walking distance to the Embarcadero waterfront, Ferry Building, the Financial District, South Beach Marina, SF Giants Ballpark, the Golden State Warriors' new arena, cafes, and some of the best fine dining in the city.
-
2026-04-08$945,000 1035-char remark
Show marketing remark (1035 chars)
Welcome to this bright 8th-floor residence at LUMINA! Showcasing an open layout where the living/dining room flows into the modern kitchen with a convenient island, featuring Gaggenau appliances, SieMatic Cabinets, and premium Caesarstone quartz countertops. Luxury upgrades include expensive wood floors throughout, custom closet organizers, Nest smart thermostat, custom window treatments, and more. Designed by Bernardo Fort-Brescia of Arquitectonica, LUMINA offers residents world-class amenities such as a full-length saline lap pool, a 7,000 sq. ft. state-of-the-art gym, landscaped outdoor spaces, a rooftop, valet parking, 24-hour door service, and front desk service. On the ground floor of LUMINA, Woodlands Market offers organic and natural products from local suppliers, prepared foods, and a coffee bar. Walking distance to the Embarcadero waterfront, Ferry Building, the Financial District, South Beach Marina, SF Giants Ballpark, the Golden State Warriors' new arena, cafes, and some of the best fine dining in the city.
-
2024-01-25historical $4,190
-
2024-01-24$4,190
-
2022-11-22status Pending
-
2022-10-28price $999,000
-
2022-09-16$1,025,000 Active
-
2021-09-01$1,149,000 Active
-
2020-10-11$1,050,000
ⓘ Source: listings_history table (triggers on properties + properties_extension) + one-shot
backfill from property_details.listing_events for pre-trigger history.
Tax reassessment forecast CA · Resets to sale price
- Current annual tax
- $12,649 · $1,054/mo
- Projected year-2 tax
- $12,649 · $1,054/mo
- Expected delta
- $0/yr ($0/mo · 0.0%)
ⓘ Screening estimate from a state-policy table — verify with the county assessor before closing.
Climate risk First Street
- Flood 1/10 Low FEMA zone X (unshaded) · 0% chance over 30 yrs
- Wildfire 1/10 Low
- Heat 2/10 Low 7 d/yr ≥79°F today · 15 d/yr by 30 yrs out
- Wind 1/10 Low
- Air quality 8/10 Severe 15 unhealthy d/yr today · 15 by 30 yrs out
Nearby sold comps map
Loading sold comps map…
Walkable amenities ~0.75 mi
Loading nearby amenities…
Taxation est. · year 1
- Rental income
- $59,748
- − Mortgage interest
- −$52,935
- − Property taxes
- −$12,649
- − Insurance
- −$4,725
- − Repairs & maintenance
- −$4,780
- − Management
- −$4,780
- − HOA
- −$16,320
- − Depreciation
- −$27,491
- Taxable loss
- −$63,932
- Est. tax savings @ 24.0%
- +$15,344
- After-tax cash flow
- $-30,618/yr
For passive investors: Depreciation is non-cash, so a rental often shows a tax loss while cash-flowing — sheltering income. Rental losses are passive: they offset passive income freely, and up to $25,000/yr can offset ordinary (W-2) income if you actively participate and your MAGI is under $100k (phasing out to $0 by $150k); unused losses carry forward. On sale, claimed depreciation is recaptured at up to 25%, and gains may owe capital-gains tax (a 1031 exchange can defer both). Figures are a year-1 estimate at your 24.0% rate — not tax advice; consult a CPA.
Schools (NCES district)
- District
- San Francisco Unified
- NCES district ID
- 0634410
- Math proficiency
- 50% ▬ 0.00%
- Reading proficiency
- 56% ▲ 1.00%
- Median HH income
- $81,249
- Composite
- 50.14/100
- National rank
- #4088
- State rank
- #322 of 1400 in CA
Livability — San Francisco
- Score
- 76/100
- State rank
- #90
- US rank
- #3143
Category grades
Schools grade is shown separately in the Schools card above.
Census & demographics
- Census place
- San Francisco, CA
- County
- San Francisco County · 827,552 people
- City population
- 827,552
- Metro
- San Francisco-Oakland-Berkeley, CA
- Population (ZIP)
- 13,861
- Household income
- $225,000
- Rent vs Own
- Severe rent burden
- 798.0
Population outlook (San Francisco County) Hauer SSP2
- Today (2025)
- 1,030,936 people
- By 2030
- 1,110,409 · +7.7%
- By 2040
- 1,270,010 · +23.2%
- By 2050
- 1,435,001 · +39.2%
- By 2075
- 1,779,074 · +72.6%
- By 2100
- 1,966,767 · +90.8%
Race, ethnicity, and origin ACS 2023
- Neighborhood character
- Diverse neighborhood (Simpson 0.61)
- Race & ethnicity
- Asian 53% White 31% Hispanic / Latino 9% Two or more races 5% Black 2%
- Hispanic origin (detail)
- Mexican 4%
- Common ancestry
- Italian 4% Scotch-Irish 2% Romanian 2%
- Foreign-born
- 45% · China, Canada, South Korea
- Languages at home
- 52% English-only · Chinese 22% Other Indo-European 6% Spanish 6%
Political lean MEDSL · San Francisco
- 2024 margin
- Solid D (+64.8) · D 80.3% · R 15.5% · Other 4.1%
- 2008→2024 swing
- -5.7pp toward R · 2008: 70.5pp · 2024: 64.8pp
- All cycles
- 2024: D+64.8 2020: D+72.5 2016: D+76.1 2012: D+70.2 2008: D+70.5
Not yet ingested
- Civics
- —
Market trends
- HPI YoY
- ▲ 4.27%
- Current HPI
- 179.3791
- Rent YoY
- ▲ 19.74%
- Metro
- San Francisco-Oakland-Berkeley, CA
- State GDP YoY
- ▲ 3.21%
- F500 in state
- 116
Industry mix (Fortune 500 HQ in CA)
| Industry | F500 HQs | Revenue |
|---|---|---|
| Technology | 27 | $1,492B |
|
||
| Financial Services | 3 | $174B |
|
||
| Retail | 3 | $44B |
|
||
| Insurance | 3 | $26B |
|
||
| Media / Entertainment | 2 | $115B |
|
||
| Pharmaceuticals / Biotech | 2 | $62B |
|
||
Price history
-10.0% since first listed10 events — show timeline
- 2026-05-14 Relisted — San Francisco MLS
- 2026-04-08 Delisted — San Francisco MLS
- 2026-04-08 Listed $945,000 San Francisco MLS
- 2024-01-25 Rental Removed $4,190 SFARMLS
- 2024-01-24 Listed for Rent $4,190 SFARMLS
- 2022-11-22 Pending — San Francisco MLS
- 2022-10-28 Price Changed $999,000 San Francisco MLS
- 2022-09-16 Listed $1,025,000 San Francisco MLS
- 2021-09-01 Listed $1,149,000 BAREIS
- 2020-10-11 Listed $1,050,000 San Francisco MLS
Property tax history
+20.1%/yrLatest (2025): $12,649 · -2.1% YoY. Source: county tax records.
Cash-flow waterfall
monthlySold comps — $/sqft
last 12 mo · ≤1 miLoading sold comps…