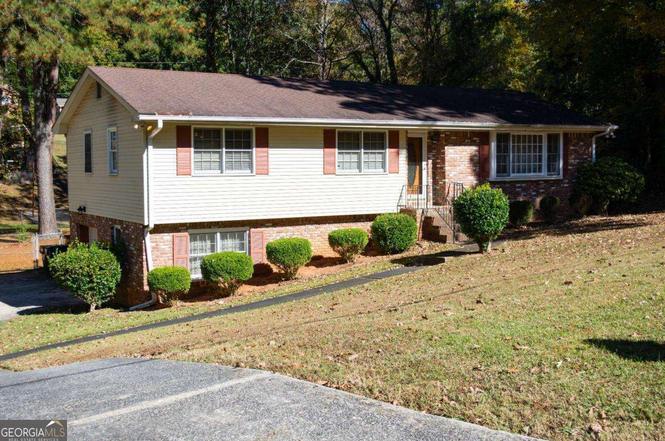
2719 Waleska Way · East Point, GA
Flood risk 1/10 · Minimal
- FEMA flood zone
- X (unshaded)
- Chance of flooding over 30 yrs
- 0.0%
- Est. flood insurance / yr
- $473 – $860
Fire risk 1/10 · Minimal
- Est. fire insurance / yr
- $963 – $1,789
Heat risk 5/10 · Moderate
- Hot days now (above 103°F)
- 7 days/yr
- Hot days in 30 yrs
- 18 days/yr
Wind risk 5/10 · Moderate
- Chance of severe wind over 30 yrs
- 25.0%
Air-quality risk 3/10 · Minor
- Unhealthy air days now
- 3 days/yr
- Unhealthy air days in 30 yrs
- 3 days/yr
Risk factors via First Street. Map © Google.
Why this score? — see what drove the D- grade
The composite is a weighted blend of 9 inputs, each scored 0–100. Each bar is that input's sub-score; the figure is the points it added to the 100-point composite (weight × sub-score).
- Cash flow +12.6/30.0
- Schools +4.5/10.0
- ARV discount +4.4/15.0
- DSCR +3.8/10.0
- 1% rule +3.6/10.0
- Livability +3.6/5.0
- Rent growth +2.8/5.0
- Condition / age +2.5/5.0
- Appreciation +0.0/10.0
$225,000
🖨 Deal sheet (PDF) 📄 Offer letter ✓ Due diligence
Listing remarks MLS
Charming 3-bedroom, 2-bathroom home located in a quiet neighborhood of East Point. This property features a spacious living area, a large backyard, and plenty of potential for customization. Perfect for investors or buyers looking for a project to make his home! Please note, this home is being sold as-is. Don't miss out on the opportunity to make this your own! Seller preferred closing attorney Lueder Larkin and Hunter
Key facts
- Spacious living area
- Large backyard
- 0.38 acre lot
Tags
Neighborhood map
What this means for you Summary
Snapshot
- This is a 3-bed/2.0-bath single-family listed at $225k.
Deal economics
- At list price, monthly cash flow is $-29 ($-351/yr) — negative.
- To cash-flow at today's rent, offer at most $221k (1.9% below list).
- To meet the 1% rule (rent ≥ 1% of price), the offer needs to be $193k (14.2% below list).
- Recommended offer: $193k (14.2% below list) — sets the bar for 1% rule.
Location & tenants
- Location reads 72/100 on livability (#72 in GA) — a middle-class / working-renter tenant base. Strengths: commute A+, cost of living A+, housing A+; Watch: employment D+, crime F, amenities F.
- Fulton County (suburban): math 49% / reading 53% proficiency, ranked #12 of 174 in GA (top 7%) — acceptable for families but not a draw, mixed tenant base, ~2y average lease.
- Zoned schools: Hamilton E. Holmes Elementary (math 12% / reading 17%, grade F, #996 of 1,228 statewide, top 83%, 538 students, 100% FRL); Paul D. West Middle School (math 17% / reading 17%, grade F, #381 of 470 statewide, top 82%, 803 students, 100% FRL); Tri-Cities High School (math 5% / reading 30%, grade F, #264 of 424 statewide, top 63%, 1,483 students, 100% FRL) — zoned schools average 100% FRL vs 41% district-wide (59 pts higher); higher-poverty schools than district average — tighter screening recommended.
- Zoned-school proficiency averages 16% at this address vs 51% district-wide (-35 pts) — the specific schools serving this property underperform the Fulton County average; the district grade overstates school quality for this exact location.
- Market conditions: Rents rising (+1.4%/yr); 283 active listings in the ZIP; 37 comparable units currently listed for rent nearby; rentals at typical pace (median 25d on market — plan ~3-4 weeks tenant-placement turnaround); 11,565 units permitted in Fulton County in 2024 (8,159 in 5+ unit buildings).
- This rent runs 34% of the median local income ($68k/yr) — at the standard rent-burdened threshold; future hikes will face affordability resistance.
Forward outlook
- Local home prices are declining (-3.0%/yr); year-one equity from $2k of loan paydown is wiped out by about $7k of value loss. Plan a longer hold.
- Fulton County population projected at +38% by 2050 — long-run rental-demand tailwind backs the buy-and-hold thesis.
Negotiation context
- It's been on market 143 days — a 12% lower offer ($198k) is reasonable based on typical stale-listing flexibility.
- 3 sale attempts with the ask held roughly flat each time — persistent listings suggest the price (not the market) is what's stuck; bring a comps-based counter.
- Current owner paid $64k; list at $225k implies a 249% gain — meaningful room to come down on a strong offer.
Risks & watch-outs
- Climate carrying-cost: moderate wind risk, 25% chance of damaging wind over 30y; extreme-heat days projected 7→18/yr by 2055 (HVAC capex compounding) — expect insurance premiums to compound above CPI over the hold.
Questions for the listing agent
- What do current leases actually rent for vs. the listed asking? Can we see a recent rent roll and the last 12 months of T-12 income?
- It's been on market 143 days. Have you received any prior offers? Is the seller open to a 14% concession, seller financing, or rate buy-down credit?
- Built in 1960 — when were the roof, HVAC, electrical panel, plumbing, and water heater last replaced?
- Why hasn't it sold? Are there any deal-killer items the seller is aware of (foundation, flood, title, zoning, code violations)?
- Is there a deadline driving the sale (1031 exchange, divorce, estate, relocation)? That informs how much negotiation room exists.
- Schools are F-rated, which usually means shorter tenancies and higher turnover. Who's the typical renter profile here, and what's been the actual vacancy rate?
- Crime grade is F in this area — have there been break-ins, vandalism, or insurance claims at this property in the last 3 years? What carrier currently insures it and at what premium?
- The area grade is low — what's the realistic commute time and amenity access for the typical tenant pool here? Any planned neighborhood developments (good or bad) we should know about?
- What's the average days-on-market for RENTAL listings here right now (not sales)? A rising rental-DOM trend means longer vacancies and softer asking-rent achievability than the comps imply.
- What's the recent tenant-quality profile in this submarket — average credit score on applications, eviction rate, late-payment / NSF rate, and stable-employment percentage? A property-management company in the area should have these aggregated.
- How much new for-sale + rental construction is in the pipeline within 1–3 miles? Heavy new supply typically softens prices + rents 12–24 months out; constrained supply supports both.
Investment metrics
- 1% rule
- 0.86% ✗
- Cap rate
- 6.14%
- Cash-on-cash
- -0.56%
- DSCR
- 0.98
- GRM
- 9.7
CMA / ARV
- ARV (on-the-fly)
- $210,288
- Comps found
- 9
Show comp detail 9 sales within ~0.75 mi
| Address | Dist | Beds/Ba | Sqft | Sold | Price | $/sf | Match |
|---|---|---|---|---|---|---|---|
| 2921 Pine Valley Cir | 0.63mi | 3/2.0 | 1,406 (+4%) | 1mo | $170,000 | $121 | 62 |
| 2927 Arrowood Dr | 0.38mi | 3/2.0 | 1,456 (+8%) | 16mo | $219,500 | $151 | 56 |
| 2674 Bryant Dr | 0.37mi | 4/2.0 (+1) | 1,381 (+2%) | 23mo | $215,000 | $156 | 55 |
| 2609 Riggs Dr | 0.69mi | 3/2.0 | 1,372 (+2%) | 14mo | $250,000 | $182 | 53 |
| 2519 Bryan Cir | 0.68mi | 3/2.0 | 1,326 (-2%) | 16mo | $220,000 | $166 | 52 |
| 2985 Meadow Lark Dr | 0.74mi | 3/2.0 | 1,520 (+13%) | 3mo | $299,000 | $197 | 41 |
| 2498 N Bryan Cir | 0.74mi | 3/2.0 | 1,510 (+12%) | 16mo | $210,000 | $139 | 33 |
| 2484 Dodson Dr | 0.51mi | 2/1.0 (-1) | 1,182 (-12%) | 18mo | $141,000 | $119 | 31 |
| 2376 Ben Hill Rd | 0.71mi | 3/2.0 | 1,543 (+14%) | 20mo | $327,999 | $213 | 26 |
Match score weights: distance 35% · size 25% · config 20% · recency 20%. Top-matched comps best support the ARV.
Projected returns pro-forma
-3.0% appreciation · 1.35% rent growth · sell at horizon
- IRR
- -19.1%
- Equity multiple
- 0.34×
- Total profit
- $-41,448
- Equity at exit
- $33,548
- IRR
- -15.4%
- Equity multiple
- 0.19×
- Total profit
- $-50,894
- Equity at exit
- $19,454
Cash invested: $63,000 (down + closing). Projections, not guarantees.
Landlord ↔ Tenant lean methodology
- Overall (STATE)
- 90 Strongly Landlord-Friendly
- State Georgia
- 90 Strongly Landlord-Friendly · R+3
- County
- — inherits STATE
- City
- — inherits STATE
ZIP-level market 30344
- Home prices YoY
- -31.0%
- Rents YoY
- 1.4%
- Active inventory
- 283
- Price-to-rent
- 9.7×
Monthly cashflow live
- Estimated rent
- $1,931 high interval (Pro) →
- Mortgage (P&I)
- −$1,180
- Tax est. 1.5%
- −$281 /mo · $3,375/yr
- Insurance
- −$94
- HOA
- −$0
- Vacancy / Maint / Mgmt
- −$406
- Net cashflow
- $-29
Break-even live
Sensitivity live
| Price | -10% $126 | -5% $49 | +0% $-29 | +5% $-107 | +10% $-185 |
|---|---|---|---|---|---|
| Rent | -10% $-182 | -5% $-106 | +0% $-29 | +5% $47 | +10% $123 |
| Rate | -1.0pp $84 | -0.5pp $28 | base $-29 | +0.5pp $-88 | +1.0pp $-147 |
UW: 25.0% down · 7.5% · 30yr · 1.5% tax · 5.0% vac · 8.0% maint · 8.0% mgmt
Financing live
Cash to close
- Down payment
- $56,250
- Closing costs
- $6,750
- Reserves months
- —
- Total cash needed
- —
Loan-product check · same deal, 3 products live
Conventional
25% down · 7.5% · 30yr
- Down + closing
- —
- Monthly P&I
- —
- Monthly cashflow
- —
- DSCR
- —
- Eligible?
- —
Personal DTI + credit; lowest rate.
DSCR
20% down · 8.5% · 30yr
- Down + closing
- —
- Monthly P&I
- —
- Monthly cashflow
- —
- DSCR
- —
- Eligible?
- —
No personal income docs; deal must DSCR.
Hard money
10% down · 12.0% · 12mo
- Down + closing
- —
- Monthly P&I
- —
- Monthly cashflow
- —
- DSCR
- —
- Eligible?
- —
Short-term bridge; refi at stabilization.
Rent comps 37 comps
| Address | Beds | Baths | Sqft | Rent | $/sqft | DOM | Units | Dist |
|---|---|---|---|---|---|---|---|---|
| 2523 Ben Hill Rd Atlanta, GA | 3.0 | 1.5 | 1412 | $3,000 | $2.12 | 22d | 1 | 0.40mi |
| 2658 Rolling Brook Trl Atlanta, GA | 3.0 | 2.0 | 1754 | $1,850 | $1.05 | 44d | 1 | 0.50mi |
| 2610 Harmony Way Atlanta, GA | 3.0 | 1.0 | 1100 | $1,095 | $1.00 | 25d | 1 | 0.57mi |
| 2656 Westchester Dr Atlanta, GA | 3.0 | 1.0 | 1025 | $1,600 | $1.56 | 20d | 1 | 0.63mi |
| 2764 Riggs Dr Atlanta, GA | 3.0 | 2.0 | 1147 | $2,050 | $1.79 | 44d | 1 | 0.66mi |
| 2675 Headland Dr Atlanta, GA | 3.0 | 2.0 | 1408 | $1,600 | $1.14 | 18d | 1 | 0.72mi |
| 2514 Riggs Dr Atlanta, GA | 4.0 | 2.0 | 1274 | $2,000 | $1.57 | 44d | 1 | 0.80mi |
| 2756 Plantation Dr Atlanta, GA | 3.0 | 2.0 | 1119 | $1,950 | $1.74 | 21d | 1 | 0.85mi |
| 3211 Flamingo Dr Atlanta, GA | 3.0 | 2.0 | 1485 | $1,900 | $1.28 | 44d | 1 | 0.87mi |
| 2560 Wood Valley Dr Atlanta, GA | 4.0 | 2.5 | 1141 | $1,900 | $1.67 | 18d | 1 | 0.93mi |
| 2560 Wood Valley Dr Atlanta, GA | 4.0 | 2.5 | 1141 | $1,900 | $1.67 | 25d | 1 | 0.93mi |
| 2250 Dodson Dr Atlanta, GA | 4.0 | 2.0 | 1522 | $4,200 | $2.76 | 44d | 1 | 0.93mi |
| 2999 Continental Colony Pkwy SW Atlanta, GA | 1.0–2.0 | 1.0–2.0 | 947 | $1,429 | $1.51 | 3d | 5 | 0.95mi |
| 3031 Remington St Atlanta, GA | 3.0 | 2.0 | 1369 | $1,200 | $0.88 | 19d | 1 | 0.95mi |
| 2641 Connally Dr East Point, GA | 2.0 | 1.0 | 1000 | $1,500 | $1.50 | 44d | 1 | 0.96mi |
| 3030 Remington St Atlanta, GA | 3.0 | 1.0 | 1100 | $1,200 | $1.09 | 25d | 1 | 0.98mi |
| 3168 Beech Dr Atlanta, GA | 3.0 | 2.0 | 1402 | $1,500 | $1.07 | 44d | 1 | 0.99mi |
| 2284 Headland Dr Atlanta, GA | 3.0 | 3.5 | 1117 | $1,502 | $1.34 | 13d | 1 | 1.05mi |
| 2467 Calvin Ave Atlanta, GA | 3.0 | 2.0 | 1200 | $1,950 | $1.62 | 25d | 1 | 1.14mi |
| 2801 Ridgeview Dr SW Atlanta, GA | 3.0 | 3.0 | 1588 | $2,500 | $1.57 | 19d | 1 | 1.17mi |
| 3198 Washington Rd Atlanta, GA | 2.0 | 1.5 | 1000 | $1,500 | $1.50 | 44d | 1 | 1.21mi |
| 3128 Chateau Blvd East Point, GA | 1.0–2.0 | 1.0 | 1000 | $1,395 | $1.40 | 16d | 12 | 1.23mi |
| 3122 Meadowstone Ln SW Atlanta, GA | 3.0 | 2.5 | 1336 | $2,540 | $1.90 | 25d | 1 | 1.24mi |
| 3122 Meadowstone Ln SW Atlanta, GA | 3.0 | 2.5 | 1336 | $2,440 | $1.83 | 18d | 1 | 1.24mi |
| 2420 Heaton Dr Atlanta, GA | 1.0–3.0 | 1.5–2.0 | 1103 | $1,750 | $1.59 | 44d | 1 | 1.25mi |
| 2886 Ridgeview Dr SW Atlanta, GA | 3.0 | 2.5 | 1792 | $2,175 | $1.21 | 3d | 1 | 1.34mi |
| 3181 Meadowstone Ln SW Atlanta, GA | 3.0 | 2.5 | 1536 | $2,300 | $1.50 | 19d | 1 | 1.34mi |
| 2909 Campbellton Rd SW Atlanta, GA | 1.0–3.0 | 1.0–2.0 | 917 | $1,299 | $1.42 | 25d | 1 | 1.37mi |
| 2933 Cloverhurst Dr Atlanta, GA | 4.0 | 3.0 | 1550 | $2,500 | $1.61 | 21d | 1 | 1.38mi |
| 3184 Pollard St Atlanta, GA | 3.0 | 2.0 | 1400 | $1,800 | $1.29 | 44d | 1 | 1.39mi |
| 3381 Greenbriar Pkwy SW Atlanta, GA | 1.0–2.0 | 1.0–2.0 | 836 | $1,416 | $1.69 | 25d | 1 | 1.40mi |
| 3488 Cardinal Dr SW Atlanta, GA | 3.0 | 2.5 | 1421 | $2,100 | $1.48 | 25d | 1 | 1.41mi |
| 2684 Toucan Way SW Atlanta, GA | 3.0 | 2.5 | 1652 | $2,350 | $1.42 | 25d | 1 | 1.42mi |
| 3560 Eagle Ct SW Atlanta, GA | 3.0 | 2.5 | 1480 | $1,995 | $1.35 | 8d | 1 | 1.43mi |
| 1994 Bent Creek Way SW Atlanta, GA | 1.0–3.0 | 1.0–2.0 | 1041 | $1,455 | $1.40 | 8d | 1 | 1.46mi |
| 2287 Mulberry St Unit B Atlanta, GA | 3.0 | 1.0 | 1700 | $2,500 | $1.47 | 25d | 1 | 1.49mi |
| 1932 Montrose Dr Atlanta, GA | 3.0 | 1.0 | 1200 | $1,750 | $1.46 | 19d | 1 | 1.49mi |
Listing history 11 events
-
2026-04-02status Under Contract 422-char remark
Show marketing remark (422 chars)
Charming 3-bedroom, 2-bathroom home located in a quiet neighborhood of East Point. This property features a spacious living area, a large backyard, and plenty of potential for customization. Perfect for investors or buyers looking for a project to make his home! Please note, this home is being sold as-is. Don't miss out on the opportunity to make this your own! Seller preferred closing attorney Lueder Larkin and Hunter
-
2026-04-02status Pending
Show marketing remark (422 chars)
Charming 3-bedroom, 2-bathroom home located in a quiet neighborhood of East Point. This property features a spacious living area, a large backyard, and plenty of potential for customization. Perfect for investors or buyers looking for a project to make his home! Please note, this home is being sold as-is. Don't miss out on the opportunity to make this your own! Seller preferred closing attorney Lueder Larkin and Hunter
-
2026-03-24price $225,000
-
2026-03-11$225,000 New 422-char remark
Show marketing remark (422 chars)
Charming 3-bedroom, 2-bathroom home located in a quiet neighborhood of East Point. This property features a spacious living area, a large backyard, and plenty of potential for customization. Perfect for investors or buyers looking for a project to make his home! Please note, this home is being sold as-is. Don't miss out on the opportunity to make this your own! Seller preferred closing attorney Lueder Larkin and Hunter
-
2026-03-10historical $225,000 422-char remark
Show marketing remark (422 chars)
Charming 3-bedroom, 2-bathroom home located in a quiet neighborhood of East Point. This property features a spacious living area, a large backyard, and plenty of potential for customization. Perfect for investors or buyers looking for a project to make his home! Please note, this home is being sold as-is. Don't miss out on the opportunity to make this your own! Seller preferred closing attorney Lueder Larkin and Hunter
-
2026-03-10historical
Show marketing remark (422 chars)
Charming 3-bedroom, 2-bathroom home located in a quiet neighborhood of East Point. This property features a spacious living area, a large backyard, and plenty of potential for customization. Perfect for investors or buyers looking for a project to make his home! Please note, this home is being sold as-is. Don't miss out on the opportunity to make this your own! Seller preferred closing attorney Lueder Larkin and Hunter
-
2025-12-31price $265,000
-
2025-11-10$285,000 Active
-
2025-10-23$285,000 New
-
1986-07-17soldstatus $64,400
-
1986-07-01soldstatus $64,400
ⓘ Source: listings_history table (triggers on properties + properties_extension) + one-shot
backfill from property_details.listing_events for pre-trigger history.
Climate risk First Street
- Flood 1/10 Low FEMA zone X (unshaded) · 0% chance over 30 yrs
- Wildfire 1/10 Low
- Heat 5/10 Major 7 d/yr ≥103°F today · 18 d/yr by 30 yrs out
- Wind 5/10 Major 25% chance of damaging wind over 30 yrs
- Air quality 3/10 Moderate 3 unhealthy d/yr today · 3 by 30 yrs out
Nearby sold comps map
Loading sold comps map…
Walkable amenities ~0.75 mi
Loading nearby amenities…
Taxation est. · year 1
- Rental income
- $23,175
- − Mortgage interest
- −$12,603
- − Property taxes
- −$3,375
- − Insurance
- −$1,125
- − Repairs & maintenance
- −$1,854
- − Management
- −$1,854
- − Depreciation
- −$6,545
- Taxable loss
- −$4,182
- Est. tax savings @ 24.0%
- +$1,004
- After-tax cash flow
- $653/yr
For passive investors: Depreciation is non-cash, so a rental often shows a tax loss while cash-flowing — sheltering income. Rental losses are passive: they offset passive income freely, and up to $25,000/yr can offset ordinary (W-2) income if you actively participate and your MAGI is under $100k (phasing out to $0 by $150k); unused losses carry forward. On sale, claimed depreciation is recaptured at up to 25%, and gains may owe capital-gains tax (a 1031 exchange can defer both). Figures are a year-1 estimate at your 24.0% rate — not tax advice; consult a CPA.
Schools (NCES district)
- District
- Fulton County
- NCES district ID
- 1302280
- Math proficiency
- 49% ▼ -2.00%
- Reading proficiency
- 53% ▬ 0.00%
- Median HH income
- $68,035
- Composite
- 45.33/100
- National rank
- #2640
- State rank
- #12 of 174 in GA
Livability — East Point
- Score
- 72/100
- State rank
- #72
- US rank
- #6314
Category grades
Schools grade is shown separately in the Schools card above.
Census & demographics
- Census place
- East Point, GA
- County
- Fulton County · 1,094,430 people
- City population
- 35,456
- Metro
- Atlanta-Sandy Springs-Alpharetta, GA
- Population (ZIP)
- 35,456
- Household income
- $68,380
- Rent vs Own
- Severe rent burden
- 2226.0
Population outlook (Fulton County) Hauer SSP2
- Today (2025)
- 1,203,707 people
- By 2030
- 1,299,706 · +8.0%
- By 2040
- 1,488,256 · +23.6%
- By 2050
- 1,664,580 · +38.3%
- By 2075
- 2,036,072 · +69.2%
- By 2100
- 2,222,402 · +84.6%
Race, ethnicity, and origin ACS 2023
- Neighborhood character
- Predominantly Black (74%)
- Race & ethnicity
- Black 74% White 11% Hispanic / Latino 11% Two or more races 6%
- Hispanic origin (detail)
- Mexican 7% Puerto Rican 1%
- Common ancestry
- Italian 1% Swiss 1% Russian 1%
- Foreign-born
- 6% · Canada, Jamaica
- Languages at home
- 87% English-only · Spanish 9% Other Indo-European 1% German/W. Germanic 1%
Political lean MEDSL · Fulton
- 2024 margin
- Solid D (+44.9) · D 71.9% · R 27.0% · Other 1.1%
- 2008→2024 swing
- +9.8pp toward D · 2008: 35.0pp · 2024: 44.9pp
- All cycles
- 2024: D+44.9 2020: D+46.4 2016: D+42.1 2012: D+29.6 2008: D+35.0
Not yet ingested
- Civics
- —
Market trends
- HPI YoY
- ▼ -113.15%
- Current HPI
- 251.7916
- Rent YoY
- ▲ 1.35%
- Metro
- Atlanta-Sandy Springs-Alpharetta, GA
- State GDP YoY
- ▲ 2.66%
- F500 in state
- 28
Industry mix (Fortune 500 HQ in GA)
| Industry | F500 HQs | Revenue |
|---|---|---|
| Paper / Packaging | 2 | $29B |
|
||
| Retail | 1 | $160B |
|
||
| Transportation / Logistics | 1 | $91B |
|
||
| Airlines | 1 | $62B |
|
||
| Consumer Goods | 1 | $47B |
|
||
| Utilities | 1 | $25B |
|
||
Price history
+249.4% since first listed11 events — show timeline
- 2026-04-02 Pending — GAMLS
- 2026-04-02 Pending — FMLS
- 2026-03-24 Price Changed $225,000 FMLS
- 2026-03-11 Listed $225,000 GAMLS
- 2026-03-10 Coming Soon $225,000 GAMLS
- 2026-03-10 Listing Removed — GAMLS
- 2025-12-31 Price Changed $265,000 GAMLS
- 2025-11-10 Listed $285,000 FMLS
- 2025-10-23 Listed $285,000 GAMLS
- 1986-07-17 Sold (Public Records) $64,400 Public Records
- 1986-07-01 Sold (Public Records) $64,400 Public Records
Property tax history
-15.2%/yrLatest (2021): $110 · +0.0% YoY. Source: county tax records.
Cash-flow waterfall
monthlySold comps — $/sqft
last 12 mo · ≤1 miLoading sold comps…