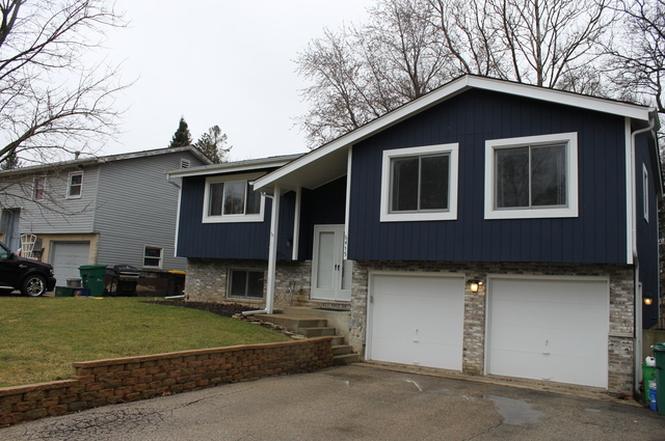
6415 Wood Dr · Cary, IL
Flood risk No data
- FEMA flood zone
- —
- Chance of flooding over 30 yrs
- —
- Est. flood insurance / yr
- —
Fire risk No data
- Est. fire insurance / yr
- —
Heat risk No data
- Hot days now (above threshold)
- —
- Hot days in 30 yrs
- —
Wind risk No data
- Chance of severe wind over 30 yrs
- —
Air-quality risk No data
- Unhealthy air days now
- —
- Unhealthy air days in 30 yrs
- —
Risk factors via First Street. Map © Google.
Why this score? — see what drove the D grade
The composite is a weighted blend of 9 inputs, each scored 0–100. Each bar is that input's sub-score; the figure is the points it added to the 100-point composite (weight × sub-score).
- Cash flow +12.7/30.0
- ARV discount +11.7/15.0
- Schools +3.9/10.0
- DSCR +3.8/10.0
- Livability +3.8/5.0
- 1% rule +3.6/10.0
- Rent growth +2.5/5.0
- Condition / age +2.5/5.0
- Appreciation +0.0/10.0
$325,000
🖨 Deal sheet 📄 Offer letter ✓ Due diligence
Listing remarks
Check back on the official launch date to see all the details on this fantastic new Redfin listing!
Key facts
- 7,405 sq ft lot
- Garage
- Built 1985
Property features AI
Exterior
- Parking: Garage (details not specified)
- Home design: Single-family residence; Built in 1985
- Construction: Built in 1985 (construction materials and roof type not specified)
- Exterior features: Lot approximately 7,405 sq. ft.
Interior
- Kitchen: Standard kitchen (appliances not specified)
- Bedrooms: 3 bedrooms
- Bathrooms: 1 full bathroom and 2 half bathrooms
- Interior features: Open living spaces (typical of a single-family layout)
- Laundry & utility: Laundry/utility area (details not specified)
Neighborhood map
What this means for you Summary
Snapshot
- This is a 3-bed/1.5-bath single-family listed at $325k.
Deal economics
- At list price, monthly cash flow is $-34 ($-408/yr) — negative.
- To cash-flow at today's rent, offer at most $320k (1.5% below list).
- To meet the 1% rule (rent ≥ 1% of price), the offer needs to be $280k (13.8% below list).
- Recommended offer: $280k (13.8% below list) — sets the bar for 1% rule.
- Cap rate 6.2% vs local median 4.2% in Cary — top-decile yield for the area; either an underpriced asset or a hidden risk that comps aren't pricing in. Stress-test before assuming the spread holds.
Location & tenants
- Location reads 75/100 on livability (#227 in IL, #4,227 nationally) — a middle-class / working-renter tenant base. Strengths: crime A+, employment A+, housing A+; Watch: amenities F, commute F, health & safety F.
- Chsd 155 (suburban): math 41% / reading 42% proficiency, ranked #98 of 620 in IL (top 16%) — families likely to look elsewhere, expect single-tenant / working-renter base with shorter leases.
- Market conditions: 60 active listings in the ZIP; 1 comparable units currently listed for rent nearby; 1,595 units permitted in McHenry County in 2024 (485 in 5+ unit buildings).
Forward outlook
- Local home prices are declining (-3.0%/yr); year-one equity from $2k of loan paydown is wiped out by about $10k of value loss. Plan a longer hold.
- McHenry County population projected at -12% by 2050 — secular population decline; favor cash flow + early exit over multi-decade hold.
Negotiation context
- Only 3 days on market — expect competitive offers; lowballing is unlikely to land.
Questions for the listing agent
- What do current leases actually rent for vs. the listed asking? Can we see a recent rent roll and the last 12 months of T-12 income?
- Is there a deadline driving the sale (1031 exchange, divorce, estate, relocation)? That informs how much negotiation room exists.
- Schools are B-rated — typically a magnet for longer-tenancy family renters. What's the average tenant stay here, and is there a school-zone premium baked into asking?
- The area grade is low — what's the realistic commute time and amenity access for the typical tenant pool here? Any planned neighborhood developments (good or bad) we should know about?
- What's the average days-on-market for RENTAL listings here right now (not sales)? A rising rental-DOM trend means longer vacancies and softer asking-rent achievability than the comps imply.
- What's the recent tenant-quality profile in this submarket — average credit score on applications, eviction rate, late-payment / NSF rate, and stable-employment percentage? A property-management company in the area should have these aggregated.
- How much new for-sale + rental construction is in the pipeline within 1–3 miles? Heavy new supply typically softens prices + rents 12–24 months out; constrained supply supports both.
Investment metrics
- 1% rule
- 0.86% ✗
- Cap rate
- 6.17%
- Cash-on-cash
- -0.45%
- DSCR
- 0.98
- GRM
- 9.7
CMA / ARV
- ARV (on-the-fly)
- $358,498
- Comps found
- 12
Show comp detail 12 sales within ~0.75 mi
| Address | Dist | Beds/Ba | Sqft | Sold | Price | $/sf | Match |
|---|---|---|---|---|---|---|---|
| 6412 W Rawson Bridge Rd | 0.04mi | 3/2.0 | 1,747 (-1%) | 11mo | $325,000 | $186 | 85 |
| 6407 Hillcrest Rd | 0.12mi | 3/2.0 | 1,792 (+2%) | 10mo | $324,900 | $181 | 82 |
| 6416 W Rawson Bridge Rd W | 0.03mi | 3/2.0 | 1,854 (+5%) | 10mo | $315,000 | $170 | 80 |
| 6715 Pheasant Trl | 0.31mi | 3/3.5 | 1,792 (+2%) | 13mo | $339,000 | $189 | 64 |
| 6032 S Lake Shore Dr | 0.48mi | 3/2.5 | 1,680 (-5%) | 3mo | $420,000 | $250 | 63 |
| 6 Ennis Ct | 0.72mi | 3/2.0 | 1,756 (-1%) | 10mo | $432,500 | $246 | 55 |
| 5 Echo Hill Rd | 0.45mi | 3/2.0 | 1,534 (-13%) | 1mo | $385,000 | $251 | 54 |
| 7 Lakewood Dr | 0.46mi | 3/2.0 | 1,602 (-9%) | 13mo | $325,000 | $203 | 50 |
| 3004 Blarneystone Ln | 0.62mi | 3/2.0 | 1,938 (+10%) | 9mo | $395,000 | $204 | 45 |
| 7102 Silver Lake Rd | 0.65mi | 3/1.5 | 1,991 (+13%) | 9mo | $405,000 | $203 | 41 |
| 24 Hickory Rd | 0.55mi | 4/3.5 (+1) | 1,942 (+10%) | 10mo | $425,000 | $219 | 36 |
| 2 Acorn Ln | 0.40mi | 3/3.5 | 2,029 (+15%) | 19mo | $315,000 | $155 | 33 |
Match score weights: distance 35% · size 25% · config 20% · recency 20%. Top-matched comps best support the ARV.
Projected returns pro-forma
-3.0% appreciation · 3.0% rent growth · sell at horizon
- IRR
- -17.0%
- Equity multiple
- 0.40×
- Total profit
- $-54,787
- Equity at exit
- $48,459
- IRR
- -8.9%
- Equity multiple
- 0.45×
- Total profit
- $-50,325
- Equity at exit
- $28,100
Cash invested: $91,000 (down + closing). Projections, not guarantees.
Landlord ↔ Tenant lean methodology
- Overall (STATE)
- 43 Moderately Tenant-Leaning
- State Illinois
- 43 Moderately Tenant-Leaning · D+7
- County
- — inherits STATE
- City
- — inherits STATE
ZIP-level market 60013
- Active inventory
- 60
- Price-to-rent
- 9.7×
Monthly cashflow live
- Estimated rent
- $2,800 medium interval (Pro) →
- Mortgage (P&I)
- −$1,704
- Tax est. 1.5%
- −$406 /mo · $4,875/yr
- Insurance
- −$135
- HOA
- −$0
- Vacancy / Maint / Mgmt
- −$588
- Net cashflow
- $-34
Break-even live
UW: 25.0% down · 7.5% · 30yr · 1.5% tax · 5.0% vac · 8.0% maint · 8.0% mgmt
Financing live
Cash to close
- Down payment
- $81,250
- Closing costs
- $9,750
- Reserves months
- —
- Total cash needed
- —
Loan-product check · same deal, 3 products live
Conventional
25% down · 7.5% · 30yr
- Down + closing
- —
- Monthly P&I
- —
- Monthly cashflow
- —
- DSCR
- —
- Eligible?
- —
Personal DTI + credit; lowest rate.
DSCR
20% down · 8.5% · 30yr
- Down + closing
- —
- Monthly P&I
- —
- Monthly cashflow
- —
- DSCR
- —
- Eligible?
- —
No personal income docs; deal must DSCR.
Hard money
10% down · 12.0% · 12mo
- Down + closing
- —
- Monthly P&I
- —
- Monthly cashflow
- —
- DSCR
- —
- Eligible?
- —
Short-term bridge; refi at stabilization.
Rent comps 1 comps
| Address | Beds | Baths | Sqft | Rent | $/sqft | DOM | Units | Dist |
|---|---|---|---|---|---|---|---|---|
| 2910 Killarney Dr Cary, IL | 3.0 | 2.5 | 2500 | $2,800 | $1.12 | 24d | 1 | 0.60mi |
Listing history 4 events
-
2026-06-18days on market $325,000 Coming Soon 3 DOM
-
2026-06-17days on market $325,000 Coming Soon 2 DOM
-
2026-06-15remarks 99-char remark
-
2026-06-15$325,000 Coming Soon 1 DOM
ⓘ Source: listings_history table (triggers on properties + properties_extension) + one-shot
backfill from property_details.listing_events for pre-trigger history.
Nearby sold comps map
Loading sold comps map…
Walkable amenities ~0.75 mi
Loading nearby amenities…
Taxation est. · year 1
- Rental income
- $33,600
- − Mortgage interest
- −$18,205
- − Property taxes
- −$4,875
- − Insurance
- −$1,625
- − Repairs & maintenance
- −$2,688
- − Management
- −$2,688
- − Depreciation
- −$9,455
- Taxable loss
- −$5,936
- Est. tax savings @ 24.0%
- +$1,425
- After-tax cash flow
- $1,017/yr
For passive investors: Depreciation is non-cash, so a rental often shows a tax loss while cash-flowing — sheltering income. Rental losses are passive: they offset passive income freely, and up to $25,000/yr can offset ordinary (W-2) income if you actively participate and your MAGI is under $100k (phasing out to $0 by $150k); unused losses carry forward. On sale, claimed depreciation is recaptured at up to 25%, and gains may owe capital-gains tax (a 1031 exchange can defer both). Figures are a year-1 estimate at your 24.0% rate — not tax advice; consult a CPA.
Schools (NCES district)
- District
- Chsd 155
- NCES district ID
- 1711370
- Math proficiency
- 41% ▼ -9.00%
- Reading proficiency
- 42% ▼ -7.00%
- Median HH income
- $87,560
- Composite
- 39.33/100
- National rank
- #3982
- State rank
- #98 of 620 in IL
Livability — Cary
- Score
- 75/100
- State rank
- #227
- US rank
- #4227
Category grades
Schools grade is shown separately in the Schools card above.
Census & demographics
- City population
- 26,503
- Population (ZIP)
- 26,503
Population outlook (McHenry County) Hauer SSP2
- Today (2025)
- 305,342 people
- By 2030
- 301,491 · -1.3%
- By 2040
- 288,211 · -5.6%
- By 2050
- 268,430 · -12.1%
- By 2075
- 226,209 · -25.9%
- By 2100
- 181,247 · -40.6%
Race, ethnicity, and origin ACS 2023
- Neighborhood character
- Predominantly White (80%)
- Race & ethnicity
- White 80% Hispanic / Latino 14% Two or more races 9%
- Hispanic origin (detail)
- Mexican 10% Puerto Rican 2%
- Common ancestry
- Romanian 11% Italian 2% Portuguese 2%
- Foreign-born
- 7% · Canada
- Languages at home
- 88% English-only · Spanish 8% Russian/Polish/Slavic 2%
Political lean MEDSL · McHenry
- 2024 margin
- Lean R (+5.3) · D 46.6% · R 51.9% · Other 1.5%
- 2008→2024 swing
- -10.6pp toward R · 2008: 5.3pp · 2024: -5.3pp
- All cycles
- 2024: R+5.3 2020: R+2.5 2016: R+8.1 2012: R+8.8 2008: D+5.3
Not yet ingested
- Civics
- —
Market trends
- HPI YoY
- ▼ -157.47%
- Current HPI
- 201.8071
- Rent YoY
- —
- Metro
- —
- State GDP YoY
- ▲ 1.59%
- F500 in state
- 60
Industry mix (Fortune 500 HQ in IL)
| Industry | F500 HQs | Revenue |
|---|---|---|
| Insurance | 4 | $201B |
|
||
| Consumer Goods | 4 | $87B |
|
||
| Industrial Machinery | 3 | $64B |
|
||
| Healthcare | 2 | $55B |
|
||
| Retail / Pharmacy | 1 | $148B |
|
||
| Agriculture / Food | 1 | $86B |
|
||
Cash-flow waterfall
monthlySold comps — $/sqft
last 12 mo · ≤1 miLoading sold comps…