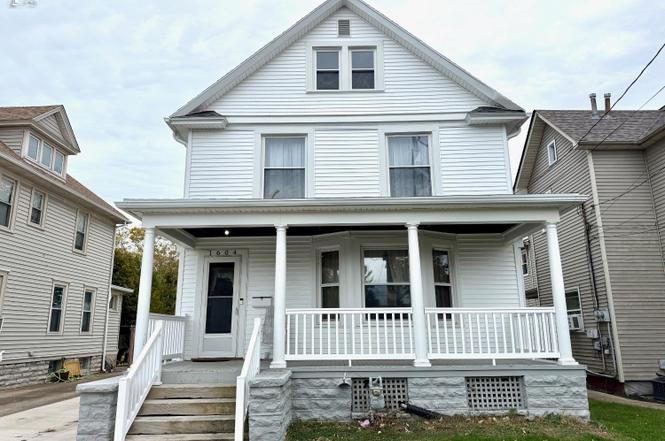
1604 Central Ave · Sandusky, OH
Flood risk 1/10 · Minimal
- FEMA flood zone
- X (unshaded)
- Chance of flooding over 30 yrs
- 0.0%
- Est. flood insurance / yr
- $473 – $860
Fire risk 1/10 · Minimal
- Est. fire insurance / yr
- $713 – $1,323
Heat risk 3/10 · Minor
- Hot days now (above 95°F)
- 7 days/yr
- Hot days in 30 yrs
- 16 days/yr
Wind risk 2/10 · Minimal
- Chance of severe wind over 30 yrs
- —
Air-quality risk 2/10 · Minimal
- Unhealthy air days now
- 1 days/yr
- Unhealthy air days in 30 yrs
- 2 days/yr
Risk factors via First Street. Map © Google.
Why this score? — see what drove the B grade
The composite is a weighted blend of 9 inputs, each scored 0–100. Each bar is that input's sub-score; the figure is the points it added to the 100-point composite (weight × sub-score).
- Cash flow +30.0/30.0
- ARV discount +10.4/15.0
- 1% rule +10.0/10.0
- DSCR +10.0/10.0
- Livability +4.2/5.0
- Rent growth +2.5/5.0
- Schools +2.5/10.0
- Condition / age +2.5/5.0
- Appreciation +0.0/10.0
$159,000
🖨 Deal sheet (PDF) 📄 Offer letter ✓ Due diligence
Listing remarks
Large 4 bedroom 1.5 bath home located in the heart of Sandusky on Central Ave!This home offers an abundance of space and creativity to make it your own. The beautiful front porch has new pillars, brand new white siding, new paved driveway, one car detached garage, a nice yard that is great in depth, and back deck. Laundry on the main floor for added convenience, a lovely wooden built-in - giving you that true Sandusky charm. New Furnace, Sump Pump and Hot Water Tank 2025. You also have a loft styled attic - perfect for dry storage, or use it as an extra bedroom, or as an entertaining room or study. Enjoy living just a stone throw away from downtown Sandusky and all of what Lake Erie has to
Key facts
- New pillars
- New paved driveway
- Front porch
Tags
Property features AI
Finance
- Other: Located in the Finch And Emrichs Addition subdivision
Exterior
- Parking: Detached paved off-street parking; 1-car garage
- Utilities: Public water; Public sewer
- Home design: Single-family residential property
- Construction: Vinyl-sided construction; Asphalt roof
- Exterior features: Asphalt roof; Vinyl siding; Lot on approximately 0.16 acres
Interior
- Bathrooms: 1 full bathroom; 1 half bathroom
- Heating & cooling: Natural gas forced-air heating; Ceiling fan(s) for cooling
- Interior features: Partially finished basement; 7 total rooms
Neighborhood map
What this means for you Summary
Snapshot
- This is a 4-bed/1.5-bath single-family listed at $159k.
Deal economics
- At list price, monthly cash flow is $1k ($14k/yr) — positive.
- The deal already cash-flows at list — no discount required.
- Meets the 1% rule at list price ($3k rent vs $159k).
- Recommended offer: $140k (12.0% below list) — sets the bar for market timing.
- Cap rate 14.8% vs local median 6.1% in Sandusky — top-decile yield for the area; either an underpriced asset or a hidden risk that comps aren't pricing in. Stress-test before assuming the spread holds.
Location & tenants
- Location reads 83/100 on livability (#63 in OH, #929 nationally) — a professional / high-income tenant draw. Strengths: commute A+, cost of living A+, housing A+; Watch: crime D-, employment F.
- Sandusky City (town): math 24% / reading 37% proficiency, ranked #583 of 656 in OH (top 89%) — families likely to look elsewhere, expect single-tenant / working-renter base with shorter leases; 71% free/reduced lunch — lower-income household profile, screen leases tightly.
- Zoned schools: The Sandusky Intermediate School (math 26% / reading 38%, grade F, #1,135 of 1,584 statewide, top 73%, 909 students, 0% FRL); Sandusky Middle School (math 25% / reading 32%, grade F, #580 of 654 statewide, top 89%, 468 students, 0% FRL); Sandusky High School (math 17% / reading 41%, grade F, #627 of 781 statewide, top 81%, 1,004 students, 0% FRL) — zoned schools average 0% FRL vs 71% district-wide (71 pts lower); this property's tenant base skews higher-income than the district average.
- Market conditions: 210 active listings in the ZIP; 2 comparable units currently listed for rent nearby; 128 units permitted in Erie County in 2024 (5 in 5+ unit buildings).
- At $2,717/mo this rent would consume 53% of the median local household income ($62k/yr) (locally 1602% of renters already pay >50% of income on rent) — very limited rent-growth headroom before tenants either downsize or default.
Forward outlook
- Local home prices are declining (-3.0%/yr); year-one equity from $1k of loan paydown is wiped out by about $5k of value loss. Plan a longer hold.
- Erie County population projected at -15% by 2050 — secular population decline; favor cash flow + early exit over multi-decade hold.
- At projected returns (-3.0% appreciation + 3.0% rent growth), your $45k cash investment doubles in ~4 years — after that, you're playing with house money.
Negotiation context
- It's been on market 217 days — a 12% lower offer ($140k) is reasonable based on typical stale-listing flexibility.
- Current owner paid $76k; list at $159k implies a 111% gain — meaningful room to come down on a strong offer.
Risks & watch-outs
- Watch-outs: built in 1910 — expect roof / HVAC / electrical / plumbing capex.
Questions for the listing agent
- It's been on market 217 days. Have you received any prior offers? Is the seller open to a 12% concession, seller financing, or rate buy-down credit?
- Built in 1910 — when were the roof, HVAC, electrical panel, plumbing, and water heater last replaced?
- Why hasn't it sold? Are there any deal-killer items the seller is aware of (foundation, flood, title, zoning, code violations)?
- Is there a deadline driving the sale (1031 exchange, divorce, estate, relocation)? That informs how much negotiation room exists.
- Crime grade is D in this area — have there been break-ins, vandalism, or insurance claims at this property in the last 3 years? What carrier currently insures it and at what premium?
- What's the average days-on-market for RENTAL listings here right now (not sales)? A rising rental-DOM trend means longer vacancies and softer asking-rent achievability than the comps imply.
- What's the recent tenant-quality profile in this submarket — average credit score on applications, eviction rate, late-payment / NSF rate, and stable-employment percentage? A property-management company in the area should have these aggregated.
- How much new for-sale + rental construction is in the pipeline within 1–3 miles? Heavy new supply typically softens prices + rents 12–24 months out; constrained supply supports both.
Investment metrics
- 1% rule
- 1.71% ✓
- Cap rate
- 14.85%
- Cash-on-cash
- 30.54%
- DSCR
- 2.36
- GRM
- 4.9
CMA / ARV
- ARV (on-the-fly)
- $169,824
- Comps found
- 12
Show comp detail 12 sales within ~0.75 mi
| Address | Dist | Beds/Ba | Sqft | Sold | Price | $/sf | Match |
|---|---|---|---|---|---|---|---|
| 1342 Camp St | 0.37mi | 4/2.0 | 1,555 (+6%) | 4mo | $211,500 | $136 | 67 |
| 1334 Lindsley St | 0.34mi | 3/1.0 (-1) | 1,366 (-7%) | 1mo | $143,000 | $105 | 65 |
| 318 High St | 0.49mi | 4/2.0 | 1,532 (+5%) | 3mo | $185,000 | $121 | 65 |
| 1308 W Madison St | 0.53mi | 4/1.0 | 1,572 (+7%) | 2mo | $137,400 | $87 | 60 |
| 921 Polk St | 0.19mi | 5/1.5 (+1) | 1,680 (+15%) | 4mo | $195,000 | $116 | 58 |
| 1330 Clinton St | 0.52mi | 4/2.0 | 1,334 (-9%) | 3mo | $177,250 | $133 | 57 |
| 513 Rockwell St | 0.36mi | 3/1.0 (-1) | 1,312 (-10%) | 3mo | $170,000 | $130 | 56 |
| 325 Mcdonough St | 0.74mi | 3/1.5 (-1) | 1,506 (+3%) | 1mo | $175,500 | $117 | 55 |
| 332 W Parish St | 0.69mi | 4/1.0 | 1,371 (-6%) | 3mo | $103,000 | $75 | 52 |
| 919 Hancock St | 0.74mi | 3/1.0 (-1) | 1,426 (-3%) | 3mo | $72,000 | $50 | 52 |
| 914 Hayes Ave | 0.56mi | 3/1.0 (-1) | 1,320 (-10%) | 1mo | $133,000 | $101 | 50 |
| 1805 Mills St | 0.74mi | 3/1.0 (-1) | 1,352 (-8%) | 2mo | $65,000 | $48 | 44 |
Match score weights: distance 35% · size 25% · config 20% · recency 20%. Top-matched comps best support the ARV.
Projected returns pro-forma
-3.0% appreciation · 3.0% rent growth · sell at horizon
- IRR
- 25.2%
- Equity multiple
- 2.04×
- Total profit
- $46,397
- Equity at exit
- $23,707
- IRR
- 33.0%
- Equity multiple
- 3.99×
- Total profit
- $133,290
- Equity at exit
- $13,747
Cash invested: $44,520 (down + closing). Projections, not guarantees.
Landlord ↔ Tenant lean methodology
- Overall (STATE)
- 73 Landlord-Friendly
- State Ohio
- 73 Landlord-Friendly · R+6
- County
- — inherits STATE
- City
- — inherits STATE
ZIP-level market 44870
- Active inventory
- 210
- Price-to-rent
- 4.9×
Monthly cashflow live
- Estimated rent
- $2,717 medium interval (Pro) →
- Mortgage (P&I)
- −$834
- Tax from tax record
- −$113 /mo · $1,359/yr
- Insurance
- −$66
- HOA
- −$0
- Vacancy / Maint / Mgmt
- −$571
- Net cashflow
- $1,133
Break-even live
Sensitivity live
| Price | -10% $1,223 | -5% $1,178 | +0% $1,133 | +5% $1,088 | +10% $1,043 |
|---|---|---|---|---|---|
| Rent | -10% $919 | -5% $1,026 | +0% $1,133 | +5% $1,241 | +10% $1,348 |
| Rate | -1.0pp $1,213 | -0.5pp $1,174 | base $1,133 | +0.5pp $1,092 | +1.0pp $1,050 |
UW: 25.0% down · 7.5% · 30yr · 1.5% tax · 5.0% vac · 8.0% maint · 8.0% mgmt
Financing live
Cash to close
- Down payment
- $39,750
- Closing costs
- $4,770
- Reserves months
- —
- Total cash needed
- —
Loan-product check · same deal, 3 products live
Conventional
25% down · 7.5% · 30yr
- Down + closing
- —
- Monthly P&I
- —
- Monthly cashflow
- —
- DSCR
- —
- Eligible?
- —
Personal DTI + credit; lowest rate.
DSCR
20% down · 8.5% · 30yr
- Down + closing
- —
- Monthly P&I
- —
- Monthly cashflow
- —
- DSCR
- —
- Eligible?
- —
No personal income docs; deal must DSCR.
Hard money
10% down · 12.0% · 12mo
- Down + closing
- —
- Monthly P&I
- —
- Monthly cashflow
- —
- DSCR
- —
- Eligible?
- —
Short-term bridge; refi at stabilization.
Rent comps 2 comps
| Address | Beds | Baths | Sqft | Rent | $/sqft | DOM | Units | Dist |
|---|---|---|---|---|---|---|---|---|
| 1032 Perry St Sandusky, OH | 4.0 | 2.5 | 1845 | $850 | $0.46 | 45d | 1 | 1.01mi |
| 1107 1st St Unit 1496057P Sandusky, OH | 4.0 | 3.0 | 1151 | $6,631 | $5.76 | 45d | 1 | 1.34mi |
Listing history 14 events
-
2026-06-12status $159,000 Pending 217 DOM
-
2026-06-09days on market $159,000 Active Under Contract 217 DOM
-
2026-06-08days on market $159,000 Active Under Contract 216 DOM
-
2026-06-07days on market $159,000 Active Under Contract 215 DOM
-
2026-06-03days on market $159,000 Active Under Contract 211 DOM
-
2026-06-02days on market $159,000 Active Under Contract 210 DOM
-
2026-06-01days on market $159,000 Active Under Contract 209 DOM
-
2026-05-31days on market $159,000 Active Under Contract 208 DOM
-
2026-05-30days on market $159,000 Active Under Contract 207 DOM
-
2026-04-14historical Active Under Contract
-
2025-11-28price $159,000
-
2025-11-05$165,000 Active
-
2001-06-04soldstatus $75,500
-
1992-06-26soldstatus $50,000
ⓘ Source: listings_history table (triggers on properties + properties_extension) + one-shot
backfill from property_details.listing_events for pre-trigger history.
Tax reassessment forecast OH · Partial reset (capped growth)
- Current annual tax
- $1,359 · $113/mo
- Projected year-2 tax
- $1,920 · $160/mo
- Expected delta
- +$561/yr (+$47/mo · 41.2%)
ⓘ Screening estimate from a state-policy table — verify with the county assessor before closing.
Climate risk First Street
- Flood 1/10 Low FEMA zone X (unshaded) · 0% chance over 30 yrs
- Wildfire 1/10 Low
- Heat 3/10 Moderate 7 d/yr ≥95°F today · 16 d/yr by 30 yrs out
- Wind 2/10 Low
- Air quality 2/10 Low 1 unhealthy d/yr today · 2 by 30 yrs out
Nearby sold comps map
Loading sold comps map…
Walkable amenities ~0.75 mi
Loading nearby amenities…
Taxation est. · year 1
- Rental income
- $32,606
- − Mortgage interest
- −$8,906
- − Property taxes
- −$1,359
- − Insurance
- −$795
- − Repairs & maintenance
- −$2,608
- − Management
- −$2,608
- − Depreciation
- −$4,625
- Taxable income
- $11,702
- Est. tax owed @ 24.0%
- −$2,809
- After-tax cash flow
- $10,790/yr
For passive investors: Depreciation is non-cash, so a rental often shows a tax loss while cash-flowing — sheltering income. Rental losses are passive: they offset passive income freely, and up to $25,000/yr can offset ordinary (W-2) income if you actively participate and your MAGI is under $100k (phasing out to $0 by $150k); unused losses carry forward. On sale, claimed depreciation is recaptured at up to 25%, and gains may owe capital-gains tax (a 1031 exchange can defer both). Figures are a year-1 estimate at your 24.0% rate — not tax advice; consult a CPA.
Schools (NCES district)
- District
- Sandusky City
- NCES district ID
- 3904474
- Math proficiency
- 24% ▼ -17.00%
- Reading proficiency
- 37% ▼ -9.00%
- Median HH income
- $34,583
- Composite
- 25.1/100
- National rank
- #7532
- State rank
- #583 of 656 in OH
Livability — Sandusky
- Score
- 83/100
- State rank
- #63
- US rank
- #929
Category grades
Schools grade is shown separately in the Schools card above.
Census & demographics
- Census place
- Sandusky, OH
- County
- Erie County · 39,883 people
- City population
- 39,883
- Metro
- Sandusky, OH
- Population (ZIP)
- 39,883
- Household income
- $62,082
- Rent vs Own
- Severe rent burden
- 1602.0
Population outlook (Erie County) Hauer SSP2
- Today (2025)
- 73,204 people
- By 2030
- 71,341 · -2.5%
- By 2040
- 66,771 · -8.8%
- By 2050
- 62,512 · -14.6%
- By 2075
- 56,154 · -23.3%
- By 2100
- 49,045 · -33.0%
Race, ethnicity, and origin ACS 2023
- Neighborhood character
- Predominantly White (72%)
- Race & ethnicity
- White 72% Black 15% Two or more races 8% Hispanic / Latino 5%
- Common ancestry
- Romanian 3% Slovak 2% Subsaharan African 1%
- Foreign-born
- 1% · Canada
- Languages at home
- 96% English-only · Spanish 2%
Political lean MEDSL · Erie
- 2024 margin
- R (+14.1) · D 42.5% · R 56.6%
- 2008→2024 swing
- -28.0pp toward R · 2008: 13.9pp · 2024: -14.1pp
- All cycles
- 2024: R+14.1 2020: R+11.6 2016: R+9.8 2012: D+11.3 2008: D+13.9
Not yet ingested
- Civics
- —
Market trends
- HPI YoY
- ▼ -151.99%
- Current HPI
- 209.6383
- Rent YoY
- —
- Metro
- Sandusky, OH
- State GDP YoY
- ▲ 1.98%
- F500 in state
- 48
Industry mix (Fortune 500 HQ in OH)
| Industry | F500 HQs | Revenue |
|---|---|---|
| Insurance | 3 | $145B |
|
||
| Industrial Machinery | 3 | $49B |
|
||
| Financial Services | 3 | $24B |
|
||
| Consumer Goods | 2 | $93B |
|
||
| Aerospace / Defense | 2 | $47B |
|
||
| Utilities | 2 | $33B |
|
||
Price history
+218.0% since first listed5 events — show timeline
- 2026-04-14 Contingent — FAOR
- 2025-11-28 Price Changed $159,000 FAOR
- 2025-11-05 Listed $165,000 FAOR
- 2001-06-04 Sold (Public Records) $75,500 Public Records
- 1992-06-26 Sold (Public Records) $50,000 Public Records
Property tax history
+1.5%/yrLatest (2025): $1,359 · -3.1% YoY. Source: county tax records.
Cash-flow waterfall
monthlySold comps — $/sqft
last 12 mo · ≤1 miLoading sold comps…