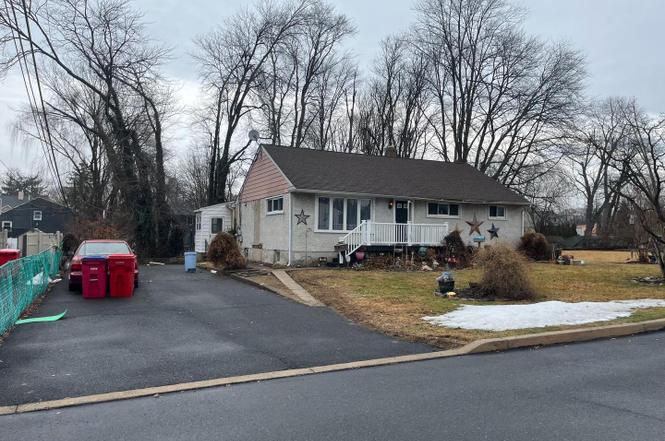
473 3rd Ave · Hatboro, PA
Flood risk 1/10 · Minimal
- FEMA flood zone
- X (unshaded)
- Chance of flooding over 30 yrs
- 0.0%
- Est. flood insurance / yr
- $473 – $860
Fire risk 1/10 · Minimal
- Est. fire insurance / yr
- $511 – $949
Heat risk 6/10 · Moderate
- Hot days now (above 100°F)
- 7 days/yr
- Hot days in 30 yrs
- 15 days/yr
Wind risk 6/10 · Moderate
- Chance of severe wind over 30 yrs
- 27.0%
Air-quality risk 4/10 · Minor
- Unhealthy air days now
- 5 days/yr
- Unhealthy air days in 30 yrs
- 6 days/yr
Risk factors via First Street. Map © Google.
Why this score? — see what drove the D+ grade
The composite is a weighted blend of 9 inputs, each scored 0–100. Each bar is that input's sub-score; the figure is the points it added to the 100-point composite (weight × sub-score).
- ARV discount +15.0/15.0
- Cash flow +12.8/30.0
- Livability +4.5/5.0
- DSCR +3.8/10.0
- Schools +3.8/10.0
- 1% rule +3.6/10.0
- Rent growth +2.5/5.0
- Condition / age +2.5/5.0
- Appreciation +0.0/10.0
$329,900
🖨 Deal sheet 📄 Offer letter ✓ Due diligence
Listing remarks
Property needs remodeling. Seller makes no representation or warranties to the condition of the property. Buyer is responsible for municipal requirements.
Key facts
- 0.33 acre lot
- Built 1957
- Listed 50 days
Neighborhood map
What this means for you Summary
Snapshot
- This is a 3-bed/1.0-bath single-family listed at $330k.
Deal economics
- At list price, monthly cash flow is $-32 ($-389/yr) — negative.
- To cash-flow at today's rent, offer at most $324k (1.7% below list).
- To meet the 1% rule (rent ≥ 1% of price), the offer needs to be $285k (13.7% below list).
- Recommended offer: $285k (13.7% below list) — sets the bar for 1% rule.
- Cap rate 6.2% vs local median 3.1% in Hatboro — top-decile yield for the area; either an underpriced asset or a hidden risk that comps aren't pricing in. Stress-test before assuming the spread holds.
Location & tenants
- Location reads 89/100 on livability (#27 in PA, #158 nationally) — a professional / high-income tenant draw. Strengths: crime A+, commute A+, employment A+.
- Centennial SD (suburban): math 30% / reading 54% proficiency, ranked #285 of 539 in PA (top 53%) — families likely to look elsewhere, expect single-tenant / working-renter base with shorter leases.
- Market conditions: 157 active listings in the ZIP; 3 comparable units currently listed for rent nearby; rentals leasing fast (median 10d on market — plan ~1-2 weeks tenant-placement turnaround); solid renter incomes; 663 units permitted in Bucks County in 2024 (106 in 5+ unit buildings).
- This rent runs 33% of the median local income ($104k/yr) — at the standard rent-burdened threshold; future hikes will face affordability resistance.
Forward outlook
- Local home prices are declining (-3.0%/yr); year-one equity from $2k of loan paydown is wiped out by about $10k of value loss. Plan a longer hold.
- Bucks County population projected to shrink 7% by 2050 — rents likely to lag national; underwrite the cash flow, not the appreciation.
Negotiation context
- It's been on market 50 days — a 3% lower offer ($320k) is reasonable based on typical stale-listing flexibility.
- Current owner paid $244k; 35% above their basis — modest negotiation headroom, anchor on the comps not their cost.
Risks & watch-outs
- Watch-outs: built in 1957 — expect roof / HVAC / electrical / plumbing capex.
- Climate carrying-cost: major wind risk, 27% chance of damaging wind over 30y; extreme-heat days projected 7→15/yr by 2055 (HVAC capex compounding) — expect insurance premiums to compound above CPI over the hold.
Questions for the listing agent
- What do current leases actually rent for vs. the listed asking? Can we see a recent rent roll and the last 12 months of T-12 income?
- It's been on market 50 days. Have you received any prior offers? Is the seller open to a 14% concession, seller financing, or rate buy-down credit?
- Built in 1957 — when were the roof, HVAC, electrical panel, plumbing, and water heater last replaced?
- Is there a deadline driving the sale (1031 exchange, divorce, estate, relocation)? That informs how much negotiation room exists.
- Schools are B-rated — typically a magnet for longer-tenancy family renters. What's the average tenant stay here, and is there a school-zone premium baked into asking?
- The area grade is low — what's the realistic commute time and amenity access for the typical tenant pool here? Any planned neighborhood developments (good or bad) we should know about?
- What's the average days-on-market for RENTAL listings here right now (not sales)? A rising rental-DOM trend means longer vacancies and softer asking-rent achievability than the comps imply.
- What's the recent tenant-quality profile in this submarket — average credit score on applications, eviction rate, late-payment / NSF rate, and stable-employment percentage? A property-management company in the area should have these aggregated.
- How much new for-sale + rental construction is in the pipeline within 1–3 miles? Heavy new supply typically softens prices + rents 12–24 months out; constrained supply supports both.
Investment metrics
- 1% rule
- 0.86% ✗
- Cap rate
- 6.18%
- Cash-on-cash
- -0.42%
- DSCR
- 0.98
- GRM
- 9.7
CMA / ARV
- ARV (on-the-fly)
- $492,156
- Comps found
- 12
Show comp detail 12 sales within ~0.75 mi
| Address | Dist | Beds/Ba | Sqft | Sold | Price | $/sf | Match |
|---|---|---|---|---|---|---|---|
| 472 4th Ave | 0.03mi | 3/1.5 | 1,640 (-7%) | 6mo | $431,000 | $263 | 79 |
| 18 Linda Ln | 0.39mi | 3/1.0 | 1,758 (-0%) | 11mo | $490,000 | $279 | 72 |
| 599 Panther Rd | 0.24mi | 3/1.5 | 1,568 (-11%) | 5mo | $450,000 | $287 | 64 |
| 330 Date St | 0.29mi | 4/1.5 (+1) | 1,656 (-6%) | 10mo | $432,000 | $261 | 61 |
| 323 Elm St | 0.35mi | 3/1.5 | 1,900 (+8%) | 10mo | $465,000 | $245 | 60 |
| 26 Shirley Rd | 0.48mi | 3/2.0 | 1,622 (-8%) | 0mo | $505,000 | $311 | 60 |
| 654 Cypress Rd | 0.74mi | 3/1.5 | 1,700 (-4%) | 1mo | $480,000 | $282 | 57 |
| 425 Grape St | 0.33mi | 3/2.0 | 1,990 (+13%) | 4mo | $465,000 | $234 | 56 |
| 124 Wallace Dr | 0.68mi | 4/1.5 (+1) | 1,792 (+2%) | 10mo | $512,500 | $286 | 50 |
| 14 Norwyn Rd | 0.44mi | 4/1.0 (+1) | 1,516 (-14%) | 5mo | $385,000 | $254 | 47 |
| 108 Meadowbrook Ave | 0.71mi | 4/2.0 (+1) | 1,653 (-6%) | 3mo | $390,000 | $236 | 45 |
| 364 Lancaster Ave | 0.70mi | 4/1.5 (+1) | 1,536 (-13%) | 10mo | $500,000 | $326 | 31 |
Match score weights: distance 35% · size 25% · config 20% · recency 20%. Top-matched comps best support the ARV.
Projected returns pro-forma
-3.0% appreciation · 3.0% rent growth · sell at horizon
- IRR
- -17.0%
- Equity multiple
- 0.40×
- Total profit
- $-55,476
- Equity at exit
- $49,189
- IRR
- -8.8%
- Equity multiple
- 0.45×
- Total profit
- $-50,782
- Equity at exit
- $28,524
Cash invested: $92,372 (down + closing). Projections, not guarantees.
Landlord ↔ Tenant lean methodology
- Overall (STATE)
- 62 Landlord-Friendly
- State Pennsylvania
- 62 Landlord-Friendly · EVEN
- County
- — inherits STATE
- City
- — inherits STATE
ZIP-level market 18974
- Active inventory
- 157
- Price-to-rent
- 9.7×
Monthly cashflow live
- Estimated rent
- $2,848 medium interval (Pro) →
- Mortgage (P&I)
- −$1,730
- Tax from tax record
- −$415 /mo · $4,980/yr
- Insurance
- −$137
- HOA
- −$0
- Vacancy / Maint / Mgmt
- −$598
- Net cashflow
- $-32
Break-even live
UW: 25.0% down · 7.5% · 30yr · 1.5% tax · 5.0% vac · 8.0% maint · 8.0% mgmt
Financing live
Cash to close
- Down payment
- $82,475
- Closing costs
- $9,897
- Reserves months
- —
- Total cash needed
- —
Loan-product check · same deal, 3 products live
Conventional
25% down · 7.5% · 30yr
- Down + closing
- —
- Monthly P&I
- —
- Monthly cashflow
- —
- DSCR
- —
- Eligible?
- —
Personal DTI + credit; lowest rate.
DSCR
20% down · 8.5% · 30yr
- Down + closing
- —
- Monthly P&I
- —
- Monthly cashflow
- —
- DSCR
- —
- Eligible?
- —
No personal income docs; deal must DSCR.
Hard money
10% down · 12.0% · 12mo
- Down + closing
- —
- Monthly P&I
- —
- Monthly cashflow
- —
- DSCR
- —
- Eligible?
- —
Short-term bridge; refi at stabilization.
Rent comps 3 comps
| Address | Beds | Baths | Sqft | Rent | $/sqft | DOM | Units | Dist |
|---|---|---|---|---|---|---|---|---|
| 357 Fir St Warminster, PA | 3.0 | 2.0 | 2000 | $2,500 | $1.25 | 23d | 1 | 0.35mi |
| 26 S York Rd Hatboro, PA | 1.0–2.0 | 1.0–2.0 | 1046 | $3,531 | $3.37 | 1d | 25 | 1.14mi |
| 123 Newtown Rd Warminster, PA | 4.0 | 2.5 | 1950 | $3,600 | $1.85 | 10d | 1 | 1.36mi |
Listing history 5 events
-
2026-04-16status Pending
-
2026-03-25price $329,900
-
2026-03-12price $349,900
-
2026-02-25$364,900 Active
-
2006-07-26soldstatus $244,000
ⓘ Source: listings_history table (triggers on properties + properties_extension) + one-shot
backfill from property_details.listing_events for pre-trigger history.
Tax reassessment forecast PA · Partial reset (capped growth)
- Current annual tax
- $4,980 · $415/mo
- Projected year-2 tax
- $5,096 · $425/mo
- Expected delta
- +$116/yr (+$10/mo · 2.3%)
ⓘ Screening estimate from a state-policy table — verify with the county assessor before closing.
Climate risk First Street
- Flood 1/10 Low FEMA zone X (unshaded) · 0% chance over 30 yrs
- Wildfire 1/10 Low
- Heat 6/10 Major 7 d/yr ≥100°F today · 15 d/yr by 30 yrs out
- Wind 6/10 Major 27% chance of damaging wind over 30 yrs
- Air quality 4/10 Moderate 5 unhealthy d/yr today · 6 by 30 yrs out
Nearby sold comps map
Loading sold comps map…
Walkable amenities ~0.75 mi
Loading nearby amenities…
Taxation est. · year 1
- Rental income
- $34,179
- − Mortgage interest
- −$18,480
- − Property taxes
- −$4,980
- − Insurance
- −$1,650
- − Repairs & maintenance
- −$2,734
- − Management
- −$2,734
- − Depreciation
- −$9,597
- Taxable loss
- −$5,996
- Est. tax savings @ 24.0%
- +$1,439
- After-tax cash flow
- $1,050/yr
For passive investors: Depreciation is non-cash, so a rental often shows a tax loss while cash-flowing — sheltering income. Rental losses are passive: they offset passive income freely, and up to $25,000/yr can offset ordinary (W-2) income if you actively participate and your MAGI is under $100k (phasing out to $0 by $150k); unused losses carry forward. On sale, claimed depreciation is recaptured at up to 25%, and gains may owe capital-gains tax (a 1031 exchange can defer both). Figures are a year-1 estimate at your 24.0% rate — not tax advice; consult a CPA.
Schools (NCES district)
- District
- Centennial SD
- NCES district ID
- 4205190
- Math proficiency
- 30% ▼ -12.00%
- Reading proficiency
- 54% ▼ -7.00%
- Median HH income
- $66,818
- Composite
- 37.66/100
- National rank
- #4370
- State rank
- #285 of 539 in PA
Livability — Hatboro
- Score
- 89/100
- State rank
- #27
- US rank
- #158
Category grades
Schools grade is shown separately in the Schools card above.
Census & demographics
- County
- Bucks County · 506,477 people
- City population
- 22,078
- Metro
- Philadelphia-Camden-Wilmington, PA-NJ-DE-MD
- Population (ZIP)
- 43,122
- Household income
- $103,779
- Rent vs Own
- Severe rent burden
- 1080.0
Population outlook (Bucks County) Hauer SSP2
- Today (2025)
- 630,973 people
- By 2030
- 627,093 · -0.6%
- By 2040
- 609,680 · -3.4%
- By 2050
- 584,225 · -7.4%
- By 2075
- 539,840 · -14.4%
- By 2100
- 483,970 · -23.3%
Race, ethnicity, and origin ACS 2023
- Neighborhood character
- Predominantly White (83%)
- Race & ethnicity
- White 83% Hispanic / Latino 6% Two or more races 5% Asian 4% Black 3%
- Hispanic origin (detail)
- Puerto Rican 2%
- Common ancestry
- Romanian 7% Scotch-Irish 4% Subsaharan African 3%
- Foreign-born
- 12% · Canada, China
- Languages at home
- 85% English-only · Russian/Polish/Slavic 5% Spanish 3% Other Indo-European 3%
Political lean MEDSL · Bucks
- 2024 margin
- Toss-up / Even · D 49.5% · R 49.5%
- 2008→2024 swing
- -8.7pp toward R · 2008: 8.7pp · 2024: -0.1pp
- All cycles
- 2024: R+0.1 2020: D+4.4 2016: D+0.6 2012: D+1.2 2008: D+8.7
Not yet ingested
- Civics
- —
Market trends
- HPI YoY
- ▼ -380.30%
- Current HPI
- 283.9835
- Rent YoY
- —
- Metro
- Philadelphia-Camden-Wilmington, PA-NJ-DE-MD
- State GDP YoY
- ▲ 1.68%
- F500 in state
- 34
Industry mix (Fortune 500 HQ in PA)
| Industry | F500 HQs | Revenue |
|---|---|---|
| Healthcare | 2 | $309B |
|
||
| Insurance | 2 | $27B |
|
||
| Telecommunications / Media | 1 | $124B |
|
||
| Industrial Distribution | 1 | $22B |
|
||
| Financial Services | 1 | $20B |
|
||
| Chemicals / Materials | 1 | $18B |
|
||
Price history
+35.2% since first listed5 events — show timeline
- 2026-04-16 Pending — BRIGHT MLS
- 2026-03-25 Price Changed $329,900 BRIGHT MLS
- 2026-03-12 Price Changed $349,900 BRIGHT MLS
- 2026-02-25 Listed $364,900 BRIGHT MLS
- 2006-07-26 Sold (Public Records) $244,000 Public Records
Property tax history
+2.9%/yrLatest (2026): $4,980 · +3.9% YoY. Source: county tax records.
Cash-flow waterfall
monthlySold comps — $/sqft
last 12 mo · ≤1 miLoading sold comps…