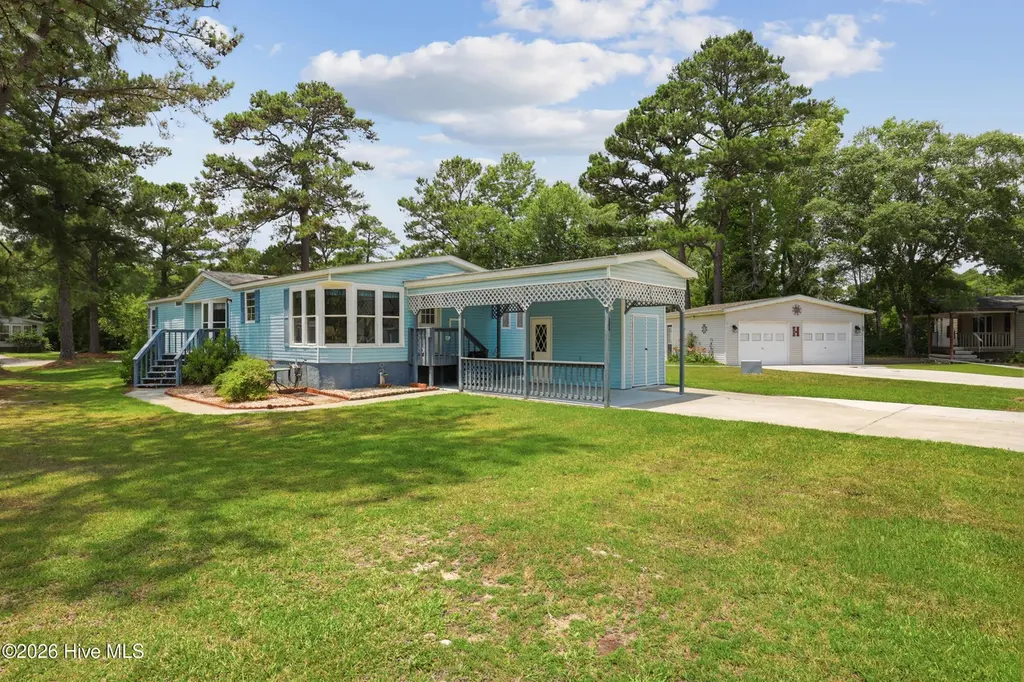
605 Outrigger Ct · Topsail Beach, NC
Flood risk 1/10 · Minimal
- FEMA flood zone
- X (unshaded)
- Chance of flooding over 30 yrs
- 0.0%
- Est. flood insurance / yr
- $507 – $1,088
Fire risk 6/10 · Moderate
- Est. fire insurance / yr
- $906 – $1,684
Heat risk 9/10 · Severe
- Hot days now (above 104°F)
- 7 days/yr
- Hot days in 30 yrs
- 19 days/yr
Wind risk 9/10 · Severe
- Chance of severe wind over 30 yrs
- 99.0%
Air-quality risk 2/10 · Minimal
- Unhealthy air days now
- 1 days/yr
- Unhealthy air days in 30 yrs
- 1 days/yr
Risk factors via First Street. Map © Google.
Why this score? — see what drove the C+ grade
The composite is a weighted blend of 9 inputs, each scored 0–100. Each bar is that input's sub-score; the figure is the points it added to the 100-point composite (weight × sub-score).
- Cash flow +24.4/30.0
- ARV discount +11.3/15.0
- DSCR +7.9/10.0
- 1% rule +6.6/10.0
- Schools +4.2/10.0
- Rent growth +3.6/5.0
- Livability +2.8/5.0
- Condition / age +2.5/5.0
- Appreciation +0.0/10.0
$199,000
🖨 Deal sheet 📄 Offer letter ✓ Due diligence
Listing remarks MLS
This home is a great deal. Open and bright with large rooms. Cul-de-sac. Fireplace and screened porch
Key facts
- Quiet cul-de-sac
- Covered carport
- Sunroom
Tags
Property features AI
Finance
- Other: Subdivision: Topsail Greens
- HOA & community: Homeowners association with annual fee of $2,340 (about $195/month)
Exterior
- Parking: Attached covered garage
- Utilities: Sewer connected; Water connected
- Home design: Manufactured home (single story); Entry level: 1
- Construction: Vinyl siding with frame construction; Crawl space foundation; Built as a manufactured home
- Exterior features: Enclosed deck; No fencing; Shingle roof; Has a view; Paved road access
Interior
- Kitchen: Kitchen island; Eat-in kitchen
- Bathrooms: 2 full bathrooms; 2 half bathrooms
- Heating & cooling: Central air conditioning; Electric heating; Heat pump
- Interior features: Entrance foyer; Kitchen island; Eat-in kitchen; Furnished
Neighborhood map
What this means for you Summary
Snapshot
- This is a 3-bed/2.0-bath manufactured listed at $199k.
Deal economics
- At list price, monthly cash flow is $404 ($5k/yr) — positive.
- The deal already cash-flows at list — no discount required.
- Meets the 1% rule at list price ($2k rent vs $199k).
- Cap rate 8.7% vs local median 2.0% in Topsail Beach — top-decile yield for the area; either an underpriced asset or a hidden risk that comps aren't pricing in. Stress-test before assuming the spread holds.
Location & tenants
- Location reads 56/100 on livability (#626 in NC) — a working-class tenant base; expect higher turnover. Strengths: crime A, employment A; Watch: health & safety D, amenities F, commute F.
- Pender County Schools (rural): math 49% / reading 50% proficiency, ranked #66 of 178 in NC (top 37%) — families likely to look elsewhere, expect single-tenant / working-renter base with shorter leases.
- Zoned schools: South Topsail Elementary (math 61% / reading 58%, grade B-, #205 of 1,410 statewide, top 16%, 557 students, 34% FRL); Topsail Middle (math 64% / reading 65%, grade A-, #30 of 475 statewide, top 7%, 807 students, 20% FRL); Topsail High (math 67% / reading 72%, grade B, #121 of 535 statewide, top 24%, 1,777 students, 22% FRL) — zoned schools average 25% FRL vs 47% district-wide (22 pts lower); this property's tenant base skews higher-income than the district average.
- Zoned-school proficiency averages 64% at this address vs 50% district-wide (+15 pts) — the actual schools serving this property are materially stronger than the Pender County Schools average implies; a family-tenant draw the district grade alone would hide.
- Market conditions: Rents rising fast (+4.6%/yr); 509 active listings in the ZIP; 5 comparable units currently listed for rent nearby; rentals at typical pace (median 22d on market — plan ~3-4 weeks tenant-placement turnaround); solid renter incomes; 943 units permitted in Pender County in 2024 (0 in 5+ unit buildings).
- This rent runs 30% of the median local income ($90k/yr) — at the standard rent-burdened threshold; future hikes will face affordability resistance.
Forward outlook
- Local home prices are declining (-3.0%/yr); year-one equity from $1k of loan paydown is wiped out by about $6k of value loss. Plan a longer hold.
- Pender County population projected at +38% by 2050 — long-run rental-demand tailwind backs the buy-and-hold thesis.
- At projected returns (-3.0% appreciation + 4.6% rent growth), your $56k cash investment doubles in ~10 years — after that, you're playing with house money.
Negotiation context
- Only 6 days on market — expect competitive offers; lowballing is unlikely to land.
- 2 sale attempts since 24y ago with the ask held roughly flat each time — persistent listings suggest the price (not the market) is what's stuck; bring a comps-based counter.
- Current owner paid $62k; list at $199k implies a 221% gain — meaningful room to come down on a strong offer.
Risks & watch-outs
- Climate carrying-cost: severe wind risk, 99% chance of damaging wind over 30y; major wildfire risk; extreme-heat days projected 7→19/yr by 2055 (HVAC capex compounding) — expect insurance premiums to compound above CPI over the hold.
Questions for the listing agent
- What does the HOA fee cover, when was the last increase, and are there any pending special assessments or reserve-fund shortfalls?
- Is there a deadline driving the sale (1031 exchange, divorce, estate, relocation)? That informs how much negotiation room exists.
- Schools are D-rated, which usually means shorter tenancies and higher turnover. Who's the typical renter profile here, and what's been the actual vacancy rate?
- What's the average days-on-market for RENTAL listings here right now (not sales)? A rising rental-DOM trend means longer vacancies and softer asking-rent achievability than the comps imply.
- What's the recent tenant-quality profile in this submarket — average credit score on applications, eviction rate, late-payment / NSF rate, and stable-employment percentage? A property-management company in the area should have these aggregated.
- How much new for-sale + rental construction is in the pipeline within 1–3 miles? Heavy new supply typically softens prices + rents 12–24 months out; constrained supply supports both.
Investment metrics
- 1% rule
- 1.16% ✓
- Cap rate
- 8.73%
- Cash-on-cash
- 8.70%
- DSCR
- 1.39
- GRM
- 7.2
CMA / ARV
- ARV (on-the-fly)
- $217,396
- Comps found
- 12
Show comp detail 12 sales within ~0.75 mi
| Address | Dist | Beds/Ba | Sqft | Sold | Price | $/sf | Match |
|---|---|---|---|---|---|---|---|
| 107 Plank Ct | 0.12mi | 3/2.0 | 1,512 (-3%) | 8mo | $218,000 | $144 | 83 |
| 105 Navy Ct | 0.13mi | 3/2.0 | 1,643 (+5%) | 4mo | $197,500 | $120 | 82 |
| 610 Galley Ct | 0.24mi | 3/2.0 | 1,571 (+0%) | 9mo | $214,000 | $136 | 81 |
| 506 Fathom Ct | 0.27mi | 3/2.0 | 1,568 (+0%) | 9mo | $224,900 | $143 | 80 |
| 713 Nautical Ct | 0.18mi | 3/2.0 | 1,568 (+0%) | 14mo | $259,900 | $166 | 79 |
| 614 Galley Ct | 0.21mi | 3/2.0 | 1,512 (-3%) | 12mo | $200,000 | $132 | 75 |
| 515 Pirate Ct | 0.03mi | 3/2.0 | 1,660 (+6%) | 17mo | $180,000 | $108 | 74 |
| 619 Outrigger Ct | 0.06mi | 2/2.0 (-1) | 1,417 (-9%) | 6mo | $220,000 | $155 | 72 |
| 719 Nautical Ct | 0.20mi | 2/2.0 (-1) | 1,400 (-10%) | 1mo | $195,000 | $139 | 67 |
| 210 Spar Ct | 0.35mi | 2/2.0 (-1) | 1,530 (-2%) | 17mo | $200,000 | $131 | 61 |
| 214 Champion Dr | 0.31mi | 3/2.0 | 1,378 (-12%) | 14mo | $210,000 | $152 | 54 |
| 108 Doral Dr | 0.47mi | 3/3.0 | 1,368 (-12%) | 2mo | $128,500 | $94 | 51 |
Match score weights: distance 35% · size 25% · config 20% · recency 20%. Top-matched comps best support the ARV.
Projected returns pro-forma
-3.0% appreciation · 4.57% rent growth · sell at horizon
- IRR
- -1.3%
- Equity multiple
- 0.95×
- Total profit
- $-2,777
- Equity at exit
- $29,672
- IRR
- 10.0%
- Equity multiple
- 1.84×
- Total profit
- $46,567
- Equity at exit
- $17,206
Cash invested: $55,720 (down + closing). Projections, not guarantees.
Landlord ↔ Tenant lean methodology
- Overall (STATE)
- 85 Strongly Landlord-Friendly
- State North Carolina
- 85 Strongly Landlord-Friendly · R+3
- County
- — inherits STATE
- City
- — inherits STATE
ZIP-level market 28443
- Rents YoY
- 4.6%
- Active inventory
- 509
- Price-to-rent
- 7.2×
Monthly cashflow live
- Estimated rent
- $2,299 high interval (Pro) →
- Mortgage (P&I)
- −$1,044
- Tax from tax record
- −$91 /mo · $1,091/yr
- Insurance
- −$83
- HOA
- −$195
- Vacancy / Maint / Mgmt
- −$483
- Net cashflow
- $404
Break-even live
UW: 25.0% down · 7.5% · 30yr · 1.5% tax · 5.0% vac · 8.0% maint · 8.0% mgmt
Financing live
Cash to close
- Down payment
- $49,750
- Closing costs
- $5,970
- Reserves months
- —
- Total cash needed
- —
Loan-product check · same deal, 3 products live
Conventional
25% down · 7.5% · 30yr
- Down + closing
- —
- Monthly P&I
- —
- Monthly cashflow
- —
- DSCR
- —
- Eligible?
- —
Personal DTI + credit; lowest rate.
DSCR
20% down · 8.5% · 30yr
- Down + closing
- —
- Monthly P&I
- —
- Monthly cashflow
- —
- DSCR
- —
- Eligible?
- —
No personal income docs; deal must DSCR.
Hard money
10% down · 12.0% · 12mo
- Down + closing
- —
- Monthly P&I
- —
- Monthly cashflow
- —
- DSCR
- —
- Eligible?
- —
Short-term bridge; refi at stabilization.
Rent comps 5 comps
| Address | Beds | Baths | Sqft | Rent | $/sqft | DOM | Units | Dist |
|---|---|---|---|---|---|---|---|---|
| 26 Mullein Dr Hampstead, NC | 2.0–4.0 | 2.0–2.5 | 1542 | $2,460 | $1.60 | 14d | 21 | 0.16mi |
| 121 Mulberry Cir Hampstead, NC | 4.0 | 3.0 | 2171 | $2,500 | $1.15 | 21d | 1 | 0.75mi |
| 508 Azalea Dr Hampstead, NC | 3.0 | 3.0 | 2154 | $2,450 | $1.14 | 14d | 1 | 0.82mi |
| 702 Azalea Dr Hampstead, NC | 2.0 | 2.0 | 1210 | $1,300 | $1.07 | 21d | 1 | 0.88mi |
| 200 Susans Dr Hampstead, NC | 3.0 | 2.0 | 1201 | $1,700 | $1.42 | 21d | 1 | 1.40mi |
HOA detail
- Monthly dues
- $195 · $2,340/yr
Listing history 6 events
-
2026-06-18days on market $199,000 Active 6 DOM
-
2026-06-17days on market $199,000 Active 5 DOM
-
2026-06-16days on market $199,000 Active 4 DOM
-
2026-06-15days on market $199,000 Active 3 DOM
-
2026-06-13remarks 689-char remark
-
2026-06-13$199,000 Active 1 DOM
ⓘ Source: listings_history table (triggers on properties + properties_extension) + one-shot
backfill from property_details.listing_events for pre-trigger history.
Tax reassessment forecast NC · Resets to sale price
- Current annual tax
- $1,091 · $91/mo
- Projected year-2 tax
- $1,632 · $136/mo
- Expected delta
- +$541/yr (+$45/mo · 49.6%)
ⓘ Screening estimate from a state-policy table — verify with the county assessor before closing.
Climate risk First Street
- Flood 1/10 Low FEMA zone X (unshaded) · 0% chance over 30 yrs
- Wildfire 6/10 Major
- Heat 9/10 Extreme 7 d/yr ≥104°F today · 19 d/yr by 30 yrs out
- Wind 9/10 Extreme 99% chance of damaging wind over 30 yrs
- Air quality 2/10 Low 1 unhealthy d/yr today · 1 by 30 yrs out
Nearby sold comps map
Loading sold comps map…
Walkable amenities ~0.75 mi
Loading nearby amenities…
Taxation est. · year 1
- Rental income
- $27,589
- − Mortgage interest
- −$11,147
- − Property taxes
- −$1,091
- − Insurance
- −$995
- − Repairs & maintenance
- −$2,207
- − Management
- −$2,207
- − HOA
- −$2,340
- − Depreciation
- −$5,789
- Taxable income
- $1,813
- Est. tax owed @ 24.0%
- −$435
- After-tax cash flow
- $4,412/yr
For passive investors: Depreciation is non-cash, so a rental often shows a tax loss while cash-flowing — sheltering income. Rental losses are passive: they offset passive income freely, and up to $25,000/yr can offset ordinary (W-2) income if you actively participate and your MAGI is under $100k (phasing out to $0 by $150k); unused losses carry forward. On sale, claimed depreciation is recaptured at up to 25%, and gains may owe capital-gains tax (a 1031 exchange can defer both). Figures are a year-1 estimate at your 24.0% rate — not tax advice; consult a CPA.
Schools (NCES district)
- District
- Pender County Schools
- NCES district ID
- 3703570
- Math proficiency
- 49% ▲ 3.00%
- Reading proficiency
- 50% ▬ 0.00%
- Median HH income
- $45,792
- Composite
- 41.97/100
- National rank
- #3342
- State rank
- #66 of 178 in NC
Livability — Topsail Beach
- Score
- 56/100
- State rank
- #626
- US rank
- #22791
Category grades
Schools grade is shown separately in the Schools card above.
Census & demographics
- County
- Pender County · 28,416 people
- Metro
- Wilmington, NC
- Population (ZIP)
- 28,416
- Household income
- $90,477
- Rent vs Own
- Severe rent burden
- 700.0
Population outlook (Pender County) Hauer SSP2
- Today (2025)
- 69,295 people
- By 2030
- 74,990 · +8.2%
- By 2040
- 85,954 · +24.0%
- By 2050
- 95,925 · +38.4%
- By 2075
- 117,525 · +69.6%
- By 2100
- 129,074 · +86.3%
Race, ethnicity, and origin ACS 2023
- Neighborhood character
- Predominantly White (82%)
- Race & ethnicity
- White 82% Two or more races 7% Black 5% Hispanic / Latino 5% Asian 1%
- Hispanic origin (detail)
- Mexican 4%
- Common ancestry
- Slovak 3% Romanian 3% Serbian 2%
- Foreign-born
- 4% · Canada
- Languages at home
- 94% English-only · Spanish 4% Other Indo-European 1%
Political lean MEDSL · Pender
- 2024 margin
- Solid R (+35.0) · D 32.1% · R 67.0%
- 2008→2024 swing
- -19.4pp toward R · 2008: -15.6pp · 2024: -35.0pp
- All cycles
- 2024: R+35.0 2020: R+29.9 2016: R+30.4 2012: R+20.4 2008: R+15.6
Not yet ingested
- Civics
- —
Market trends
- HPI YoY
- ▼ -125.51%
- Current HPI
- 188.426
- Rent YoY
- ▲ 4.57%
- Metro
- Wilmington, NC
- State GDP YoY
- ▲ 3.28%
- F500 in state
- 26
Industry mix (Fortune 500 HQ in NC)
| Industry | F500 HQs | Revenue |
|---|---|---|
| Financial Services | 2 | $213B |
|
||
| Retail | 2 | $95B |
|
||
| Industrial Conglomerate | 1 | $38B |
|
||
| Metals / Steel | 1 | $35B |
|
||
| Utilities | 1 | $30B |
|
||
| Industrial Machinery | 1 | $19B |
|
||
Price history
+184.7% since first listed3 events — show timeline
- 2026-06-12 Listed $199,000 Hive MLS
- 2002-07-09 Sold (MLS) $62,000 Hive MLS
- 2002-05-28 Listed $69,900 Hive MLS
Property tax history
+4.3%/yrLatest (2025): $1,091 · +0.0% YoY. Source: county tax records.
Cash-flow waterfall
monthlySold comps — $/sqft
last 12 mo · ≤1 miLoading sold comps…