456 Greenwood Dr · Meadow Vista, CA
Flood risk 1/10 · Minimal
- FEMA flood zone
- X (unshaded)
- Chance of flooding over 30 yrs
- 0.0%
- Est. flood insurance / yr
- $507 – $1,088
Fire risk 8/10 · Major
- Est. fire insurance / yr
- $659 – $1,223
Heat risk 5/10 · Moderate
- Hot days now (above 98°F)
- 7 days/yr
- Hot days in 30 yrs
- 16 days/yr
Wind risk 1/10 · Minimal
- Chance of severe wind over 30 yrs
- —
Air-quality risk 10/10 · Severe
- Unhealthy air days now
- 36 days/yr
- Unhealthy air days in 30 yrs
- 41 days/yr
Risk factors via First Street. Map © Google.
Why this score? — see what drove the C- grade
The composite is a weighted blend of 9 inputs, each scored 0–100. Each bar is that input's sub-score; the figure is the points it added to the 100-point composite (weight × sub-score).
- Cash flow +15.0/30.0
- ARV discount +15.0/15.0
- Schools +4.9/10.0
- DSCR +4.6/10.0
- 1% rule +3.6/10.0
- Livability +3.0/5.0
- Rent growth +2.5/5.0
- Condition / age +2.5/5.0
- Appreciation +0.0/10.0
$439,000
🖨 Deal sheet (PDF) 📄 Offer letter ✓ Due diligence
Listing remarks
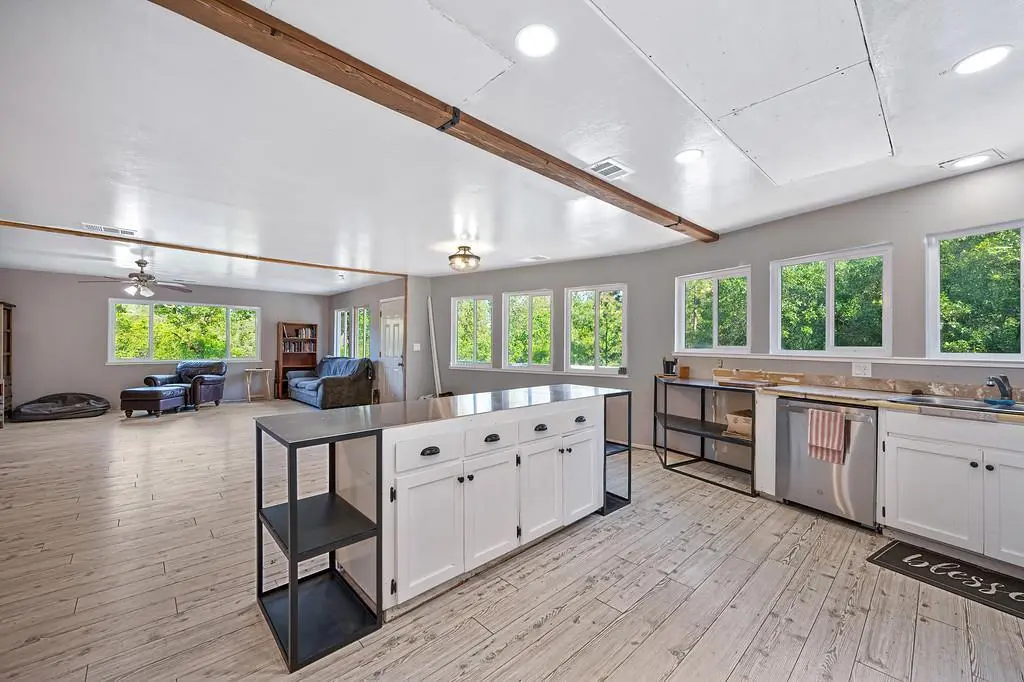
This is a fixer at a great price. Earn equity when you fix this peaceful Meadow Vista retreat. Surrounded by mature trees, the home offers serene, nature-filled views and a sense of privacy. Major updates included a roof and HVAC system that are just 5 years old, giving you a strong head start on improvements. The flexible downstairs layout provides potential for a separate living space - ideal for in-laws or guests. Upstairs, the light-filled great room creates an open, airy feel perfect for relaxing or entertaining. Storage is plentiful throughout, including an extra closet off the laundry for added convenience.
Key facts
- Adu permits
- Nature filled views
- 0.87 acre lot
Tags
Property features AI
Finance
- Other: Property address: 456 Greenwood Dr, Meadow Vista, CA 95722; Subdivision: Golden Oaks Acres
- HOA & community: No homeowners association
Exterior
- Parking: 1-car garage; Garage facing front; Guest parking available
- Utilities: Solar (photovoltaics); Propane tank leased; Public water with meter on site; Septic system; Electric: see remarks; No irrigation system
- Home design: Single-family residence (semi-custom); Fixer condition; Built in 1972; Two stories
- Construction: Composition roof
- Exterior features: Low-maintenance lot; No private pool or spa; No horses allowed; Paved driveway
Interior
- Kitchen: Metal/steel countertops; Pantry cabinet; Kitchen island; Free standing refrigerator; Dishwasher; Microwave; Free standing electric range
- Bedrooms: 4 bedrooms; Primary bedroom with walk-in closet and outside access
- Flooring: Laminate flooring; Additional flooring details: see remarks
- Bathrooms: 3 full bathrooms; Primary bathroom with shower stall(s); Other bathroom details: see remarks
- Heating & cooling: Central heating (electric); Central cooling (see remarks)
- Interior features: Cathedral ceiling; Wet bar; Uncovered deck; Dual-pane partial windows; One fireplace (living room and other)
- Laundry & utility: Laundry inside room on upper floor with cabinets; Electric hook-up for laundry; Electric water heater
Neighborhood map
What this means for you Summary
Snapshot
- This is a 3-bed/2.0-bath single-family listed at $439k.
Deal economics
- At list price, monthly cash flow is $137 ($2k/yr) — positive.
- The deal already cash-flows at list — no discount required.
- To meet the 1% rule (rent ≥ 1% of price), the offer needs to be $376k (14.2% below list).
- Recommended offer: $376k (14.2% below list) — sets the bar for 1% rule.
- Cap rate 6.7% vs local median 1.8% in Meadow Vista — top-decile yield for the area; either an underpriced asset or a hidden risk that comps aren't pricing in. Stress-test before assuming the spread holds.
Location & tenants
- Location reads 60/100 on livability (#609 in CA) — a middle-class / working-renter tenant base. Strengths: employment A+, crime A, housing B; Watch: amenities F, commute F, cost of living F.
- Placer Union High (suburban): math 39% / reading 72% proficiency, ranked #98 of 517 in CA (top 19%) — acceptable for families but not a draw, mixed tenant base, ~2y average lease.
- Zoned schools: Sierra Hills Elementary (367 students, 29% FRL); Weimar Hills (398 students, 29% FRL); Colfax High (math 37% / reading 67%, grade D+, #296 of 1,170 statewide, top 27%, 666 students, 23% FRL).
- Market conditions: 69 active listings in the ZIP; 3,535 units permitted in Placer County in 2024 (689 in 5+ unit buildings).
Forward outlook
- Local home prices are declining (-3.0%/yr); year-one equity from $3k of loan paydown is wiped out by about $13k of value loss. Plan a longer hold.
- Placer County population projected at +20% by 2050 — long-run rental-demand tailwind backs the buy-and-hold thesis.
Negotiation context
- It's been on market 67 days — a 6% lower offer ($413k) is reasonable based on typical stale-listing flexibility.
- Current owner paid $378k; 16% above their basis — modest negotiation headroom, anchor on the comps not their cost.
Risks & watch-outs
- Climate carrying-cost: severe wildfire risk; extreme-heat days projected 7→16/yr by 2055 (HVAC capex compounding) — expect insurance premiums to compound above CPI over the hold.
Questions for the listing agent
- It's been on market 67 days. Have you received any prior offers? Is the seller open to a 14% concession, seller financing, or rate buy-down credit?
- Built in 1972 — when were the roof, HVAC, electrical panel, plumbing, and water heater last replaced?
- Why hasn't it sold? Are there any deal-killer items the seller is aware of (foundation, flood, title, zoning, code violations)?
- Is there a deadline driving the sale (1031 exchange, divorce, estate, relocation)? That informs how much negotiation room exists.
- Schools are B-rated — typically a magnet for longer-tenancy family renters. What's the average tenant stay here, and is there a school-zone premium baked into asking?
- What's the average days-on-market for RENTAL listings here right now (not sales)? A rising rental-DOM trend means longer vacancies and softer asking-rent achievability than the comps imply.
- What's the recent tenant-quality profile in this submarket — average credit score on applications, eviction rate, late-payment / NSF rate, and stable-employment percentage? A property-management company in the area should have these aggregated.
- How much new for-sale + rental construction is in the pipeline within 1–3 miles? Heavy new supply typically softens prices + rents 12–24 months out; constrained supply supports both.
Investment metrics
- 1% rule
- 0.86% ✗
- Cap rate
- 6.67%
- Cash-on-cash
- 1.34%
- DSCR
- 1.06
- GRM
- 9.7
CMA / ARV
- ARV (on-the-fly)
- $671,832
- Comps found
- 10
Show comp detail 10 sales within ~0.75 mi
| Address | Dist | Beds/Ba | Sqft | Sold | Price | $/sf | Match |
|---|---|---|---|---|---|---|---|
| 892 Livingston Rd | 0.33mi | 3/2.0 | 1,944 (-0%) | 21mo | $560,000 | $288 | 66 |
| 660 Cole Rd | 0.32mi | 3/3.0 | 1,862 (-5%) | 11mo | $685,000 | $368 | 64 |
| 945 Acacia Dr | 0.53mi | 3/2.0 | 1,869 (-4%) | 6mo | $640,000 | $342 | 64 |
| 612 Red Bud Ln | 0.34mi | 4/2.0 (+1) | 2,120 (+9%) | 11mo | $770,000 | $363 | 56 |
| 970 Mill Rd | 0.44mi | 3/2.0 | 1,700 (-13%) | 3mo | $585,000 | $344 | 56 |
| 17025 Lake Arthur Rd | 0.74mi | 4/2.0 (+1) | 1,955 (+0%) | 14mo | $540,000 | $276 | 49 |
| 1175 Meadow Ln | 0.63mi | 3/2.0 | 1,666 (-15%) | 0mo | $620,000 | $372 | 46 |
| 795 Acorn Way | 0.46mi | 4/2.5 (+1) | 2,233 (+14%) | 3mo | $585,000 | $262 | 45 |
| 60 Maywood Ln | 0.66mi | 3/2.0 | 1,732 (-11%) | 14mo | $385,000 | $222 | 39 |
| 525 Hillside Dr | 0.63mi | 3/3.0 | 2,242 (+15%) | 21mo | $785,000 | $350 | 24 |
Match score weights: distance 35% · size 25% · config 20% · recency 20%. Top-matched comps best support the ARV.
Projected returns pro-forma
-3.0% appreciation · 3.0% rent growth · sell at horizon
- IRR
- -14.2%
- Equity multiple
- 0.49×
- Total profit
- $-62,451
- Equity at exit
- $65,456
- IRR
- -5.4%
- Equity multiple
- 0.65×
- Total profit
- $-43,376
- Equity at exit
- $37,957
Cash invested: $122,920 (down + closing). Projections, not guarantees.
Landlord ↔ Tenant lean methodology
- Overall (STATE)
- 18 Strongly Tenant-Friendly
- State California
- 18 Strongly Tenant-Friendly · D+13
- County
- — inherits STATE
- City
- — inherits STATE
ZIP-level market 95722
- Active inventory
- 69
- Price-to-rent
- 9.7×
Monthly cashflow live
- Estimated rent
- $3,765 medium interval (Pro) →
- Mortgage (P&I)
- −$2,302
- Tax from tax record
- −$352 /mo · $4,218/yr
- Insurance
- −$183
- HOA
- −$0
- Vacancy / Maint / Mgmt
- −$791
- Net cashflow
- $137
Break-even live
Sensitivity live
| Price | -10% $386 | -5% $262 | +0% $137 | +5% $13 | +10% $-111 |
|---|---|---|---|---|---|
| Rent | -10% $-160 | -5% $-11 | +0% $137 | +5% $286 | +10% $435 |
| Rate | -1.0pp $358 | -0.5pp $249 | base $137 | +0.5pp $24 | +1.0pp $-92 |
UW: 25.0% down · 7.5% · 30yr · 1.5% tax · 5.0% vac · 8.0% maint · 8.0% mgmt
Financing live
Cash to close
- Down payment
- $109,750
- Closing costs
- $13,170
- Reserves months
- —
- Total cash needed
- —
Loan-product check · same deal, 3 products live
Conventional
25% down · 7.5% · 30yr
- Down + closing
- —
- Monthly P&I
- —
- Monthly cashflow
- —
- DSCR
- —
- Eligible?
- —
Personal DTI + credit; lowest rate.
DSCR
20% down · 8.5% · 30yr
- Down + closing
- —
- Monthly P&I
- —
- Monthly cashflow
- —
- DSCR
- —
- Eligible?
- —
No personal income docs; deal must DSCR.
Hard money
10% down · 12.0% · 12mo
- Down + closing
- —
- Monthly P&I
- —
- Monthly cashflow
- —
- DSCR
- —
- Eligible?
- —
Short-term bridge; refi at stabilization.
Listing history 19 events
-
2026-06-21days on market $439,000 Active 67 DOM
-
2026-06-18days on market $439,000 Active 64 DOM
-
2026-06-17days on market $439,000 Active 63 DOM
-
2026-06-16days on market $439,000 Active 62 DOM
-
2026-06-15days on market $439,000 Active 61 DOM
-
2026-06-13days on market $439,000 Active 59 DOM
-
2026-06-13days on market $439,000 Active 58 DOM
-
2026-06-10price $439,000 Active 55 DOM
-
2026-06-09days on market $449,000 Active 55 DOM
-
2026-06-08days on market $449,000 Active 54 DOM
-
2026-06-07days on market $449,000 Active 53 DOM
-
2026-06-03days on market $449,000 Active 49 DOM
-
2026-06-02days on market $449,000 Active 48 DOM
-
2026-06-01days on market $449,000 Active 47 DOM
-
2026-05-31days on market $449,000 Active 46 DOM
-
2021-07-30soldstatus $378,000
-
2011-06-29soldstatus $152,000
-
1987-10-19soldstatus $90,000
-
1987-10-19soldstatus $90,000
ⓘ Source: listings_history table (triggers on properties + properties_extension) + one-shot
backfill from property_details.listing_events for pre-trigger history.
Tax reassessment forecast CA · Resets to sale price
- Current annual tax
- $4,218 · $352/mo
- Projected year-2 tax
- $4,218 · $352/mo
- Expected delta
- $0/yr ($0/mo · 0.0%)
ⓘ Screening estimate from a state-policy table — verify with the county assessor before closing.
Climate risk First Street
- Flood 1/10 Low FEMA zone X (unshaded) · 0% chance over 30 yrs
- Wildfire 8/10 Severe
- Heat 5/10 Major 7 d/yr ≥98°F today · 16 d/yr by 30 yrs out
- Wind 1/10 Low
- Air quality 10/10 Extreme 36 unhealthy d/yr today · 41 by 30 yrs out
Nearby sold comps map
Loading sold comps map…
Walkable amenities ~0.75 mi
Loading nearby amenities…
Taxation est. · year 1
- Rental income
- $45,174
- − Mortgage interest
- −$24,591
- − Property taxes
- −$4,218
- − Insurance
- −$2,195
- − Repairs & maintenance
- −$3,614
- − Management
- −$3,614
- − Depreciation
- −$12,771
- Taxable loss
- −$5,828
- Est. tax savings @ 24.0%
- +$1,399
- After-tax cash flow
- $3,047/yr
For passive investors: Depreciation is non-cash, so a rental often shows a tax loss while cash-flowing — sheltering income. Rental losses are passive: they offset passive income freely, and up to $25,000/yr can offset ordinary (W-2) income if you actively participate and your MAGI is under $100k (phasing out to $0 by $150k); unused losses carry forward. On sale, claimed depreciation is recaptured at up to 25%, and gains may owe capital-gains tax (a 1031 exchange can defer both). Figures are a year-1 estimate at your 24.0% rate — not tax advice; consult a CPA.
Schools (NCES district)
- District
- Placer Union High
- NCES district ID
- 0630750
- Math proficiency
- 39% ▲ 1.00%
- Reading proficiency
- 72% ▲ 3.00%
- Median HH income
- $69,119
- Composite
- 49.04/100
- National rank
- #2060
- State rank
- #98 of 517 in CA
Livability — Meadow Vista
- Score
- 60/100
- State rank
- #609
- US rank
- #19437
Category grades
Schools grade is shown separately in the Schools card above.
Census & demographics
- Census place
- Meadow Vista, CA
- City population
- 4,439
- Population (ZIP)
- 4,439
Population outlook (Placer County) Hauer SSP2
- Today (2025)
- 422,709 people
- By 2030
- 444,249 · +5.1%
- By 2040
- 480,192 · +13.6%
- By 2050
- 506,390 · +19.8%
- By 2075
- 550,219 · +30.2%
- By 2100
- 547,760 · +29.6%
Race, ethnicity, and origin ACS 2023
- Neighborhood character
- Predominantly White (83%)
- Race & ethnicity
- White 83% Two or more races 10% Hispanic / Latino 10% Asian 2% Pacific Islander 1%
- Hispanic origin (detail)
- Mexican 3% Cuban 5%
- Common ancestry
- Slovak 4% Italian 4% Russian 3%
- Foreign-born
- 6% · Canada
- Languages at home
- 92% English-only · Spanish 3% Korean 1% Russian/Polish/Slavic 1%
Political lean MEDSL · Placer
- 2024 margin
- Lean R (+8.5) · D 44.3% · R 52.8% · Other 2.9%
- 2008→2024 swing
- +2.8pp toward D · 2008: -11.3pp · 2024: -8.5pp
- All cycles
- 2024: R+8.5 2020: R+6.7 2016: R+11.3 2012: R+20.1 2008: R+11.3
Not yet ingested
- Civics
- —
Market trends
- HPI YoY
- ▼ -333.45%
- Current HPI
- 242.048
- Rent YoY
- —
- Metro
- —
- State GDP YoY
- ▲ 3.21%
- F500 in state
- 116
Industry mix (Fortune 500 HQ in CA)
| Industry | F500 HQs | Revenue |
|---|---|---|
| Technology | 27 | $1,492B |
|
||
| Financial Services | 3 | $174B |
|
||
| Retail | 3 | $44B |
|
||
| Insurance | 3 | $26B |
|
||
| Media / Entertainment | 2 | $115B |
|
||
| Pharmaceuticals / Biotech | 2 | $62B |
|
||
Price history
+320.0% since first listed4 events — show timeline
- 2021-07-30 Sold (Public Records) $378,000 Public Records
- 2011-06-29 Sold (Public Records) $152,000 Public Records
- 1987-10-19 Sold (Public Records) $90,000 Public Records
- 1987-10-19 Sold (Public Records) $90,000 Public Records
Property tax history
+6.7%/yrLatest (2025): $4,218 · +2.3% YoY. Source: county tax records.
Cash-flow waterfall
monthlySold comps — $/sqft
last 12 mo · ≤1 miLoading sold comps…