7515 E US Highway 80 · Hawkins, TX
Flood risk No data
- FEMA flood zone
- —
- Chance of flooding over 30 yrs
- —
- Est. flood insurance / yr
- —
Fire risk No data
- Est. fire insurance / yr
- —
Heat risk No data
- Hot days now (above threshold)
- —
- Hot days in 30 yrs
- —
Wind risk No data
- Chance of severe wind over 30 yrs
- —
Air-quality risk No data
- Unhealthy air days now
- —
- Unhealthy air days in 30 yrs
- —
Risk factors via First Street. Map © Google.
Why this score? — see what drove the C+ grade
The composite is a weighted blend of 9 inputs, each scored 0–100. Each bar is that input's sub-score; the figure is the points it added to the 100-point composite (weight × sub-score).
- Cash flow +19.3/30.0
- ARV discount +15.0/15.0
- Appreciation +6.5/10.0
- DSCR +6.1/10.0
- 1% rule +5.2/10.0
- Livability +3.7/5.0
- Schools +3.6/10.0
- Rent growth +2.5/5.0
- Condition / age +2.5/5.0
$179,900
🖨 Deal sheet 📄 Offer letter ✓ Due diligence
Listing remarks MLS
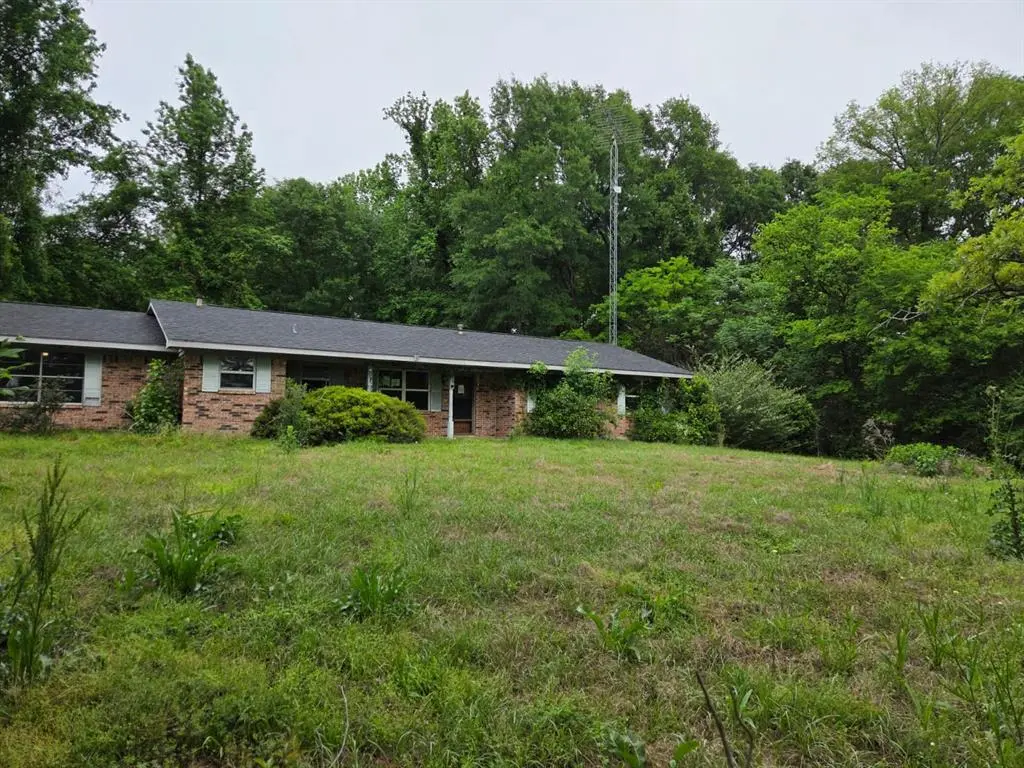
Remodeled three bedroom and two bathroom home located in quiet rural setting. Enjoy entertaining in the extra large living room with wood burning fireplace. Sitting on . 93 acres with fenced-in front and back yards. The home has brand new water proof floors through out, plus fresh paint. Brand new roof with added attic ventilation. New LED lighting, ceiling fans, and motion activated closet lights. The kitchen has brand new stove and dishwasher. The home has two-car garage, carport and storage building. Call Today!!
Key facts
- Highway frontage
- 0.93 acre lot
- 2 garage spots
Tags
Property features AI
Finance
- Other: Property listed as residential single-family; Located in Wood County, United States
- Financial info: Treat as clear loan type; No second mortgage
- HOA & community: No homeowners association
Exterior
- Parking: Two-car garage; Two covered parking spaces; Two-car carport; Additional parking available
- Utilities: Co-op electric service; Co-op water service; Not in a municipal utility district
- Home design: Single-family residence; One story; Attached property
- Construction: Built in 1985
- Exterior features: Approximately 0.93-acre lot; Will not subdivide; Access via easement drive from US Hwy 80
Interior
- Kitchen: No appliances included
- Bedrooms: Three bedrooms (all on the main level)
- Bathrooms: Two full bathrooms
- Heating & cooling: No smart home features listed
- Interior features: Cable TV available; Six total rooms; Three living areas; One dining area
Neighborhood map
What this means for you Summary
Snapshot
- This is a 3-bed/3.0-bath single-family listed at $180k.
Deal economics
- At list price, monthly cash flow is $197 ($2k/yr) — positive.
- The deal already cash-flows at list — no discount required.
- Meets the 1% rule at list price ($2k rent vs $180k).
- Recommended offer: $175k (3.0% below list) — sets the bar for market timing.
Location & tenants
- Location reads 73/100 on livability (#196 in TX, #4,982 nationally) — a middle-class / working-renter tenant base. Strengths: cost of living A+, health & safety A+, crime A-; Watch: amenities F, commute F, employment D-.
- Hawkins ISD (rural): math 42% / reading 43% proficiency, ranked #339 of 826 in TX (top 41%) — families likely to look elsewhere, expect single-tenant / working-renter base with shorter leases.
- Zoned schools: Hawkins El (math 47% / reading 47%, grade D-, #1,006 of 4,322 statewide, top 25%, 383 students, 64% FRL).
- Market conditions: 216 active listings in the ZIP; 72 units permitted in Wood County in 2024 (29 in 5+ unit buildings).
Forward outlook
- In year one you build about $7k of equity ($1k loan paydown + $6k appreciation (3.1% local appreciation)).
- Wood County population projected at +12% by 2050 — modest demand growth; plan on rents tracking national, not racing it.
- At projected returns (3.1% appreciation + 3.0% rent growth), your $50k cash investment doubles in ~5 years — after that, you're playing with house money.
- By year 6, paydown + projected appreciation supports a ~$36k cash-out refi (75% LTV) — recoverable capital for the next deal without selling this one.
Negotiation context
- It's been on market 51 days — a 3% lower offer ($175k) is reasonable based on typical stale-listing flexibility.
- 2 sale attempts since 5y ago; this cycle's ask has dropped $10k (5%) from the opening price — seller is motivated, your offer sets the floor, not the list.
Questions for the listing agent
- It's been on market 51 days. Have you received any prior offers? Is the seller open to a 3% concession, seller financing, or rate buy-down credit?
- Is there a deadline driving the sale (1031 exchange, divorce, estate, relocation)? That informs how much negotiation room exists.
- Schools are D-rated, which usually means shorter tenancies and higher turnover. Who's the typical renter profile here, and what's been the actual vacancy rate?
- What's the average days-on-market for RENTAL listings here right now (not sales)? A rising rental-DOM trend means longer vacancies and softer asking-rent achievability than the comps imply.
- What's the recent tenant-quality profile in this submarket — average credit score on applications, eviction rate, late-payment / NSF rate, and stable-employment percentage? A property-management company in the area should have these aggregated.
- How much new for-sale + rental construction is in the pipeline within 1–3 miles? Heavy new supply typically softens prices + rents 12–24 months out; constrained supply supports both.
Investment metrics
- 1% rule
- 1.02% ✓
- Cap rate
- 7.61%
- Cash-on-cash
- 4.70%
- DSCR
- 1.21
- GRM
- 8.2
CMA / ARV
- ARV (median comp)
- $322,352
- List price
- $179,900
- Delta
- -44.19%
- Verdict
- UNDERPRICED
- Comps
- 4 within 2.0 mi
Projected returns pro-forma
3.1% appreciation · 3.0% rent growth · sell at horizon
- IRR
- 12.2%
- Equity multiple
- 1.70×
- Total profit
- $35,200
- Equity at exit
- $81,870
- IRR
- 14.2%
- Equity multiple
- 3.12×
- Total profit
- $106,628
- Equity at exit
- $126,937
Cash invested: $50,372 (down + closing). Projections, not guarantees.
Landlord ↔ Tenant lean methodology
- Overall (STATE)
- 87 Strongly Landlord-Friendly
- State Texas
- 87 Strongly Landlord-Friendly · R+5
- County
- — inherits STATE
- City
- — inherits STATE
ZIP-level market 75765
- Home prices YoY
- 1.3%
- Active inventory
- 216
- Price-to-rent
- 8.2×
Monthly cashflow live
- Estimated rent
- $1,839 medium interval (Pro) →
- Mortgage (P&I)
- −$943
- Tax from tax record
- −$237 /mo · $2,848/yr
- Insurance
- −$75
- HOA
- −$0
- Vacancy / Maint / Mgmt
- −$386
- Net cashflow
- $197
Break-even live
UW: 25.0% down · 7.5% · 30yr · 1.5% tax · 5.0% vac · 8.0% maint · 8.0% mgmt
Financing live
Cash to close
- Down payment
- $44,975
- Closing costs
- $5,397
- Reserves months
- —
- Total cash needed
- —
Loan-product check · same deal, 3 products live
Conventional
25% down · 7.5% · 30yr
- Down + closing
- —
- Monthly P&I
- —
- Monthly cashflow
- —
- DSCR
- —
- Eligible?
- —
Personal DTI + credit; lowest rate.
DSCR
20% down · 8.5% · 30yr
- Down + closing
- —
- Monthly P&I
- —
- Monthly cashflow
- —
- DSCR
- —
- Eligible?
- —
No personal income docs; deal must DSCR.
Hard money
10% down · 12.0% · 12mo
- Down + closing
- —
- Monthly P&I
- —
- Monthly cashflow
- —
- DSCR
- —
- Eligible?
- —
Short-term bridge; refi at stabilization.
Listing history 21 events
-
2026-06-19days on market $179,900 Active 51 DOM
-
2026-06-18days on market $179,900 Active 50 DOM
-
2026-06-17days on market $179,900 Active 49 DOM
-
2026-06-16days on market $179,900 Active 48 DOM
-
2026-06-15days on market $179,900 Active 47 DOM
-
2026-06-14days on market $179,900 Active 45 DOM
-
2026-06-13days on market $179,900 Active 44 DOM
-
2026-06-10days on market $179,900 Active 42 DOM
-
2026-06-09days on market $179,900 Active 41 DOM
-
2026-06-08days on market $179,900 Active 40 DOM
-
2026-06-07days on market $179,900 Active 39 DOM
-
2026-06-05days on market $179,900 Active 36 DOM
-
2026-06-03days on market $179,900 Active 35 DOM
-
2026-06-02days on market $179,900 Active 34 DOM
-
2026-06-01days on market $179,900 Active 33 DOM
-
2026-05-31days on market $179,900 Active 32 DOM
-
2026-05-30days on market $179,900 Active 31 DOM
-
2026-04-29$189,900 Active 738-char remark
-
2021-04-09soldstatus
-
2021-03-24soldstatus 521-char remark
Show marketing remark (521 chars)
Remodeled three bedroom and two bathroom home located in quiet rural setting. Enjoy entertaining in the extra large living room with wood burning fireplace. Sitting on . 93 acres with fenced-in front and back yards. The home has brand new water proof floors through out, plus fresh paint. Brand new roof with added attic ventilation. New LED lighting, ceiling fans, and motion activated closet lights. The kitchen has brand new stove and dishwasher. The home has two-car garage, carport and storage building. Call Today!!
-
2021-02-09$145,000 521-char remark
Show marketing remark (521 chars)
Remodeled three bedroom and two bathroom home located in quiet rural setting. Enjoy entertaining in the extra large living room with wood burning fireplace. Sitting on . 93 acres with fenced-in front and back yards. The home has brand new water proof floors through out, plus fresh paint. Brand new roof with added attic ventilation. New LED lighting, ceiling fans, and motion activated closet lights. The kitchen has brand new stove and dishwasher. The home has two-car garage, carport and storage building. Call Today!!
ⓘ Source: listings_history table (triggers on properties + properties_extension) + one-shot
backfill from property_details.listing_events for pre-trigger history.
Tax reassessment forecast TX · Resets to sale price
- Current annual tax
- $2,848 · $237/mo
- Projected year-2 tax
- $3,292 · $274/mo
- Expected delta
- +$444/yr (+$37/mo · 15.6%)
ⓘ Screening estimate from a state-policy table — verify with the county assessor before closing.
Nearby sold comps map
Loading sold comps map…
Walkable amenities ~0.75 mi
Loading nearby amenities…
Taxation est. · year 1
- Rental income
- $22,073
- − Mortgage interest
- −$10,077
- − Property taxes
- −$2,848
- − Insurance
- −$900
- − Repairs & maintenance
- −$1,766
- − Management
- −$1,766
- − Depreciation
- −$5,233
- Taxable loss
- −$517
- Est. tax savings @ 24.0%
- +$124
- After-tax cash flow
- $2,493/yr
For passive investors: Depreciation is non-cash, so a rental often shows a tax loss while cash-flowing — sheltering income. Rental losses are passive: they offset passive income freely, and up to $25,000/yr can offset ordinary (W-2) income if you actively participate and your MAGI is under $100k (phasing out to $0 by $150k); unused losses carry forward. On sale, claimed depreciation is recaptured at up to 25%, and gains may owe capital-gains tax (a 1031 exchange can defer both). Figures are a year-1 estimate at your 24.0% rate — not tax advice; consult a CPA.
Schools (NCES district)
- District
- Hawkins ISD
- NCES district ID
- 4822770
- Math proficiency
- 42% ▼ -12.00%
- Reading proficiency
- 43% ▼ -6.00%
- Median HH income
- $43,119
- Composite
- 35.91/100
- National rank
- #4809
- State rank
- #339 of 826 in TX
Livability — Hawkins
- Score
- 73/100
- State rank
- #196
- US rank
- #4982
Category grades
Schools grade is shown separately in the Schools card above.
Census & demographics
- Population (ZIP)
- 8,195
Population outlook (Wood County) Hauer SSP2
- Today (2025)
- 46,480 people
- By 2030
- 47,796 · +2.8%
- By 2040
- 50,142 · +7.9%
- By 2050
- 52,122 · +12.1%
- By 2075
- 57,033 · +22.7%
- By 2100
- 56,418 · +21.4%
Race, ethnicity, and origin ACS 2023
- Neighborhood character
- Predominantly White (79%)
- Race & ethnicity
- White 79% Black 12% Hispanic / Latino 6% Two or more races 5%
- Hispanic origin (detail)
- Mexican 5%
- Common ancestry
- Lithuanian 2% Slovak 2% Serbian 1%
- Foreign-born
- 1% · Canada
- Languages at home
- 95% English-only · Spanish 4%
Political lean MEDSL · Wood
- 2024 margin
- Solid R (+69.7) · D 14.8% · R 84.6%
- 2008→2024 swing
- -15.5pp toward R · 2008: -54.2pp · 2024: -69.7pp
- All cycles
- 2024: R+69.7 2020: R+68.2 2016: R+70.0 2012: R+64.2 2008: R+54.2
Not yet ingested
- Civics
- —
Market trends
- HPI YoY
- ▲ 3.10%
- Current HPI
- 236.7688
- Rent YoY
- —
- Metro
- —
- State GDP YoY
- ▲ 3.95%
- F500 in state
- 110
Industry mix (Fortune 500 HQ in TX)
| Industry | F500 HQs | Revenue |
|---|---|---|
| Energy | 16 | $1,198B |
|
||
| Technology | 5 | $198B |
|
||
| Engineering / Construction | 4 | $72B |
|
||
| Energy Services | 3 | $60B |
|
||
| Utilities | 3 | $41B |
|
||
| Healthcare | 2 | $330B |
|
||
Price history
+24.1% since first listed5 events — show timeline
- 2026-05-26 Price Changed $179,900 NTREIS
- 2026-04-29 Listed $189,900 NTREIS
- 2021-04-09 Sold (Public Records) — Public Records
- 2021-03-24 Sold (MLS) — GTAR
- 2021-02-09 Listed $145,000 GTAR
Property tax history
+6.5%/yrLatest (2025): $2,848 · -5.8% YoY. Source: county tax records.
Cash-flow waterfall
monthlySold comps — $/sqft
last 12 mo · ≤1 miLoading sold comps…