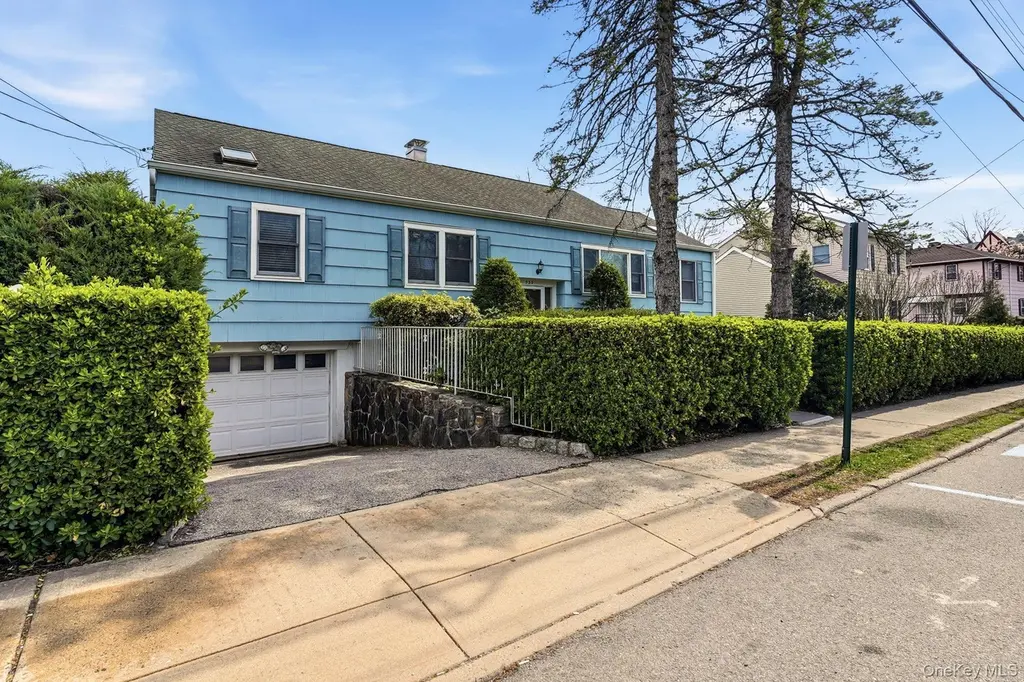
925 Halstead Ave · Mamaroneck, NY
Flood risk 5/10 · Moderate
- FEMA flood zone
- X (unshaded)
- Chance of flooding over 30 yrs
- 0.24%
- Est. flood insurance / yr
- $473 – $860
Fire risk 2/10 · Minimal
- Est. fire insurance / yr
- $691 – $1,283
Heat risk 6/10 · Moderate
- Hot days now (above 98°F)
- 7 days/yr
- Hot days in 30 yrs
- 16 days/yr
Wind risk 6/10 · Moderate
- Chance of severe wind over 30 yrs
- 27.0%
Air-quality risk 4/10 · Minor
- Unhealthy air days now
- 5 days/yr
- Unhealthy air days in 30 yrs
- 7 days/yr
Risk factors via First Street. Map © Google.
Why this score? — see what drove the D grade
The composite is a weighted blend of 9 inputs, each scored 0–100. Each bar is that input's sub-score; the figure is the points it added to the 100-point composite (weight × sub-score).
- ARV discount +15.0/15.0
- Schools +7.3/10.0
- Cash flow +7.2/30.0
- Rent growth +4.2/5.0
- Livability +3.5/5.0
- Condition / age +2.5/5.0
- 1% rule +1.8/10.0
- DSCR +1.4/10.0
- Appreciation +0.0/10.0
$825,000
🖨 Deal sheet (PDF) 📄 Offer letter ✓ Due diligence
Listing remarks
Welcome to this a well-maintained home offering comfort, space, and versatility in the heart of Mamaroneck with Rye Neck Schools. This 3-bedroom, 2 full bath residence also features an additional full bath on the lower level, providing flexible living options for guests, extended family, or a home office setup. The home boasts a spacious primary suite complete with an ensuite bath, creating a private retreat. Bright and inviting living room spaces are complemented by a sun-filled family room with an abundance of windows, allowing natural light to pour in throughout the day. A gas fireplace stove adds warmth and charm, perfect for cozy evenings. The functional layout offers a seamless flow b
Key facts
- Nicely sized yard
- Gas fireplace stove
- Additional full bath
Tags
Property features AI
Exterior
- Parking: Private driveway; On-street parking available; Garage (1 space); Carport: none
- Utilities: Electric service by Con-Edison; Public sewer; Cable connected; Public trash collection
- Home design: Single family residence; Two stories
- Construction: Frame construction
- Exterior features: Fenced yard; Patio; Not waterfront
Interior
- Kitchen: Oven; Refrigerator; Dishwasher
- Bedrooms: Two levels (total rooms: 7)
- Flooring: Hardwood
- Bathrooms: 2 full bathrooms
- Heating & cooling: Natural gas heating (baseboard); Central air; Wall/window unit(s)
- Interior features: Entrance foyer; Finished full basement with walk-out access; Pull-down attic stairs; Patio
- Laundry & utility: Washer; Dryer; Laundry in basement
Neighborhood map
What this means for you Summary
Snapshot
- This is a 3-bed/2.0-bath single-family listed at $825k.
Deal economics
- At list price, monthly cash flow is $-1k ($-13k/yr) — negative.
- To cash-flow at today's rent, offer at most $627k (24.0% below list).
- To meet the 1% rule (rent ≥ 1% of price), the offer needs to be $562k (31.9% below list).
- Recommended offer: $562k (31.9% below list) — sets the bar for 1% rule.
- Cap rate 4.7% vs local median 3.1% in Mamaroneck — top-decile yield for the area; either an underpriced asset or a hidden risk that comps aren't pricing in. Stress-test before assuming the spread holds.
Location & tenants
- Location reads 69/100 on livability (#491 in NY) — a middle-class / working-renter tenant base. Strengths: crime A+, employment A+; Watch: amenities C-, commute F, cost of living F.
- Rye Neck Union Free School District (suburban): math 78% / reading 84% proficiency, ranked #40 of 590 in NY (top 7%) — strong family-tenant draw, lease renewals of 3-5y typical; only 10% free/reduced lunch — higher-income household profile.
- Zoned schools: F E Bellows Elementary School (math 76% / reading 80%, grade A, #239 of 2,108 statewide, top 11%, 347 students, 13% FRL); Rye Neck Middle School (math 73% / reading 83%, grade A+, #37 of 729 statewide, top 5%, 351 students, 16% FRL); Rye Neck Senior High School (math 98% / reading 98%, grade A+, #19 of 1,100 statewide, top 4%, 515 students, 16% FRL).
- Market conditions: Rents rising fast (+6.7%/yr); 126 active listings in the ZIP; 21 comparable units currently listed for rent nearby; rentals at typical pace (median 15d on market — plan ~3-4 weeks tenant-placement turnaround); high-income renter base; 954 units permitted in Westchester County in 2024 (649 in 5+ unit buildings).
- At $5,622/mo this rent would consume 53% of the median local household income ($126k/yr) (locally 1152% of renters already pay >50% of income on rent) — very limited rent-growth headroom before tenants either downsize or default.
Forward outlook
- Local home prices are declining (-3.0%/yr); year-one equity from $6k of loan paydown is wiped out by about $25k of value loss. Plan a longer hold.
- Westchester County population projected at +10% by 2050 — modest demand growth; plan on rents tracking national, not racing it.
Negotiation context
- It's been on market 56 days — a 3% lower offer ($800k) is reasonable based on typical stale-listing flexibility.
- 2 sale attempts; this cycle's ask has dropped $50k (6%) from the opening price — seller is motivated, your offer sets the floor, not the list.
Risks & watch-outs
- Climate carrying-cost: moderate flood risk; major wind risk, 27% chance of damaging wind over 30y; extreme-heat days projected 7→16/yr by 2055 (HVAC capex compounding) — expect insurance premiums to compound above CPI over the hold.
Questions for the listing agent
- What do current leases actually rent for vs. the listed asking? Can we see a recent rent roll and the last 12 months of T-12 income?
- It's been on market 56 days. Have you received any prior offers? Is the seller open to a 32% concession, seller financing, or rate buy-down credit?
- Built in 1965 — when were the roof, HVAC, electrical panel, plumbing, and water heater last replaced?
- Is there a deadline driving the sale (1031 exchange, divorce, estate, relocation)? That informs how much negotiation room exists.
- Schools are B-rated — typically a magnet for longer-tenancy family renters. What's the average tenant stay here, and is there a school-zone premium baked into asking?
- The area grade is low — what's the realistic commute time and amenity access for the typical tenant pool here? Any planned neighborhood developments (good or bad) we should know about?
- What's the average days-on-market for RENTAL listings here right now (not sales)? A rising rental-DOM trend means longer vacancies and softer asking-rent achievability than the comps imply.
- What's the recent tenant-quality profile in this submarket — average credit score on applications, eviction rate, late-payment / NSF rate, and stable-employment percentage? A property-management company in the area should have these aggregated.
- How much new for-sale + rental construction is in the pipeline within 1–3 miles? Heavy new supply typically softens prices + rents 12–24 months out; constrained supply supports both.
Investment metrics
- 1% rule
- 0.68% ✗
- Cap rate
- 4.66%
- Cash-on-cash
- -5.83%
- DSCR
- 0.74
- GRM
- 12.2
CMA / ARV
- ARV (median comp)
- $1,152,756
- List price
- $825,000
- Delta
- -28.43%
- Verdict
- UNDERPRICED
- Comps
- 20 within 1.0 mi
Show comp detail 12 sales within ~0.75 mi
| Address | Dist | Beds/Ba | Sqft | Sold | Price | $/sf | Match |
|---|---|---|---|---|---|---|---|
| 812 Halstead Ave | 0.08mi | 3/2.5 | 1,924 (-7%) | 1mo | $915,000 | $476 | 81 |
| 314 Hunter St | 0.27mi | 3/3.5 | 2,088 (+1%) | 0mo | $1,212,500 | $581 | 80 |
| 215 Frank Ave | 0.27mi | 3/2.5 | 2,081 (+0%) | 7mo | $1,400,923 | $673 | 79 |
| 629 Hillside Ave | 0.37mi | 3/1.5 | 2,030 (-2%) | 0mo | $995,000 | $490 | 77 |
| 125 Travers Ave | 0.58mi | 3/2.0 | 1,938 (-7%) | 2mo | $970,000 | $501 | 61 |
| 226 Guion Dr | 0.60mi | 3/2.0 | 2,253 (+9%) | 3mo | $1,600,000 | $710 | 56 |
| 1234 Arlington St | 0.48mi | 3/1.5 | 1,832 (-12%) | 1mo | $1,250,000 | $682 | 55 |
| 1320 Mamaroneck Ave | 0.62mi | 4/2.0 (+1) | 2,228 (+7%) | 1mo | $835,000 | $375 | 53 |
| 203 Travers Ave | 0.57mi | 4/1.5 (+1) | 2,172 (+5%) | 7mo | $825,000 | $380 | 53 |
| 424 Warren Ave | 0.64mi | 4/2.5 (+1) | 2,180 (+5%) | 6mo | $1,180,000 | $541 | 50 |
| 420 Grant Ter | 0.47mi | 4/2.5 (+1) | 2,368 (+14%) | 0mo | $850,000 | $359 | 47 |
| 15 Brookside Ln | 0.74mi | 3/3.5 | 2,362 (+14%) | 1mo | $1,520,000 | $644 | 36 |
Match score weights: distance 35% · size 25% · config 20% · recency 20%. Top-matched comps best support the ARV.
Projected returns pro-forma
-3.0% appreciation · 6.7% rent growth · sell at horizon
- IRR
- -22.4%
- Equity multiple
- 0.21×
- Total profit
- $-183,401
- Equity at exit
- $123,010
- IRR
- -9.5%
- Equity multiple
- 0.33×
- Total profit
- $-155,541
- Equity at exit
- $71,331
Cash invested: $231,000 (down + closing). Projections, not guarantees.
Landlord ↔ Tenant lean methodology
- Overall (STATE)
- 15 Strongly Tenant-Friendly
- State New York
- 15 Strongly Tenant-Friendly · D+10
- County
- — inherits STATE
- City
- — inherits STATE
ZIP-level market 10543
- Rents YoY
- 6.7%
- Active inventory
- 126
- Price-to-rent
- 12.2×
Monthly cashflow live
- Estimated rent
- $5,622 high interval (Pro) →
- Mortgage (P&I)
- −$4,326
- Tax from tax record
- −$893 /mo · $10,712/yr
- Insurance
- −$344
- HOA
- −$0
- Vacancy / Maint / Mgmt
- −$1,181
- Net cashflow
- $-1,121
Break-even live
Sensitivity live
| Price | -10% $-654 | -5% $-888 | +0% $-1,121 | +5% $-1,355 | +10% $-1,588 |
|---|---|---|---|---|---|
| Rent | -10% $-1,566 | -5% $-1,343 | +0% $-1,121 | +5% $-899 | +10% $-677 |
| Rate | -1.0pp $-706 | -0.5pp $-912 | base $-1,121 | +0.5pp $-1,335 | +1.0pp $-1,553 |
UW: 25.0% down · 7.5% · 30yr · 1.5% tax · 5.0% vac · 8.0% maint · 8.0% mgmt
Financing live
Cash to close
- Down payment
- $206,250
- Closing costs
- $24,750
- Reserves months
- —
- Total cash needed
- —
Loan-product check · same deal, 3 products live
Conventional
25% down · 7.5% · 30yr
- Down + closing
- —
- Monthly P&I
- —
- Monthly cashflow
- —
- DSCR
- —
- Eligible?
- —
Personal DTI + credit; lowest rate.
DSCR
20% down · 8.5% · 30yr
- Down + closing
- —
- Monthly P&I
- —
- Monthly cashflow
- —
- DSCR
- —
- Eligible?
- —
No personal income docs; deal must DSCR.
Hard money
10% down · 12.0% · 12mo
- Down + closing
- —
- Monthly P&I
- —
- Monthly cashflow
- —
- DSCR
- —
- Eligible?
- —
Short-term bridge; refi at stabilization.
Rent comps 21 comps
| Address | Beds | Baths | Sqft | Rent | $/sqft | DOM | Units | Dist |
|---|---|---|---|---|---|---|---|---|
| 1408 Henry Ave #2 Mamaroneck, NY | 3.0 | 1.5 | 1400 | $4,200 | $3.00 | 45d | 1 | 0.27mi |
| 621 2nd St Mamaroneck, NY | 2.0 | 1.0 | 2060 | $3,000 | $1.46 | 46d | 1 | 0.30mi |
| 14 Fremont St Unit 1 Harrison, NY | 3.0 | 2.0 | 1500 | $4,300 | $2.87 | 9d | 1 | 0.38mi |
| 94 Thatcher Ave Harrison, NY | 4.0 | 3.5 | 2600 | $8,250 | $3.17 | 0d | 1 | 0.45mi |
| 209 Halstead Ave Unit 3 Mamaroneck, NY | 3.0 | 1.0 | 1500 | $3,975 | $2.65 | 45d | 1 | 0.56mi |
| 1035 Shore Acres Dr Mamaroneck, NY | 4.0 | 3.0 | 1988 | $9,900 | $4.98 | 0d | 1 | 0.56mi |
| 101 Sheldrake Pl Unit 101-4 Mamaroneck, NY | 2.0 | 2.0 | 2472 | $4,295 | $1.74 | 1d | 1 | 0.58mi |
| 317 Hornidge Rd Mamaroneck, NY | 4.0 | 2.0 | 1600 | $5,500 | $3.44 | 18d | 1 | 0.66mi |
| 658 Shore Acres Dr Mamaroneck, NY | 3.0 | 3.5 | 2062 | $18,000 | $8.73 | 0d | 1 | 0.72mi |
| 69 Oak St Unit B Harrison, NY | 3.0 | 3.5 | 2100 | $7,000 | $3.33 | 0d | 1 | 0.73mi |
| 8 Marion Ave #6 Harrison, NY | 3.0 | 2.5 | 1420 | $6,400 | $4.51 | 6d | 1 | 0.77mi |
| 8 Davenport St Harrison, NY | 3.0 | 2.0 | 1700 | $5,000 | $2.94 | 4d | 1 | 0.89mi |
| 135 Webster Ave Harrison, NY | 3.0 | 1.0 | 1500 | $3,300 | $2.20 | 20d | 1 | 0.90mi |
| 505 Prospect Ave Mamaroneck, NY | 3.0 | 1.5 | 1500 | $6,700 | $4.47 | 15d | 1 | 1.00mi |
| 140 Rockwell St Unit A Harrison, NY | 3.0 | 2.5 | 1850 | $7,000 | $3.78 | 6d | 1 | 1.01mi |
| 52 Nelson Ave Unit 2 Harrison, NY | 3.0 | 1.5 | 1450 | $4,000 | $2.76 | 20d | 1 | 1.04mi |
| 69 Ellsworth Ave Harrison, NY | 3.0 | 2.5 | 2000 | $6,500 | $3.25 | 45d | 1 | 1.06mi |
| 530 West St Harrison, NY | 4.0 | 2.5 | 2331 | $6,000 | $2.57 | 45d | 1 | 1.08mi |
| 332 Halstead Ave Harrison, NY | 1.0–3.0 | 1.0–3.0 | 1116 | $5,000 | $4.48 | 0d | 1 | 1.18mi |
| 89 Crystal St Harrison, NY | 3.0 | 2.5 | 1700 | $8,250 | $4.85 | 20d | 1 | 1.28mi |
| 87 Crystal St Harrison, NY | 3.0 | 2.5 | 1700 | $8,250 | $4.85 | 20d | 1 | 1.28mi |
Listing history 16 events
-
2026-06-18days on market $825,000 Active 56 DOM
-
2026-06-17days on market $825,000 Active 55 DOM
-
2026-06-16days on market $825,000 Active 54 DOM
-
2026-06-15days on market $825,000 Active 53 DOM
-
2026-06-13days on market $825,000 Active 51 DOM
-
2026-06-13days on market $825,000 Active 50 DOM
-
2026-06-09days on market $825,000 Active 48 DOM
-
2026-06-08days on market $825,000 Active 47 DOM
-
2026-06-08days on market $825,000 Active 46 DOM
-
2026-06-04days on market $825,000 Active 43 DOM
-
2026-06-03days on market $825,000 Active 42 DOM
-
2026-06-02days on market $825,000 Active 41 DOM
-
2026-06-01days on market $825,000 Active 40 DOM
-
2026-05-31days on market $825,000 Active 39 DOM
-
2026-05-12price $825,000 1029-char remark
-
2026-04-17$875,000 Active 1029-char remark
ⓘ Source: listings_history table (triggers on properties + properties_extension) + one-shot
backfill from property_details.listing_events for pre-trigger history.
Tax reassessment forecast NY · Partial reset (capped growth)
- Current annual tax
- $10,712 · $893/mo
- Projected year-2 tax
- $12,327 · $1,027/mo
- Expected delta
- +$1,615/yr (+$135/mo · 15.1%)
ⓘ Screening estimate from a state-policy table — verify with the county assessor before closing.
Climate risk First Street
- Flood 5/10 Major FEMA zone X (unshaded) · 24% chance over 30 yrs
- Wildfire 2/10 Low
- Heat 6/10 Major 7 d/yr ≥98°F today · 16 d/yr by 30 yrs out
- Wind 6/10 Major 27% chance of damaging wind over 30 yrs
- Air quality 4/10 Moderate 5 unhealthy d/yr today · 7 by 30 yrs out
Nearby sold comps map
Loading sold comps map…
Walkable amenities ~0.75 mi
Loading nearby amenities…
Taxation est. · year 1
- Rental income
- $67,464
- − Mortgage interest
- −$46,213
- − Property taxes
- −$10,712
- − Insurance
- −$4,125
- − Repairs & maintenance
- −$5,397
- − Management
- −$5,397
- − Depreciation
- −$24,000
- Taxable loss
- −$28,380
- Est. tax savings @ 24.0%
- +$6,811
- After-tax cash flow
- $-6,646/yr
For passive investors: Depreciation is non-cash, so a rental often shows a tax loss while cash-flowing — sheltering income. Rental losses are passive: they offset passive income freely, and up to $25,000/yr can offset ordinary (W-2) income if you actively participate and your MAGI is under $100k (phasing out to $0 by $150k); unused losses carry forward. On sale, claimed depreciation is recaptured at up to 25%, and gains may owe capital-gains tax (a 1031 exchange can defer both). Figures are a year-1 estimate at your 24.0% rate — not tax advice; consult a CPA.
Schools (NCES district)
- District
- Rye Neck Union Free School District
- NCES district ID
- 3625290
- Math proficiency
- 78% ▬ 0.00%
- Reading proficiency
- 84% ▲ 12.00%
- Median HH income
- $99,235
- Composite
- 73.17/100
- National rank
- #188
- State rank
- #40 of 590 in NY
Livability — Mamaroneck
- Score
- 69/100
- State rank
- #491
- US rank
- #8656
Category grades
Schools grade is shown separately in the Schools card above.
Census & demographics
- Census place
- Mamaroneck, NY
- County
- Westchester County · 709,332 people
- City population
- 20,989
- Metro
- New York-Newark-Jersey City, NY-NJ-PA
- Population (ZIP)
- 20,989
- Household income
- $126,417
- Rent vs Own
- Severe rent burden
- 1152.0
Population outlook (Westchester County) Hauer SSP2
- Today (2025)
- 1,028,035 people
- By 2030
- 1,051,636 · +2.3%
- By 2040
- 1,098,520 · +6.9%
- By 2050
- 1,136,044 · +10.5%
- By 2075
- 1,196,925 · +16.4%
- By 2100
- 1,175,147 · +14.3%
Race, ethnicity, and origin ACS 2023
- Neighborhood character
- Diverse neighborhood (Simpson 0.57)
- Race & ethnicity
- White 59% Hispanic / Latino 27% Two or more races 11% Asian 5% Black 4% Native American 1%
- Hispanic origin (detail)
- Mexican 5% Puerto Rican 4% Dominican 2%
- Common ancestry
- Russian 3% Romanian 2% Scotch-Irish 2%
- Foreign-born
- 28% · Canada, Jamaica, China
- Languages at home
- 60% English-only · Spanish 23% Other Indo-European 8% Other Asian/Pacific 2%
Political lean MEDSL · Westchester
- 2024 margin
- Strong D (+26.3) · D 63.1% · R 36.9%
- 2008→2024 swing
- -1.3pp toward R · 2008: 27.6pp · 2024: 26.3pp
- All cycles
- 2024: D+26.3 2020: D+36.3 2016: D+32.8 2012: D+22.2 2008: D+27.6
Not yet ingested
- Civics
- —
Market trends
- HPI YoY
- ▼ -220.53%
- Current HPI
- 268.4687
- Rent YoY
- ▲ 6.70%
- Metro
- New York-Newark-Jersey City, NY-NJ-PA
- State GDP YoY
- ▲ 2.60%
- F500 in state
- 92
Industry mix (Fortune 500 HQ in NY)
| Industry | F500 HQs | Revenue |
|---|---|---|
| Financial Services | 10 | $950B |
|
||
| Consumer Goods | 9 | $162B |
|
||
| Insurance | 4 | $225B |
|
||
| Telecommunications | 2 | $144B |
|
||
| Pharmaceuticals | 2 | $112B |
|
||
| Media / Entertainment | 2 | $69B |
|
||
Price history
-5.7% since first listed3 events — show timeline
- 2026-06-12 Relisted — OneKey® MLS as Distributed by MLS Grid
- 2026-05-12 Price Changed $825,000 OneKey® MLS as Distributed by MLS Grid
- 2026-04-17 Listed $875,000 OneKey® MLS as Distributed by MLS Grid
Property tax history
+0.8%/yrLatest (2025): $10,712 · -28.1% YoY. Source: county tax records.
Cash-flow waterfall
monthlySold comps — $/sqft
last 12 mo · ≤1 miLoading sold comps…