 Duplex
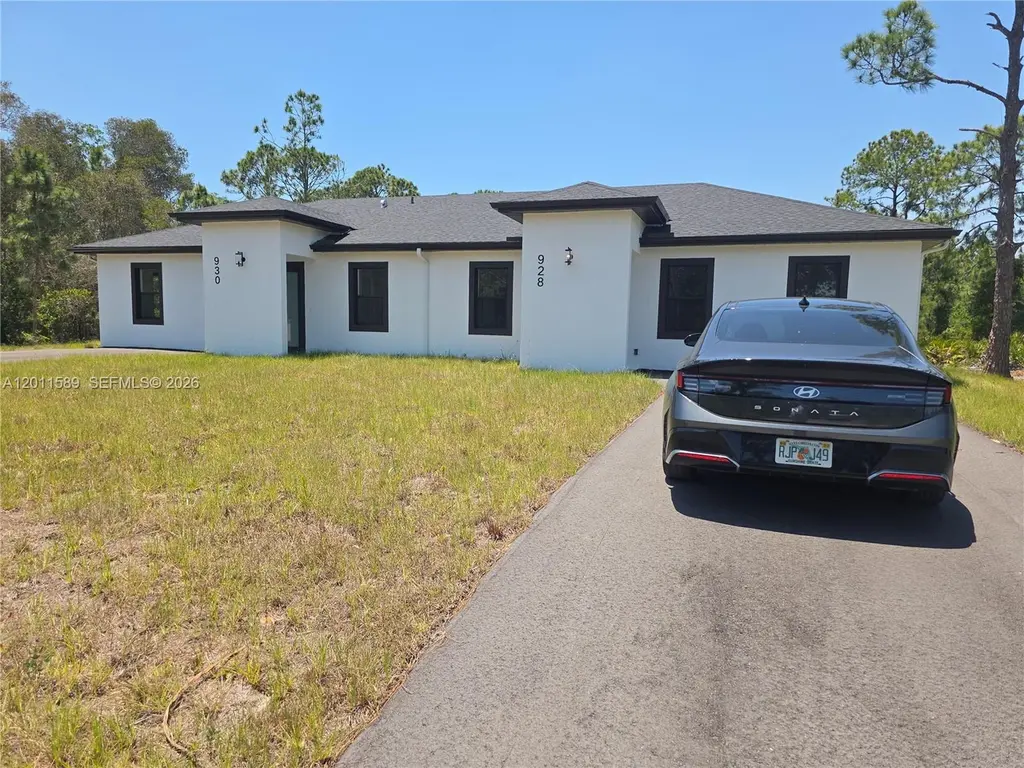
928-930 Hepburn Ave · Lehigh Acres, FL
Flood risk 1/10 · Minimal
- FEMA flood zone
- X (unshaded)
- Chance of flooding over 30 yrs
- 0.0%
- Est. flood insurance / yr
- $507 – $1,088
Fire risk 4/10 · Minor
- Est. fire insurance / yr
- $947 – $1,759
Heat risk 9/10 · Severe
- Hot days now (above 108°F)
- 7 days/yr
- Hot days in 30 yrs
- 28 days/yr
Wind risk 10/10 · Severe
- Chance of severe wind over 30 yrs
- 99.0%
Air-quality risk 2/10 · Minimal
- Unhealthy air days now
- 1 days/yr
- Unhealthy air days in 30 yrs
- 2 days/yr
Risk factors via First Street. Map © Google.
Why this score? — see what drove the D- grade
The composite is a weighted blend of 9 inputs, each scored 0–100. Each bar is that input's sub-score; the figure is the points it added to the 100-point composite (weight × sub-score).
- Appreciation +10.0/10.0
- ARV discount +7.5/15.0
- Cash flow +6.9/30.0
- Schools +4.1/10.0
- Livability +3.0/5.0
- Condition / age +2.5/5.0
- 1% rule +1.9/10.0
- Rent growth +1.3/5.0
- DSCR +1.2/10.0
$565,000
🖨 Deal sheet 📄 Offer letter ✓ Due diligence
Multi-family units
County records classify this as Multi-Family (2-4 Unit). Listing-text estimate: 2 units. confirmed
Listing remarks
Stunning new construction. unique investment opportunity. offering exceptional design flexibility, and income potential This expansive 2.956 sf ft Duplex sits on a 12,502 sf ft lot, with each residence featuring 3 bedrooms and 2 bathrooms, private entrances, and exclusive patio spaces. Appointed with impact-resistant windows and doors and sleek stainless steel appliances, the property blends modern style with durability A rare and valuable opportunity, this resident can also be transformed unto a 4 units multifamily configuration ( two 2-bedroom-1bath units and two 1-bedroom -1bath units) acreating a significant income potential . Ideal for discerning investors or homeowners seeking both
Key facts
- 4 parking spots
- Built 2025
- Listed 47 days
Property features AI
Exterior
- Parking: 4 parking spaces
- Utilities: Cable available; Public sewer
- Home design: Single-story; Resale property
- Construction: Block construction
- Exterior features: Less than quarter acre lot
Interior
- Flooring: Ceramic tile
- Heating & cooling: Central heating; Central air conditioning
- Interior features: Ceramic tile flooring
Neighborhood map
What this means for you Summary
Snapshot
- This is a 2 × 3-bed/2-bath units multifamily listed at $565k.
Deal economics
- At list price, monthly cash flow is $-844 ($-10k/yr) — negative. Per door: $-422/mo.
- To cash-flow at today's rent, offer at most $443k (21.6% below list).
- To meet the 1% rule (rent ≥ 1% of price), the offer needs to be $387k (31.4% below list).
- Recommended offer: $387k (31.4% below list) — sets the bar for 1% rule.
Location & tenants
- Location reads 59/100 on livability (#826 in FL) — a working-class tenant base; expect higher turnover. Strengths: cost of living A+, housing A+; Watch: crime C-, employment D+, schools D-.
- Lee (suburban): math 47% / reading 50% proficiency, ranked #42 of 73 in FL (top 58%) — families likely to look elsewhere, expect single-tenant / working-renter base with shorter leases.
- Market conditions: Rents falling (-4.7%/yr); 2460 active listings in the ZIP; 15,411 units permitted in Lee County in 2024 (4,686 in 5+ unit buildings).
- At $3,874/mo this rent would consume 64% of the median local household income ($72k/yr) (locally 434% of renters already pay >50% of income on rent) — very limited rent-growth headroom before tenants either downsize or default.
Forward outlook
- In year one you build about $60k of equity ($4k loan paydown + $56k appreciation (10.0% local appreciation)).
- Lee County population projected at +44% by 2050 — long-run rental-demand tailwind backs the buy-and-hold thesis.
- By year 2, paydown + projected appreciation supports a ~$97k cash-out refi (75% LTV) — recoverable capital for the next deal without selling this one.
Negotiation context
- It's been on market 47 days — a 3% lower offer ($548k) is reasonable based on typical stale-listing flexibility.
- 7 sale attempts with the ask held roughly flat each time — persistent listings suggest the price (not the market) is what's stuck; bring a comps-based counter.
Risks & watch-outs
- Climate carrying-cost: severe wind risk, 99% chance of damaging wind over 30y; extreme-heat days projected 7→28/yr by 2055 (HVAC capex compounding) — expect insurance premiums to compound above CPI over the hold.
Questions for the listing agent
- What do current leases actually rent for vs. the listed asking? Can we see a recent rent roll and the last 12 months of T-12 income?
- It's been on market 47 days. Have you received any prior offers? Is the seller open to a 31% concession, seller financing, or rate buy-down credit?
- Can we see the unit-by-unit rent roll, current vacancy, and any below-market leases? What's the average tenancy length?
- What capital expenditures (roof, boiler, parking lot, exteriors) have been made in the last 5 years, and what's planned in the next 2?
- Is there a deadline driving the sale (1031 exchange, divorce, estate, relocation)? That informs how much negotiation room exists.
- Schools are D-rated, which usually means shorter tenancies and higher turnover. Who's the typical renter profile here, and what's been the actual vacancy rate?
- The area grade is low — what's the realistic commute time and amenity access for the typical tenant pool here? Any planned neighborhood developments (good or bad) we should know about?
- What's the average days-on-market for RENTAL listings here right now (not sales)? A rising rental-DOM trend means longer vacancies and softer asking-rent achievability than the comps imply.
- What's the recent tenant-quality profile in this submarket — average credit score on applications, eviction rate, late-payment / NSF rate, and stable-employment percentage? A property-management company in the area should have these aggregated.
- How much new apartment / multifamily construction is in the pipeline within 1–3 miles? Heavy new supply (>2% of stock underway) typically softens rents 12–24 months out; light construction supports rent growth.
Investment metrics
- 1% rule
- 0.69% ✗
- Cap rate
- 4.50%
- Cash-on-cash
- -6.40%
- DSCR
- 0.72
- GRM
- 12.2
CMA / ARV
No comps found within radius.
Projected returns pro-forma
10.0% appreciation · 0.0% rent growth · sell at horizon
- IRR
- 19.0%
- Equity multiple
- 2.53×
- Total profit
- $242,656
- Equity at exit
- $508,997
- IRR
- 17.0%
- Equity multiple
- 5.66×
- Total profit
- $736,649
- Equity at exit
- $1,097,671
Cash invested: $158,200 (down + closing). Projections, not guarantees.
Landlord ↔ Tenant lean methodology
- Overall (STATE)
- 87 Strongly Landlord-Friendly
- State Florida
- 87 Strongly Landlord-Friendly · R+3
- County
- — inherits STATE
- City
- — inherits STATE
ZIP-level market 33974
- Home prices YoY
- 5.8%
- Rents YoY
- -4.7%
- Active inventory
- 2460
- Price-to-rent
- 24.3×
Monthly cashflow live
- Estimated rent
- $3,874 high interval (Pro) →
- Mortgage (P&I)
- −$2,963
- Tax est. 1.5%
- −$706 /mo · $8,475/yr
- Insurance
- −$235
- HOA
- −$0
- Vacancy / Maint / Mgmt
- −$814
- Net cashflow
- $-844
Break-even live
2-unit breakdown (identical units grouped — click to expand)
| Units | Beds | Baths | Est. rent |
|---|---|---|---|
| 2× units | 3 | 2 | $3,874 |
| #1 | 3 | 2 | $1,937 |
| #2 | 3 | 2 | $1,937 |
| Total (2 units) | $3,874 | ||
UW: 25.0% down · 7.5% · 30yr · 1.5% tax · 5.0% vac · 8.0% maint · 8.0% mgmt
Financing live
Cash to close
- Down payment
- $141,250
- Closing costs
- $16,950
- Reserves months
- —
- Total cash needed
- —
Loan-product check · same deal, 3 products live
Conventional
25% down · 7.5% · 30yr
- Down + closing
- —
- Monthly P&I
- —
- Monthly cashflow
- —
- DSCR
- —
- Eligible?
- —
Personal DTI + credit; lowest rate.
DSCR
20% down · 8.5% · 30yr
- Down + closing
- —
- Monthly P&I
- —
- Monthly cashflow
- —
- DSCR
- —
- Eligible?
- —
No personal income docs; deal must DSCR.
Hard money
10% down · 12.0% · 12mo
- Down + closing
- —
- Monthly P&I
- —
- Monthly cashflow
- —
- DSCR
- —
- Eligible?
- —
Short-term bridge; refi at stabilization.
Listing history 29 events
-
2026-06-17days on market $565,000 Active 47 DOM
-
2026-06-16days on market $565,000 Active 46 DOM
-
2026-06-15days on market $565,000 Active 45 DOM
-
2026-06-13days on market $565,000 Active 43 DOM
-
2026-06-10days on market $565,000 Active 40 DOM
-
2026-06-09days on market $565,000 Active 39 DOM
-
2026-06-08days on market $565,000 Active 38 DOM
-
2026-06-07days on market $565,000 Active 37 DOM
-
2026-06-03days on market $565,000 Active 33 DOM
-
2026-06-02days on market $565,000 Active 32 DOM
-
2026-06-01days on market $565,000 Active 31 DOM
-
2026-05-31days on market $565,000 Active 30 DOM
-
2026-05-01$565,000 Active
-
2026-04-30historical
-
2026-04-23price $525,000
-
2026-03-05price $539,000
-
2026-02-12price $549,000
-
2026-01-28$559,000 Active
-
2026-01-07$559,000 Active
-
2025-11-20historical
-
2025-11-15price $559,999
-
2025-11-15historical
-
2025-11-15historical
-
2025-11-13status Active
-
2025-11-02status Pending
-
2025-10-06price $559,999
-
2025-09-13$579,999 Active
-
2025-09-08$579,999 Active
-
2025-09-03$579,999 Active
ⓘ Source: listings_history table (triggers on properties + properties_extension) + one-shot
backfill from property_details.listing_events for pre-trigger history.
Climate risk First Street
- Flood 1/10 Low FEMA zone X (unshaded) · 0% chance over 30 yrs
- Wildfire 4/10 Moderate
- Heat 9/10 Extreme 7 d/yr ≥108°F today · 28 d/yr by 30 yrs out
- Wind 10/10 Extreme 99% chance of damaging wind over 30 yrs
- Air quality 2/10 Low 1 unhealthy d/yr today · 2 by 30 yrs out
Nearby sold comps map
Loading sold comps map…
Walkable amenities ~0.75 mi
Loading nearby amenities…
Taxation est. · year 1
- Rental income
- $46,488
- − Mortgage interest
- −$31,649
- − Property taxes
- −$8,475
- − Insurance
- −$2,825
- − Repairs & maintenance
- −$3,719
- − Management
- −$3,719
- − Depreciation
- −$16,436
- Taxable loss
- −$20,335
- Est. tax savings @ 24.0%
- +$4,880
- After-tax cash flow
- $-5,249/yr
For passive investors: Depreciation is non-cash, so a rental often shows a tax loss while cash-flowing — sheltering income. Rental losses are passive: they offset passive income freely, and up to $25,000/yr can offset ordinary (W-2) income if you actively participate and your MAGI is under $100k (phasing out to $0 by $150k); unused losses carry forward. On sale, claimed depreciation is recaptured at up to 25%, and gains may owe capital-gains tax (a 1031 exchange can defer both). Figures are a year-1 estimate at your 24.0% rate — not tax advice; consult a CPA.
Schools (NCES district)
- District
- Lee
- NCES district ID
- 1201080
- Math proficiency
- 47% ▼ -11.00%
- Reading proficiency
- 50% ▼ -4.00%
- Median HH income
- $49,518
- Composite
- 41.49/100
- National rank
- #3458
- State rank
- #42 of 73 in FL
Livability — Lehigh Acres
- Score
- 59/100
- State rank
- #826
- US rank
- #20055
Category grades
Schools grade is shown separately in the Schools card above.
Census & demographics
- Census place
- Lehigh Acres, FL
- County
- Lee County · 788,662 people
- City population
- 130,638
- Metro
- Cape Coral-Fort Myers, FL
- Population (ZIP)
- 19,927
- Household income
- $72,192
- Rent vs Own
- Severe rent burden
- 434.0
Population outlook (Lee County) Hauer SSP2
- Today (2025)
- 871,946 people
- By 2030
- 955,468 · +9.6%
- By 2040
- 1,113,587 · +27.7%
- By 2050
- 1,256,891 · +44.1%
- By 2075
- 1,560,270 · +78.9%
- By 2100
- 1,726,848 · +98.0%
Race, ethnicity, and origin ACS 2023
- Neighborhood character
- Diverse neighborhood (Simpson 0.64)
- Race & ethnicity
- Hispanic / Latino 52% Two or more races 31% White 26% Black 18%
- Hispanic origin (detail)
- Mexican 12% Puerto Rican 7% Cuban 20% Dominican 4%
- Common ancestry
- Hispanic 7% Italian 1% Portuguese 1%
- Foreign-born
- 32% · Canada, Jamaica
- Languages at home
- 48% English-only · Spanish 43% French/Haitian/Cajun 7% Other Indo-European 1%
Political lean MEDSL · Lee
- 2024 margin
- Strong R (+28.4) · D 35.5% · R 63.9%
- 2008→2024 swing
- -18.0pp toward R · 2008: -10.4pp · 2024: -28.4pp
- All cycles
- 2024: R+28.4 2020: R+19.2 2016: R+20.4 2012: R+16.6 2008: R+10.4
Not yet ingested
- Civics
- —
Market trends
- HPI YoY
- ▲ 16.53%
- Current HPI
- 303.3399
- Rent YoY
- ▼ -4.68%
- Metro
- Cape Coral-Fort Myers, FL
- State GDP YoY
- ▲ 3.28%
- F500 in state
- 36
Industry mix (Fortune 500 HQ in FL)
| Industry | F500 HQs | Revenue |
|---|---|---|
| Industrial Technology | 2 | $29B |
|
||
| Insurance | 2 | $17B |
|
||
| Retail | 1 | $60B |
|
||
| Technology Distribution | 1 | $58B |
|
||
| Homebuilding | 1 | $35B |
|
||
| Technology Manufacturing | 1 | $35B |
|
||
Price history
-2.6% since first listed17 events — show timeline
- 2026-05-01 Listed $565,000 MARMLS
- 2026-04-30 Listing Removed — NAPLESMLS
- 2026-04-23 Price Changed $525,000 NAPLESMLS
- 2026-03-05 Price Changed $539,000 NAPLESMLS
- 2026-02-12 Price Changed $549,000 NAPLESMLS
- 2026-01-28 Listed $559,000 NAPLESMLS
- 2026-01-07 Listed $559,000 BEARMLS
- 2025-11-20 Listing Removed — MARMLS
- 2025-11-15 Price Changed $559,999 Stellar MLS as Distributed by MLS Grid
- 2025-11-15 Listing Removed — NAPLESMLS
- 2025-11-15 Listing Removed — Stellar MLS as Distributed by MLS Grid
- 2025-11-13 Relisted — NAPLESMLS
- 2025-11-02 Pending — NAPLESMLS
- 2025-10-06 Price Changed $559,999 NAPLESMLS
- 2025-09-13 Listed $579,999 MARMLS
- 2025-09-08 Listed $579,999 Stellar MLS as Distributed by MLS Grid
- 2025-09-03 Listed $579,999 NAPLESMLS
Cash-flow waterfall
monthlySold comps — $/sqft
last 12 mo · ≤1 miLoading sold comps…