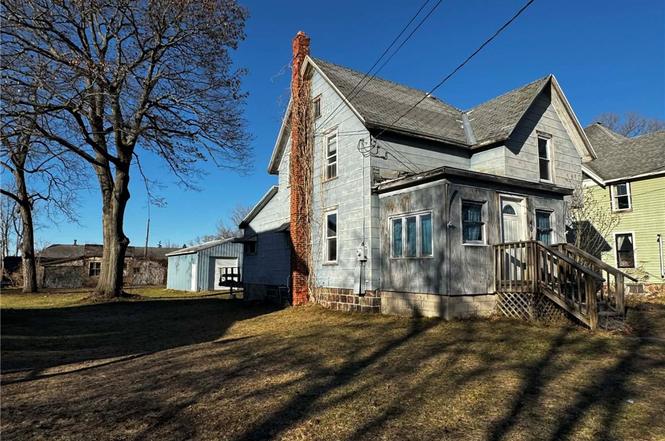
10409 Maple Ave · North Rose, NY
Flood risk 1/10 · Minimal
- FEMA flood zone
- —
- Chance of flooding over 30 yrs
- 0.0%
- Est. flood insurance / yr
- —
Fire risk 2/10 · Minimal
- Est. fire insurance / yr
- $691 – $1,283
Heat risk 2/10 · Minimal
- Hot days now (above 97°F)
- 7 days/yr
- Hot days in 30 yrs
- 15 days/yr
Wind risk 1/10 · Minimal
- Chance of severe wind over 30 yrs
- —
Air-quality risk 2/10 · Minimal
- Unhealthy air days now
- 1 days/yr
- Unhealthy air days in 30 yrs
- 2 days/yr
Risk factors via First Street. Map © Google.
Why this score? — see what drove the B grade
The composite is a weighted blend of 9 inputs, each scored 0–100. Each bar is that input's sub-score; the figure is the points it added to the 100-point composite (weight × sub-score).
- Cash flow +30.0/30.0
- 1% rule +10.0/10.0
- DSCR +10.0/10.0
- ARV discount +7.5/15.0
- Appreciation +5.7/10.0
- Schools +3.5/10.0
- Livability +3.1/5.0
- Rent growth +2.5/5.0
- Condition / age +2.5/5.0
$37,500
🖨 Deal sheet (PDF) 📄 Offer letter ✓ Due diligence
Listing remarks MLS
Oversized 2 car garage with electric sub feed. Picturesque fieldstone fireplace, with fieldstone floor, (Owners haven't used in many years ), some wood floors, . Opportunity to rehabilitate this diamond in the rough! Nice country style neighborhood.
Key facts
- 9,148 sq ft lot
- 4 garage spots
- Built 1900
Property features AI
Exterior
- Parking: Detached garage with electricity and workshop; 4 garage spaces
- Utilities: Water connected (public); Septic tank; Cable available; High-speed internet available
- Home design: 2-story house; Existing construction
- Construction: Wood siding; Asphalt roof; Stone foundation
- Exterior features: Deck; Gravel driveway; Barn(s) / outbuilding
Interior
- Bathrooms: 1 full bathroom
- Heating & cooling: Gas forced-air heating
- Interior features: Entrance foyer; Separate/formal living room; Natural woodwork; Workshop; See remarks / other
- Laundry & utility: Laundry on main level; Gas water heater
Neighborhood map
What this means for you Summary
Snapshot
- This is a 3-bed/1.0-bath single-family listed at $38k.
Deal economics
- At list price, monthly cash flow is $753 ($9k/yr) — positive.
- The deal already cash-flows at list — no discount required.
- Meets the 1% rule at list price ($1k rent vs $38k).
- Recommended offer: $35k (6.0% below list) — sets the bar for market timing.
Location & tenants
- Location reads 61/100 on livability (#904 in NY) — a middle-class / working-renter tenant base. Strengths: cost of living A+, housing B+; Watch: commute D, crime F, amenities F.
- North Rose-Wolcott Central School District (rural): math 43% / reading 38% proficiency, ranked #514 of 590 in NY (top 87%) — families likely to look elsewhere, expect single-tenant / working-renter base with shorter leases.
- Zoned schools: North Rose-Wolcott Elementary School (math 37% / reading 47%, grade F, #1,361 of 2,108 statewide, top 67%, 417 students, 60% FRL); North Rose-Wolcott Middle School (math 29% / reading 32%, grade F, #537 of 729 statewide, top 74%, 343 students, 62% FRL); North Rose-Wolcott High School (math 92% / reading 75%, grade A, #409 of 1,100 statewide, top 39%, 367 students, 57% FRL).
- Market conditions: 12 active listings in the ZIP; 259 units permitted in Wayne County in 2024 (90 in 5+ unit buildings).
Forward outlook
- In year one you build about $782 of equity ($259 loan paydown + $523 appreciation (1.4% local appreciation)).
- Wayne County population projected at -24% by 2050 — secular population decline; favor cash flow + early exit over multi-decade hold.
- At projected returns (1.4% appreciation + 3.0% rent growth), your $10k cash investment doubles in ~2 years — after that, you're playing with house money.
Negotiation context
- It's been on market 62 days — a 6% lower offer ($35k) is reasonable based on typical stale-listing flexibility.
- 2 sale attempts since 13y ago; this cycle's ask has dropped $2k (6%) from the opening price — seller is motivated, your offer sets the floor, not the list.
- Current owner paid $16k; list at $38k implies a 134% gain — meaningful room to come down on a strong offer.
Risks & watch-outs
- Watch-outs: built in 1900 — expect roof / HVAC / electrical / plumbing capex.
Questions for the listing agent
- It's been on market 62 days. Have you received any prior offers? Is the seller open to a 6% concession, seller financing, or rate buy-down credit?
- Built in 1900 — when were the roof, HVAC, electrical panel, plumbing, and water heater last replaced?
- Why hasn't it sold? Are there any deal-killer items the seller is aware of (foundation, flood, title, zoning, code violations)?
- Is there a deadline driving the sale (1031 exchange, divorce, estate, relocation)? That informs how much negotiation room exists.
- Schools are D-rated, which usually means shorter tenancies and higher turnover. Who's the typical renter profile here, and what's been the actual vacancy rate?
- Crime grade is F in this area — have there been break-ins, vandalism, or insurance claims at this property in the last 3 years? What carrier currently insures it and at what premium?
- What's the average days-on-market for RENTAL listings here right now (not sales)? A rising rental-DOM trend means longer vacancies and softer asking-rent achievability than the comps imply.
- What's the recent tenant-quality profile in this submarket — average credit score on applications, eviction rate, late-payment / NSF rate, and stable-employment percentage? A property-management company in the area should have these aggregated.
- How much new for-sale + rental construction is in the pipeline within 1–3 miles? Heavy new supply typically softens prices + rents 12–24 months out; constrained supply supports both.
Investment metrics
- 1% rule
- 3.51% ✓
- Cap rate
- 30.39%
- Cash-on-cash
- 86.07%
- DSCR
- 4.83
- GRM
- 2.4
CMA / ARV
- ARV (on-the-fly)
- $130,424
- Comps found
- 1
Show comp detail 1 sale within ~0.75 mi
| Address | Dist | Beds/Ba | Sqft | Sold | Price | $/sf | Match |
|---|---|---|---|---|---|---|---|
| 4826 State Route 414 | 0.39mi | 2/1.0 (-1) | 832 (-13%) | 16mo | $113,900 | $137 | 43 |
Match score weights: distance 35% · size 25% · config 20% · recency 20%. Top-matched comps best support the ARV.
Projected returns pro-forma
1.39% appreciation · 3.0% rent growth · sell at horizon
- IRR
- 89.4%
- Equity multiple
- 5.71×
- Total profit
- $49,434
- Equity at exit
- $13,577
- IRR
- 89.9%
- Equity multiple
- 11.75×
- Total profit
- $112,914
- Equity at exit
- $18,658
Cash invested: $10,500 (down + closing). Projections, not guarantees.
Landlord ↔ Tenant lean methodology
- Overall (STATE)
- 15 Strongly Tenant-Friendly
- State New York
- 15 Strongly Tenant-Friendly · D+10
- County
- — inherits STATE
- City
- — inherits STATE
ZIP-level market 14516
- Home prices YoY
- 0.6%
- Active inventory
- 12
- Price-to-rent
- 2.4×
Monthly cashflow live
- Estimated rent
- $1,315 medium interval (Pro) →
- Mortgage (P&I)
- −$197
- Tax from tax record
- −$73 /mo · $877/yr
- Insurance
- −$16
- HOA
- −$0
- Vacancy / Maint / Mgmt
- −$276
- Net cashflow
- $753
Break-even live
Sensitivity live
| Price | -10% $774 | -5% $764 | +0% $753 | +5% $743 | +10% $732 |
|---|---|---|---|---|---|
| Rent | -10% $649 | -5% $701 | +0% $753 | +5% $805 | +10% $857 |
| Rate | -1.0pp $772 | -0.5pp $763 | base $753 | +0.5pp $743 | +1.0pp $734 |
UW: 25.0% down · 7.5% · 30yr · 1.5% tax · 5.0% vac · 8.0% maint · 8.0% mgmt
Financing live
Cash to close
- Down payment
- $9,375
- Closing costs
- $1,125
- Reserves months
- —
- Total cash needed
- —
Loan-product check · same deal, 3 products live
Conventional
25% down · 7.5% · 30yr
- Down + closing
- —
- Monthly P&I
- —
- Monthly cashflow
- —
- DSCR
- —
- Eligible?
- —
Personal DTI + credit; lowest rate.
DSCR
20% down · 8.5% · 30yr
- Down + closing
- —
- Monthly P&I
- —
- Monthly cashflow
- —
- DSCR
- —
- Eligible?
- —
No personal income docs; deal must DSCR.
Hard money
10% down · 12.0% · 12mo
- Down + closing
- —
- Monthly P&I
- —
- Monthly cashflow
- —
- DSCR
- —
- Eligible?
- —
Short-term bridge; refi at stabilization.
Listing history 6 events
-
2026-05-12status Pending
-
2026-04-13price $37,500
-
2026-03-11$39,900 Active
-
2013-04-11soldstatus $16,000 249-char remark
Show marketing remark (249 chars)
Oversized 2 car garage with electric sub feed. Picturesque fieldstone fireplace, with fieldstone floor, (Owners haven't used in many years ), some wood floors, . Opportunity to rehabilitate this diamond in the rough! Nice country style neighborhood.
-
2013-01-22$19,900 249-char remark
Show marketing remark (249 chars)
Oversized 2 car garage with electric sub feed. Picturesque fieldstone fireplace, with fieldstone floor, (Owners haven't used in many years ), some wood floors, . Opportunity to rehabilitate this diamond in the rough! Nice country style neighborhood.
-
1999-04-30soldstatus $36,000
ⓘ Source: listings_history table (triggers on properties + properties_extension) + one-shot
backfill from property_details.listing_events for pre-trigger history.
Tax reassessment forecast NY · Partial reset (capped growth)
- Current annual tax
- $877 · $73/mo
- Projected year-2 tax
- $877 · $73/mo
- Expected delta
- $0/yr ($0/mo · 0.0%)
ⓘ Screening estimate from a state-policy table — verify with the county assessor before closing.
Climate risk First Street
- Flood 1/10 Low 0% chance over 30 yrs
- Wildfire 2/10 Low
- Heat 2/10 Low 7 d/yr ≥97°F today · 15 d/yr by 30 yrs out
- Wind 1/10 Low
- Air quality 2/10 Low 1 unhealthy d/yr today · 2 by 30 yrs out
Nearby sold comps map
Loading sold comps map…
Walkable amenities ~0.75 mi
Loading nearby amenities…
Taxation est. · year 1
- Rental income
- $15,774
- − Mortgage interest
- −$2,101
- − Property taxes
- −$877
- − Insurance
- −$188
- − Repairs & maintenance
- −$1,262
- − Management
- −$1,262
- − Depreciation
- −$1,091
- Taxable income
- $8,995
- Est. tax owed @ 24.0%
- −$2,159
- After-tax cash flow
- $6,879/yr
For passive investors: Depreciation is non-cash, so a rental often shows a tax loss while cash-flowing — sheltering income. Rental losses are passive: they offset passive income freely, and up to $25,000/yr can offset ordinary (W-2) income if you actively participate and your MAGI is under $100k (phasing out to $0 by $150k); unused losses carry forward. On sale, claimed depreciation is recaptured at up to 25%, and gains may owe capital-gains tax (a 1031 exchange can defer both). Figures are a year-1 estimate at your 24.0% rate — not tax advice; consult a CPA.
Schools (NCES district)
- District
- North Rose-Wolcott Central School District
- NCES district ID
- 3616980
- Math proficiency
- 43% ▬ 0.00%
- Reading proficiency
- 38% ▲ 3.00%
- Median HH income
- $47,545
- Composite
- 34.7/100
- National rank
- #5140
- State rank
- #514 of 590 in NY
Livability — North Rose
- Score
- 61/100
- State rank
- #904
- US rank
- #17636
Category grades
Schools grade is shown separately in the Schools card above.
Census & demographics
- Census place
- North Rose, NY
- Population (ZIP)
- 2,184
Population outlook (Wayne County) Hauer SSP2
- Today (2025)
- 85,662 people
- By 2030
- 81,945 · -4.3%
- By 2040
- 73,735 · -13.9%
- By 2050
- 65,029 · -24.1%
- By 2075
- 47,451 · -44.6%
- By 2100
- 31,574 · -63.1%
Race, ethnicity, and origin ACS 2023
- Neighborhood character
- Predominantly White (88%)
- Race & ethnicity
- White 88% Black 7% Asian 2% Hispanic / Latino 2% Two or more races 1%
- Common ancestry
- Iranian 8% Italian 2% Serbian 2%
- Foreign-born
- 3% · China, Canada
- Languages at home
- 96% English-only · Spanish 2% German/W. Germanic 2%
Political lean MEDSL · Wayne
- 2024 margin
- Strong R (+23.1) · D 38.5% · R 61.5%
- 2008→2024 swing
- -13.2pp toward R · 2008: -9.9pp · 2024: -23.1pp
- All cycles
- 2024: R+23.1 2020: R+19.6 2016: R+26.1 2012: R+9.3 2008: R+9.9
Not yet ingested
- Civics
- —
Market trends
- HPI YoY
- ▲ 1.39%
- Current HPI
- 217.5757
- Rent YoY
- —
- Metro
- —
- State GDP YoY
- ▲ 2.60%
- F500 in state
- 92
Industry mix (Fortune 500 HQ in NY)
| Industry | F500 HQs | Revenue |
|---|---|---|
| Financial Services | 10 | $950B |
|
||
| Consumer Goods | 9 | $162B |
|
||
| Insurance | 4 | $225B |
|
||
| Telecommunications | 2 | $144B |
|
||
| Pharmaceuticals | 2 | $112B |
|
||
| Media / Entertainment | 2 | $69B |
|
||
Price history
+4.2% since first listed6 events — show timeline
- 2026-05-12 Pending — UNYREIS
- 2026-04-13 Price Changed $37,500 UNYREIS
- 2026-03-11 Listed $39,900 UNYREIS
- 2013-04-11 Sold (MLS) $16,000 UNYREIS
- 2013-01-22 Listed $19,900 UNYREIS
- 1999-04-30 Sold (Public Records) $36,000 Public Records
Property tax history
-6.4%/yrLatest (2025): $877 · +15.8% YoY. Source: county tax records.
Cash-flow waterfall
monthlySold comps — $/sqft
last 12 mo · ≤1 miLoading sold comps…