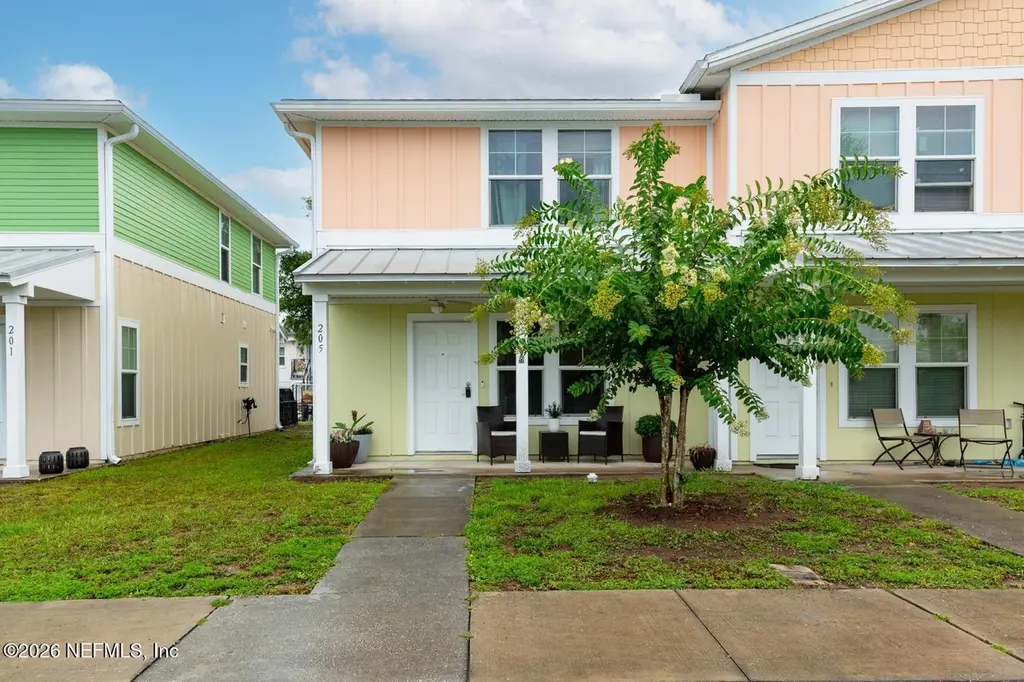
205 Oceangate Dr · Atlantic Beach, FL
Flood risk 3/10 · Minor
- FEMA flood zone
- X (unshaded)
- Chance of flooding over 30 yrs
- 0.12%
- Est. flood insurance / yr
- $507 – $1,088
Fire risk 4/10 · Minor
- Est. fire insurance / yr
- $947 – $1,759
Heat risk 10/10 · Severe
- Hot days now (above 104°F)
- 7 days/yr
- Hot days in 30 yrs
- 21 days/yr
Wind risk 10/10 · Severe
- Chance of severe wind over 30 yrs
- 99.0%
Air-quality risk 4/10 · Minor
- Unhealthy air days now
- 4 days/yr
- Unhealthy air days in 30 yrs
- 7 days/yr
Risk factors via First Street. Map © Google.
Why this score? — see what drove the D grade
The composite is a weighted blend of 9 inputs, each scored 0–100. Each bar is that input's sub-score; the figure is the points it added to the 100-point composite (weight × sub-score).
- ARV discount +12.5/15.0
- Cash flow +11.7/30.0
- Schools +3.9/10.0
- Livability +3.6/5.0
- Rent growth +3.5/5.0
- DSCR +3.4/10.0
- 1% rule +2.9/10.0
- Condition / age +2.5/5.0
- Appreciation +0.0/10.0
$315,000
🖨 Deal sheet 📄 Offer letter ✓ Due diligence
Listing remarks
looking to live at the beach . .. this beautifully maintained home might be your answer! updated kitchen with almost new appliances and counters - LVP flooring and special touches everywhere. This home is freshly painted & you can see the care and pride of ownership here! all bedrooms (and laundry) upstairs, kitchen and living space below - and two designated parking spaces. Stop by today - and WELCOME HOME!
Key facts
- $125 HOA
- Built 2016
- Listed 7 days
Property features AI
Finance
- HOA & community: Has association; Association fee $125 monthly
Exterior
- Parking: Additional parking available; Assigned parking
- Utilities: Cable available; Electricity connected; Sewer connected; Water connected
- Home design: Attached property; Townhouse; Used as multi-family and residential
- Exterior features: Covered patio; Front porch; Patio; City street frontage; Asphalt road
Interior
- Kitchen: Dishwasher; Double oven; Electric oven; Electric range; Microwave; Refrigerator
- Bedrooms: 3 bedrooms
- Flooring: Carpet; Laminate
- Bathrooms: 2 full bathrooms
- Heating & cooling: Central heating; Central air (electric)
- Interior features: Breakfast bar; Ceiling fan(s); Pantry
- Laundry & utility: Stacked washer/dryer; Laundry on upper level; Electric water heater
Neighborhood map
What this means for you Summary
Snapshot
- This is a 3-bed/2.0-bath townhouse listed at $315k.
Deal economics
- At list price, monthly cash flow is $-94 ($-1k/yr) — negative.
- To cash-flow at today's rent, offer at most $298k (5.3% below list).
- To meet the 1% rule (rent ≥ 1% of price), the offer needs to be $248k (21.4% below list).
- Recommended offer: $248k (21.4% below list) — sets the bar for 1% rule.
- Cap rate 5.9% vs local median 1.3% in Atlantic Beach — top-decile yield for the area; either an underpriced asset or a hidden risk that comps aren't pricing in. Stress-test before assuming the spread holds.
Location & tenants
- Location reads 71/100 on livability (#409 in FL) — a middle-class / working-renter tenant base. Strengths: employment A+, housing A+, schools B+; Watch: amenities F, commute F, cost of living F.
- Duval (urban): math 46% / reading 45% proficiency, ranked #48 of 73 in FL (top 66%) — families likely to look elsewhere, expect single-tenant / working-renter base with shorter leases.
- Market conditions: Rents rising fast (+4.2%/yr); 125 active listings in the ZIP; 28 comparable units currently listed for rent nearby; rentals at typical pace (median 15d on market — plan ~3-4 weeks tenant-placement turnaround); solid renter incomes; 6,503 units permitted in Duval County in 2024 (1,131 in 5+ unit buildings).
- This rent runs 33% of the median local income ($89k/yr) — at the standard rent-burdened threshold; future hikes will face affordability resistance.
Forward outlook
- Local home prices are declining (-3.0%/yr); year-one equity from $2k of loan paydown is wiped out by about $9k of value loss. Plan a longer hold.
- Duval County population projected at +19% by 2050 — long-run rental-demand tailwind backs the buy-and-hold thesis.
Negotiation context
- Only 7 days on market — expect competitive offers; lowballing is unlikely to land.
Risks & watch-outs
- Climate carrying-cost: severe wind risk, 99% chance of damaging wind over 30y; extreme-heat days projected 7→21/yr by 2055 (HVAC capex compounding) — expect insurance premiums to compound above CPI over the hold.
Questions for the listing agent
- What do current leases actually rent for vs. the listed asking? Can we see a recent rent roll and the last 12 months of T-12 income?
- What does the HOA fee cover, when was the last increase, and are there any pending special assessments or reserve-fund shortfalls?
- Is there a deadline driving the sale (1031 exchange, divorce, estate, relocation)? That informs how much negotiation room exists.
- Schools are B-rated — typically a magnet for longer-tenancy family renters. What's the average tenant stay here, and is there a school-zone premium baked into asking?
- The area grade is low — what's the realistic commute time and amenity access for the typical tenant pool here? Any planned neighborhood developments (good or bad) we should know about?
- What's the average days-on-market for RENTAL listings here right now (not sales)? A rising rental-DOM trend means longer vacancies and softer asking-rent achievability than the comps imply.
- What's the recent tenant-quality profile in this submarket — average credit score on applications, eviction rate, late-payment / NSF rate, and stable-employment percentage? A property-management company in the area should have these aggregated.
- How much new for-sale + rental construction is in the pipeline within 1–3 miles? Heavy new supply typically softens prices + rents 12–24 months out; constrained supply supports both.
Investment metrics
- 1% rule
- 0.79% ✗
- Cap rate
- 5.94%
- Cash-on-cash
- -1.28%
- DSCR
- 0.94
- GRM
- 10.6
CMA / ARV
- ARV (on-the-fly)
- $354,192
- Comps found
- 12
Show comp detail 12 sales within ~0.75 mi
| Address | Dist | Beds/Ba | Sqft | Sold | Price | $/sf | Match |
|---|---|---|---|---|---|---|---|
| 101 Oceangate Dr | 0.11mi | 3/2.0 | 1,256 (0%) | 2mo | $292,000 | $232 | 93 |
| 1110 Scheidel Ct | 0.11mi | 3/2.0 | 1,300 (+4%) | 1mo | $342,275 | $263 | 88 |
| 181 Oceangate Dr | 0.03mi | 3/2.0 | 1,424 (+13%) | 2mo | $265,000 | $186 | 75 |
| 756 Aquatic Dr | 0.29mi | 3/2.0 | 1,328 (+6%) | 7mo | $360,000 | $271 | 71 |
| 800 Stocks St | 0.40mi | 3/2.0 | 1,320 (+5%) | 4mo | $270,000 | $205 | 69 |
| 702 Aquatic Dr | 0.33mi | 3/2.0 | 1,328 (+6%) | 9mo | $450,000 | $339 | 68 |
| 567 Aquatic Dr | 0.33mi | 3/2.0 | 1,328 (+6%) | 9mo | $375,000 | $282 | 68 |
| 606 Aquatic Dr | 0.40mi | 3/2.0 | 1,218 (-3%) | 14mo | $382,500 | $314 | 65 |
| 375 Aquatic Dr | 0.27mi | 3/2.0 | 1,328 (+6%) | 17mo | $405,000 | $305 | 64 |
| 320 Sunrise Cir | 0.28mi | 2/2.5 (-1) | 1,384 (+10%) | 3mo | $415,000 | $300 | 61 |
| 836 Cavalla Rd | 0.33mi | 2/1.5 (-1) | 1,128 (-10%) | 0mo | $291,000 | $258 | 60 |
| 570 Aquatic Dr | 0.39mi | 3/2.0 | 1,440 (+15%) | 2mo | $455,000 | $316 | 56 |
Match score weights: distance 35% · size 25% · config 20% · recency 20%. Top-matched comps best support the ARV.
Projected returns pro-forma
-3.0% appreciation · 4.18% rent growth · sell at horizon
- IRR
- -17.2%
- Equity multiple
- 0.39×
- Total profit
- $-54,091
- Equity at exit
- $46,968
- IRR
- -7.2%
- Equity multiple
- 0.52×
- Total profit
- $-42,461
- Equity at exit
- $27,235
Cash invested: $88,200 (down + closing). Projections, not guarantees.
Landlord ↔ Tenant lean methodology
- Overall (STATE)
- 87 Strongly Landlord-Friendly
- State Florida
- 87 Strongly Landlord-Friendly · R+3
- County
- — inherits STATE
- City
- — inherits STATE
ZIP-level market 32233
- Rents YoY
- 4.2%
- Active inventory
- 125
- Price-to-rent
- 10.6×
Monthly cashflow live
- Estimated rent
- $2,477 high interval (Pro) →
- Mortgage (P&I)
- −$1,652
- Tax from tax record
- −$143 /mo · $1,713/yr
- Insurance
- −$131
- HOA
- −$125
- Vacancy / Maint / Mgmt
- −$520
- Net cashflow
- $-94
Break-even live
UW: 25.0% down · 7.5% · 30yr · 1.5% tax · 5.0% vac · 8.0% maint · 8.0% mgmt
Financing live
Cash to close
- Down payment
- $78,750
- Closing costs
- $9,450
- Reserves months
- —
- Total cash needed
- —
Loan-product check · same deal, 3 products live
Conventional
25% down · 7.5% · 30yr
- Down + closing
- —
- Monthly P&I
- —
- Monthly cashflow
- —
- DSCR
- —
- Eligible?
- —
Personal DTI + credit; lowest rate.
DSCR
20% down · 8.5% · 30yr
- Down + closing
- —
- Monthly P&I
- —
- Monthly cashflow
- —
- DSCR
- —
- Eligible?
- —
No personal income docs; deal must DSCR.
Hard money
10% down · 12.0% · 12mo
- Down + closing
- —
- Monthly P&I
- —
- Monthly cashflow
- —
- DSCR
- —
- Eligible?
- —
Short-term bridge; refi at stabilization.
Rent comps 28 comps
| Address | Beds | Baths | Sqft | Rent | $/sqft | DOM | Units | Dist |
|---|---|---|---|---|---|---|---|---|
| 1085 Atlantic Blvd Atlantic Beach, FL | 1.0–4.0 | 1.0–2.0 | 886 | $1,598 | $1.80 | 23d | 1 | 0.03mi |
| 450 Aquatic Dr Atlantic Beach, FL | 3.0 | 2.0 | 1256 | $2,800 | $2.23 | 1d | 1 | 0.28mi |
| 760 Triton Rd Atlantic Beach, FL | 3.0 | 1.5 | 975 | $2,400 | $2.46 | 23d | 1 | 0.49mi |
| 1115 Main St Atlantic Beach, FL | 4.0 | 2.0 | 1480 | $3,000 | $2.03 | 23d | 1 | 0.57mi |
| 66 W 14th St Atlantic Beach, FL | 3.0 | 2.5 | 1332 | $2,750 | $2.06 | 4d | 1 | 0.59mi |
| 826 Amberjack Ln Atlantic Beach, FL | 3.0 | 2.0 | 975 | $1,800 | $1.85 | 14d | 1 | 0.63mi |
| 826 Amberjack Ln Atlantic Beach, FL | 3.0 | 2.0 | 975 | $1,800 | $1.85 | 7d | 1 | 0.63mi |
| 516 Penman Rd Neptune Beach, FL | 3.0 | 2.0 | 1853 | $2,900 | $1.57 | 14d | 1 | 0.63mi |
| 707 Amberjack Ln Atlantic Beach, FL | 4.0 | 2.0 | 1765 | $3,750 | $2.12 | 14d | 1 | 0.73mi |
| 900 Plaza Atlantic Beach, FL | 1.0–3.0 | 1.0–2.0 | 911 | $2,100 | $2.30 | 3d | 17 | 0.78mi |
| 70 Robert St Atlantic Beach, FL | 2.0 | 2.0 | 990 | $2,400 | $2.42 | 17d | 1 | 0.84mi |
| 622 Valley Forge Rd N Neptune Beach, FL | 3.0 | 2.0 | 1680 | $3,100 | $1.85 | 21d | 1 | 0.97mi |
| 1927 Main St Atlantic Beach, FL | 3.0 | 2.5 | 1428 | $2,250 | $1.58 | 20d | 1 | 0.98mi |
| 1984 Mary St Atlantic Beach, FL | 3.0 | 2.5 | 1244 | $1,800 | $1.45 | 4d | 1 | 1.01mi |
| 361 Ahern St #15 Atlantic Beach, FL | 3.0 | 3.0 | 1414 | $4,000 | $2.83 | 7d | 1 | 1.10mi |
| 2130 Mayport Rd Jacksonville, FL | 1.0–3.0 | 1.0–2.0 | 984 | $2,039 | $2.07 | 1d | 21 | 1.11mi |
| 2077 Dutton Island Oaks Way Atlantic Beach, FL | 4.0 | 2.5 | 1866 | $2,849 | $1.53 | 1d | 1 | 1.13mi |
| 2160 Mayport Rd Jacksonville, FL | 1.0–3.0 | 1.0–2.0 | 949 | $2,012 | $2.12 | 2d | 10 | 1.24mi |
| 223 Orange St Neptune Beach, FL | 2.0 | 2.0 | 1333 | $3,000 | $2.25 | 14d | 1 | 1.25mi |
| 1365 Seminole Rd Atlantic Beach, FL | 3.0 | 2.0 | 1268 | $3,400 | $2.68 | 4d | 1 | 1.29mi |
| 2137 Featherwood Dr W Jacksonville, FL | 4.0 | 2.0 | 1555 | $2,421 | $1.56 | 3d | 1 | 1.30mi |
| 200 Walnut St Neptune Beach, FL | 2.0 | 2.0 | 900 | $3,250 | $3.61 | 14d | 1 | 1.30mi |
| 701 Beach Ave #203 Atlantic Beach, FL | 2.0 | 2.0 | 1559 | $5,985 | $3.84 | 23d | 1 | 1.32mi |
| 901 Ocean Blvd #39 Atlantic Beach, FL | 3.0 | 2.0 | 1122 | $3,950 | $3.52 | 16d | 1 | 1.34mi |
| 1100 Seagate Ave Neptune Beach, FL | 1.0–2.0 | 1.0–2.0 | 750 | $2,200 | $2.93 | 23d | 1 | 1.38mi |
| 10 10th St Atlantic Beach, FL | 3.0 | 2.0 | 1654 | $4,250 | $2.57 | 21d | 1 | 1.38mi |
| 13846 Atlantic Blvd #817 Jacksonville, FL | 3.0 | 3.5 | 1690 | $3,600 | $2.13 | 23d | 1 | 1.43mi |
| 2610 State Rd Atlantic Beach, FL | 1.0–3.0 | 1.0–2.0 | 811 | $1,783 | $2.20 | 1d | 25 | 1.45mi |
HOA detail
- Monthly dues
- $125 · $1,500/yr
Listing history 7 events
-
2026-06-18days on market $315,000 Active 7 DOM
-
2026-06-17days on market $315,000 Active 6 DOM
-
2026-06-16days on market $315,000 Active 5 DOM
-
2026-06-15days on market $315,000 Active 4 DOM
-
2026-06-13days on market $315,000 Active 2 DOM
-
2026-06-13remarks 418-char remark
-
2026-06-13$315,000 Active 1 DOM
ⓘ Source: listings_history table (triggers on properties + properties_extension) + one-shot
backfill from property_details.listing_events for pre-trigger history.
Tax reassessment forecast FL · Resets to sale price
- Current annual tax
- $1,713 · $143/mo
- Projected year-2 tax
- $2,614 · $218/mo
- Expected delta
- +$901/yr (+$75/mo · 52.6%)
ⓘ Screening estimate from a state-policy table — verify with the county assessor before closing.
Climate risk First Street
- Flood 3/10 Moderate FEMA zone X (unshaded) · 12% chance over 30 yrs
- Wildfire 4/10 Moderate
- Heat 10/10 Extreme 7 d/yr ≥104°F today · 21 d/yr by 30 yrs out
- Wind 10/10 Extreme 99% chance of damaging wind over 30 yrs
- Air quality 4/10 Moderate 4 unhealthy d/yr today · 7 by 30 yrs out
Nearby sold comps map
Loading sold comps map…
Walkable amenities ~0.75 mi
Loading nearby amenities…
Taxation est. · year 1
- Rental income
- $29,726
- − Mortgage interest
- −$17,645
- − Property taxes
- −$1,713
- − Insurance
- −$1,575
- − Repairs & maintenance
- −$2,378
- − Management
- −$2,378
- − HOA
- −$1,500
- − Depreciation
- −$9,164
- Taxable loss
- −$6,627
- Est. tax savings @ 24.0%
- +$1,590
- After-tax cash flow
- $463/yr
For passive investors: Depreciation is non-cash, so a rental often shows a tax loss while cash-flowing — sheltering income. Rental losses are passive: they offset passive income freely, and up to $25,000/yr can offset ordinary (W-2) income if you actively participate and your MAGI is under $100k (phasing out to $0 by $150k); unused losses carry forward. On sale, claimed depreciation is recaptured at up to 25%, and gains may owe capital-gains tax (a 1031 exchange can defer both). Figures are a year-1 estimate at your 24.0% rate — not tax advice; consult a CPA.
Schools (NCES district)
- District
- Duval
- NCES district ID
- 1200480
- Math proficiency
- 46% ▼ -11.00%
- Reading proficiency
- 45% ▼ -4.00%
- Median HH income
- $48,987
- Composite
- 38.97/100
- National rank
- #4076
- State rank
- #48 of 73 in FL
Livability — Atlantic Beach
- Score
- 71/100
- State rank
- #409
- US rank
- #7277
Category grades
Schools grade is shown separately in the Schools card above.
Census & demographics
- Census place
- Atlantic Beach, FL
- County
- Duval County · 1,015,274 people
- Metro
- Jacksonville, FL
- Population (ZIP)
- 24,633
- Household income
- $89,185
- Rent vs Own
- Severe rent burden
- 879.0
Population outlook (Duval County) Hauer SSP2
- Today (2025)
- 1,013,010 people
- By 2030
- 1,059,228 · +4.6%
- By 2040
- 1,141,439 · +12.7%
- By 2050
- 1,205,258 · +19.0%
- By 2075
- 1,324,282 · +30.7%
- By 2100
- 1,319,620 · +30.3%
Race, ethnicity, and origin ACS 2023
- Neighborhood character
- Predominantly White (73%)
- Race & ethnicity
- White 73% Two or more races 10% Hispanic / Latino 9% Black 8% Asian 3%
- Hispanic origin (detail)
- Mexican 2% Puerto Rican 2% Cuban 1%
- Common ancestry
- Italian 4% Lithuanian 2% Slovak 2%
- Foreign-born
- 8% · Canada, Jamaica, China
- Languages at home
- 92% English-only · Spanish 5% Tagalog/Filipino 1% Other Indo-European 1%
Political lean MEDSL · Duval
- 2024 margin
- Toss-up / Even · D 48.7% · R 50.1% · Other 1.2%
- 2008→2024 swing
- +0.4pp no change · 2008: -1.9pp · 2024: -1.5pp
- All cycles
- 2024: R+1.5 2020: D+3.8 2016: R+1.5 2012: R+3.6 2008: R+1.9
Not yet ingested
- Civics
- —
Market trends
- HPI YoY
- ▼ -560.12%
- Current HPI
- 347.9004
- Rent YoY
- ▲ 4.18%
- Metro
- Jacksonville, FL
- State GDP YoY
- ▲ 3.28%
- F500 in state
- 36
Industry mix (Fortune 500 HQ in FL)
| Industry | F500 HQs | Revenue |
|---|---|---|
| Industrial Technology | 2 | $29B |
|
||
| Insurance | 2 | $17B |
|
||
| Retail | 1 | $60B |
|
||
| Technology Distribution | 1 | $58B |
|
||
| Homebuilding | 1 | $35B |
|
||
| Technology Manufacturing | 1 | $35B |
|
||
Price history
1 event — show timeline
- 2026-06-11 Listed $315,000 realMLS
Property tax history
+2.8%/yrLatest (2025): $1,713 · +2.5% YoY. Source: county tax records.
Cash-flow waterfall
monthlySold comps — $/sqft
last 12 mo · ≤1 miLoading sold comps…