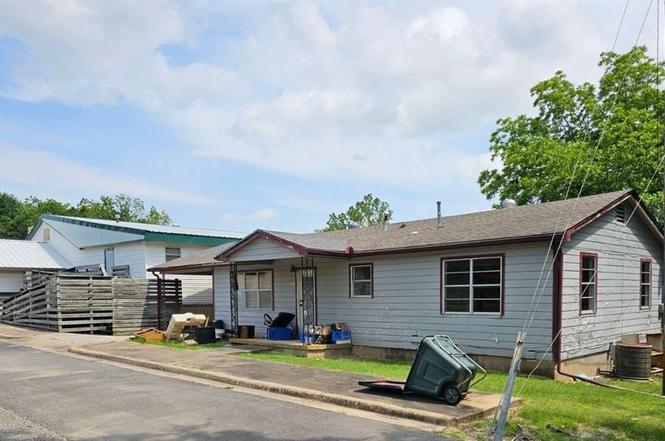
1303 W Muskogee Ave · Sulphur, OK
Flood risk 1/10 · Minimal
- FEMA flood zone
- X (unshaded)
- Chance of flooding over 30 yrs
- 0.0%
- Est. flood insurance / yr
- $507 – $1,088
Fire risk 7/10 · Major
- Est. fire insurance / yr
- $2,463 – $4,575
Heat risk 6/10 · Moderate
- Hot days now (above 108°F)
- 7 days/yr
- Hot days in 30 yrs
- 19 days/yr
Wind risk 3/10 · Minor
- Chance of severe wind over 30 yrs
- 9.0%
Air-quality risk 2/10 · Minimal
- Unhealthy air days now
- 1 days/yr
- Unhealthy air days in 30 yrs
- 1 days/yr
Risk factors via First Street. Map © Google.
Why this score? — see what drove the B+ grade
The composite is a weighted blend of 9 inputs, each scored 0–100. Each bar is that input's sub-score; the figure is the points it added to the 100-point composite (weight × sub-score).
- Cash flow +30.0/30.0
- 1% rule +10.0/10.0
- DSCR +10.0/10.0
- Appreciation +8.0/10.0
- ARV discount +7.5/15.0
- Livability +3.4/5.0
- Schools +2.6/10.0
- Rent growth +2.5/5.0
- Condition / age +2.5/5.0
$50,000
🖨 Deal sheet 📄 Offer letter ✓ Due diligence
Listing remarks
Just minutes from the Sulphur's most iconic attractions, this unique property offers location, charm and opportunity. Situated near the Artesian Hotel and Little Niagara Falls this 3 bed 1 bath parsonage features 1056 sq ft and is ready for an owner occupant with vision. The home is in need of some TLC providing the perfect canvas to restore character, updated finishes in one of Sulphur's most desirable areas. Close to dining, shopping and recreation that offers convenience. This property is being sold in conjunction with MLS#1213265 and will not be sold separately. Whether you're looking to live nearby your business, explore redevelopment potential this the opportunity for you!
Key facts
- Close to recreation
- Close to dining
- Near artesian hotel
Tags
Property features AI
Finance
- Other: Located in Sulphur addition; Property is occupied; Directions: Take I-35 to Exit 51 (Hwy 7) toward Sulphur. Head east on Hwy 7 into Sulphur. Left on Broadway Ave, Left on W Muskogee Ave. Property on south side.
- Financial info: Loan qualifying allowed; Not assumable
- HOA & community: No mandatory association dues
Exterior
- Utilities: Homestead exemption claimed
- Home design: Single family residence; One-story home; Existing property
- Construction: Frame construction; Composition roof; Slab foundation; Built status: existing
- Exterior features: No notable exterior features listed; Lot described as Other
Interior
- Bedrooms: 3 bedrooms
- Bathrooms: 1 full bathroom
- Heating & cooling: Central gas heating; Central gas cooling
- Interior features: One living area; Fireplace (Other)
Neighborhood map
What this means for you Summary
Snapshot
- This is a 2-bed/1.0-bath single-family listed at $50k.
Deal economics
- At list price, monthly cash flow is $438 ($5k/yr) — positive.
- The deal already cash-flows at list — no discount required.
- Meets the 1% rule at list price ($945 rent vs $50k).
- Recommended offer: $44k (12.0% below list) — sets the bar for market timing.
- Cap rate 16.8% vs local median 3.4% in Sulphur — top-decile yield for the area; either an underpriced asset or a hidden risk that comps aren't pricing in. Stress-test before assuming the spread holds.
Location & tenants
- Location reads 68/100 on livability (#60 in OK) — a middle-class / working-renter tenant base. Strengths: cost of living A+, housing A+, crime B+; Watch: employment C-, amenities F, commute F.
- Sulphur (town): math 30% / reading 32% proficiency, ranked #56 of 270 in OK (top 21%) — families likely to look elsewhere, expect single-tenant / working-renter base with shorter leases.
- Zoned schools: Sulphur Es (419 students, 0% FRL); Sulphur Hs (math 32% / reading 32%, grade F, #67 of 447 statewide, top 16%, 436 students, 0% FRL) — zoned schools average 0% FRL vs 50% district-wide (50 pts lower); this property's tenant base skews higher-income than the district average.
- Market conditions: 147 active listings in the ZIP; 20 units permitted in Murray County in 2024 (0 in 5+ unit buildings).
Forward outlook
- In year one you build about $3k of equity ($346 loan paydown + $3k appreciation (5.9% local appreciation)).
- Murray County population projected at +16% by 2050 — long-run rental-demand tailwind backs the buy-and-hold thesis.
- At projected returns (5.9% appreciation + 3.0% rent growth), your $14k cash investment doubles in ~2 years — after that, you're playing with house money.
- By year 10, paydown + projected appreciation supports a ~$34k cash-out refi (75% LTV) — recoverable capital for the next deal without selling this one.
Negotiation context
- It's been on market 133 days — a 12% lower offer ($44k) is reasonable based on typical stale-listing flexibility.
- 6 sale attempts since 10y ago with the ask held roughly flat each time — persistent listings suggest the price (not the market) is what's stuck; bring a comps-based counter.
Risks & watch-outs
- Climate carrying-cost: major wildfire risk; extreme-heat days projected 7→19/yr by 2055 (HVAC capex compounding) — expect insurance premiums to compound above CPI over the hold.
Questions for the listing agent
- It's been on market 133 days. Have you received any prior offers? Is the seller open to a 12% concession, seller financing, or rate buy-down credit?
- Built in 1970 — when were the roof, HVAC, electrical panel, plumbing, and water heater last replaced?
- Why hasn't it sold? Are there any deal-killer items the seller is aware of (foundation, flood, title, zoning, code violations)?
- Is there a deadline driving the sale (1031 exchange, divorce, estate, relocation)? That informs how much negotiation room exists.
- Schools are D-rated, which usually means shorter tenancies and higher turnover. Who's the typical renter profile here, and what's been the actual vacancy rate?
- What's the average days-on-market for RENTAL listings here right now (not sales)? A rising rental-DOM trend means longer vacancies and softer asking-rent achievability than the comps imply.
- What's the recent tenant-quality profile in this submarket — average credit score on applications, eviction rate, late-payment / NSF rate, and stable-employment percentage? A property-management company in the area should have these aggregated.
- How much new for-sale + rental construction is in the pipeline within 1–3 miles? Heavy new supply typically softens prices + rents 12–24 months out; constrained supply supports both.
Investment metrics
- 1% rule
- 1.89% ✓
- Cap rate
- 16.80%
- Cash-on-cash
- 37.54%
- DSCR
- 2.67
- GRM
- 4.4
CMA / ARV
- ARV (on-the-fly)
- $133,056
- Comps found
- 11
Show comp detail 11 sales within ~0.75 mi
| Address | Dist | Beds/Ba | Sqft | Sold | Price | $/sf | Match |
|---|---|---|---|---|---|---|---|
| 1113 W 11th St | 0.24mi | 2/1.0 | 1,060 (+0%) | 7mo | $81,370 | $77 | 82 |
| 1412 W Vinita | 0.13mi | 2/1.0 | 1,120 (+6%) | 5mo | $100,000 | $89 | 80 |
| 1514 W Mcalester | 0.33mi | 3/1.0 (+1) | 1,092 (+3%) | 4mo | $130,000 | $119 | 70 |
| 1122 W 15th St | 0.18mi | 3/1.0 (+1) | 1,144 (+8%) | 12mo | $169,000 | $148 | 63 |
| 1320 W Oklahoma | 0.24mi | 3/1.0 (+1) | 1,152 (+9%) | 12mo | $96,250 | $84 | 59 |
| 1306 W Atoka Ave | 0.48mi | 2/1.0 | 1,055 (-0%) | 23mo | $175,000 | $166 | 58 |
| 1306 W 17th | 0.41mi | 3/2.0 (+1) | 1,090 (+3%) | 18mo | $137,000 | $126 | 51 |
| 1402 W 10th | 0.42mi | 3/1.0 (+1) | 1,194 (+13%) | 3mo | $171,000 | $143 | 51 |
| 1120 W 9th St | 0.35mi | 2/2.0 | 972 (-8%) | 20mo | $109,500 | $113 | 49 |
| 710 W Tahlequah | 0.52mi | 2/1.0 | 918 (-13%) | 5mo | $130,000 | $142 | 49 |
| 917 Fairway | 0.53mi | 3/2.0 (+1) | 1,120 (+6%) | 9mo | $175,000 | $156 | 49 |
Match score weights: distance 35% · size 25% · config 20% · recency 20%. Top-matched comps best support the ARV.
Projected returns pro-forma
5.9% appreciation · 3.0% rent growth · sell at horizon
- IRR
- 47.4%
- Equity multiple
- 4.00×
- Total profit
- $42,026
- Equity at exit
- $31,119
- IRR
- 44.4%
- Equity multiple
- 8.27×
- Total profit
- $101,840
- Equity at exit
- $56,166
Cash invested: $14,000 (down + closing). Projections, not guarantees.
Landlord ↔ Tenant lean methodology
- Overall (STATE)
- 83 Strongly Landlord-Friendly
- State Oklahoma
- 83 Strongly Landlord-Friendly · R+20
- County
- — inherits STATE
- City
- — inherits STATE
ZIP-level market 73086
- Home prices YoY
- 1.8%
- Active inventory
- 147
- Price-to-rent
- 4.4×
Monthly cashflow live
- Estimated rent
- $945 medium interval (Pro) →
- Mortgage (P&I)
- −$262
- Tax from tax record
- −$26 /mo · $311/yr
- Insurance
- −$21
- HOA
- −$0
- Vacancy / Maint / Mgmt
- −$199
- Net cashflow
- $438
Break-even live
UW: 25.0% down · 7.5% · 30yr · 1.5% tax · 5.0% vac · 8.0% maint · 8.0% mgmt
Financing live
Cash to close
- Down payment
- $12,500
- Closing costs
- $1,500
- Reserves months
- —
- Total cash needed
- —
Loan-product check · same deal, 3 products live
Conventional
25% down · 7.5% · 30yr
- Down + closing
- —
- Monthly P&I
- —
- Monthly cashflow
- —
- DSCR
- —
- Eligible?
- —
Personal DTI + credit; lowest rate.
DSCR
20% down · 8.5% · 30yr
- Down + closing
- —
- Monthly P&I
- —
- Monthly cashflow
- —
- DSCR
- —
- Eligible?
- —
No personal income docs; deal must DSCR.
Hard money
10% down · 12.0% · 12mo
- Down + closing
- —
- Monthly P&I
- —
- Monthly cashflow
- —
- DSCR
- —
- Eligible?
- —
Short-term bridge; refi at stabilization.
Listing history 28 events
-
2026-06-19days on market $50,000 Active 133 DOM
-
2026-06-18days on market $50,000 Active 132 DOM
-
2026-06-17days on market $50,000 Active 131 DOM
-
2026-06-16days on market $50,000 Active 130 DOM
-
2026-06-15days on market $50,000 Active 129 DOM
-
2026-06-14days on market $50,000 Active 127 DOM
-
2026-06-12days on market $50,000 Active 126 DOM
-
2026-06-09days on market $50,000 Active 123 DOM
-
2026-06-08days on market $50,000 Active 122 DOM
-
2026-06-07days on market $50,000 Active 121 DOM
-
2026-06-03days on market $50,000 Active 117 DOM
-
2026-06-02days on market $50,000 Active 116 DOM
-
2026-06-01days on market $50,000 Active 115 DOM
-
2026-05-31days on market $50,000 Active 114 DOM
-
2026-05-30days on market $50,000 Active 113 DOM
-
2026-02-06$50,000 Active
-
2025-12-31historical
-
2025-06-06$50,000 Active
-
2025-05-07historical
-
2024-11-13$50,000 Active
-
2021-07-28historical
-
2021-06-17price $275,000
-
2020-11-09$215,000 Active
-
2018-01-09historical
-
2017-06-22$65,000
-
2017-04-12historical
-
2016-05-12$65,000
-
2000-05-12soldstatus $54,000
ⓘ Source: listings_history table (triggers on properties + properties_extension) + one-shot
backfill from property_details.listing_events for pre-trigger history.
Tax reassessment forecast OK · Resets to sale price
- Current annual tax
- $311 · $26/mo
- Projected year-2 tax
- $450 · $37/mo
- Expected delta
- +$139/yr (+$12/mo · 44.7%)
ⓘ Screening estimate from a state-policy table — verify with the county assessor before closing.
Climate risk First Street
- Flood 1/10 Low FEMA zone X (unshaded) · 0% chance over 30 yrs
- Wildfire 7/10 Severe
- Heat 6/10 Major 7 d/yr ≥108°F today · 19 d/yr by 30 yrs out
- Wind 3/10 Moderate 9% chance of damaging wind over 30 yrs
- Air quality 2/10 Low 1 unhealthy d/yr today · 1 by 30 yrs out
Nearby sold comps map
Loading sold comps map…
Walkable amenities ~0.75 mi
Loading nearby amenities…
Taxation est. · year 1
- Rental income
- $11,345
- − Mortgage interest
- −$2,801
- − Property taxes
- −$311
- − Insurance
- −$250
- − Repairs & maintenance
- −$908
- − Management
- −$908
- − Depreciation
- −$1,455
- Taxable income
- $4,714
- Est. tax owed @ 24.0%
- −$1,131
- After-tax cash flow
- $4,124/yr
For passive investors: Depreciation is non-cash, so a rental often shows a tax loss while cash-flowing — sheltering income. Rental losses are passive: they offset passive income freely, and up to $25,000/yr can offset ordinary (W-2) income if you actively participate and your MAGI is under $100k (phasing out to $0 by $150k); unused losses carry forward. On sale, claimed depreciation is recaptured at up to 25%, and gains may owe capital-gains tax (a 1031 exchange can defer both). Figures are a year-1 estimate at your 24.0% rate — not tax advice; consult a CPA.
Schools (NCES district)
- District
- Sulphur
- NCES district ID
- 4029160
- Math proficiency
- 30% ▼ -11.00%
- Reading proficiency
- 32% ▼ -9.00%
- Median HH income
- $44,116
- Composite
- 26.47/100
- National rank
- #7214
- State rank
- #56 of 270 in OK
Livability — Sulphur
- Score
- 68/100
- State rank
- #60
- US rank
- #9249
Category grades
Schools grade is shown separately in the Schools card above.
Census & demographics
- Census place
- Sulphur, OK
- City population
- 8,504
- Population (ZIP)
- 8,504
Population outlook (Murray County) Hauer SSP2
- Today (2025)
- 14,976 people
- By 2030
- 15,487 · +3.4%
- By 2040
- 16,455 · +9.9%
- By 2050
- 17,308 · +15.6%
- By 2075
- 19,421 · +29.7%
- By 2100
- 20,335 · +35.8%
Race, ethnicity, and origin ACS 2023
- Neighborhood character
- Predominantly White (68%)
- Race & ethnicity
- White 68% Two or more races 14% Native American 12% Hispanic / Latino 8%
- Hispanic origin (detail)
- Mexican 6%
- Common ancestry
- Slovak 4% Portuguese 2% Italian 1%
- Foreign-born
- 2% · Canada
- Languages at home
- 97% English-only · Spanish 2%
Political lean MEDSL · Murray
- 2024 margin
- Solid R (+61.3) · D 18.4% · R 79.7% · Other 2.0%
- 2008→2024 swing
- -21.0pp toward R · 2008: -40.4pp · 2024: -61.3pp
- All cycles
- 2024: R+61.3 2020: R+58.6 2016: R+55.9 2012: R+40.1 2008: R+40.4
Not yet ingested
- Civics
- —
Market trends
- HPI YoY
- ▲ 5.90%
- Current HPI
- 331.8646
- Rent YoY
- —
- Metro
- —
- State GDP YoY
- ▲ 1.55%
- F500 in state
- 6
Industry mix (Fortune 500 HQ in OK)
| Industry | F500 HQs | Revenue |
|---|---|---|
| Energy | 3 | $48B |
|
||
Price history
-7.4% since first listed13 events — show timeline
- 2026-02-06 Listed $50,000 MLSOK
- 2025-12-31 Listing Removed — MLSOK
- 2025-06-06 Listed $50,000 MLSOK
- 2025-05-07 Listing Removed — MLSOK
- 2024-11-13 Listed $50,000 MLSOK
- 2021-07-28 Listing Removed — MLS Technology, Inc.
- 2021-06-17 Price Changed $275,000 MLS Technology, Inc.
- 2020-11-09 Listed $215,000 MLS Technology, Inc.
- 2018-01-09 Listing Removed — MLSOK
- 2017-06-22 Listed $65,000 MLSOK
- 2017-04-12 Listing Removed — MLSOK
- 2016-05-12 Listed $65,000 MLSOK
- 2000-05-12 Sold (Public Records) $54,000 Public Records
Property tax history
+5.4%/yrLatest (2025): $311 · +5.1% YoY. Source: county tax records.
Cash-flow waterfall
monthlySold comps — $/sqft
last 12 mo · ≤1 miLoading sold comps…