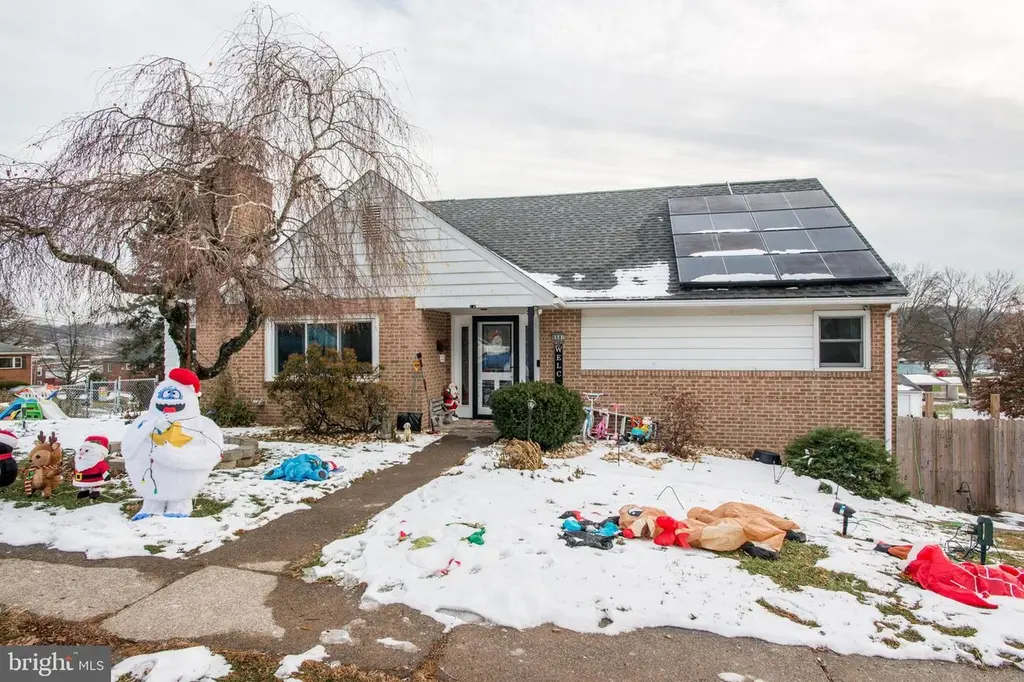
6681 Somerset St · Rutherford, PA
Flood risk 1/10 · Minimal
- FEMA flood zone
- X (unshaded)
- Chance of flooding over 30 yrs
- 0.0%
- Est. flood insurance / yr
- $473 – $860
Fire risk 1/10 · Minimal
- Est. fire insurance / yr
- $511 – $949
Heat risk 5/10 · Moderate
- Hot days now (above 100°F)
- 7 days/yr
- Hot days in 30 yrs
- 15 days/yr
Wind risk 3/10 · Minor
- Chance of severe wind over 30 yrs
- 7.0%
Air-quality risk 3/10 · Minor
- Unhealthy air days now
- 2 days/yr
- Unhealthy air days in 30 yrs
- 4 days/yr
Risk factors via First Street. Map © Google.
Why this score? — see what drove the D- grade
The composite is a weighted blend of 9 inputs, each scored 0–100. Each bar is that input's sub-score; the figure is the points it added to the 100-point composite (weight × sub-score).
- ARV discount +15.0/15.0
- Cash flow +7.7/30.0
- Schools +3.6/10.0
- Rent growth +3.4/5.0
- Livability +3.4/5.0
- Condition / age +2.5/5.0
- DSCR +1.8/10.0
- 1% rule +1.6/10.0
- Appreciation +0.0/10.0
$365,000
🖨 Deal sheet 📄 Offer letter ✓ Due diligence
Listing remarks MLS
This home is a must see! Updated kitchen , and updated floors. Offering 5 bedrooms and 2 1/2baths, and a relaxing sunroom. The living room with fireplace will make it more like home. 2 bedrooms on first and second floor both with a full bath. Large partially finished basement with laundry room, and half bath, could be separate living quarters. Solar panels on the roof. Fenced in backyard, and new roof on house and garage, new windows, and new exterior doors. The detached 3 car garage with space above, make this house a must see. Seller would prefer Cash or Conventional loan, sold as-is
Key facts
- Updated floors
- Updated kitchen
- Solar panels
Tags
Neighborhood map
What this means for you Summary
Snapshot
- This is a 4-bed/1.5-bath single-family listed at $365k.
Deal economics
- At list price, monthly cash flow is $-421 ($-5k/yr) — negative.
- To cash-flow at today's rent, offer at most $291k (20.4% below list).
- To meet the 1% rule (rent ≥ 1% of price), the offer needs to be $242k (33.6% below list).
- Recommended offer: $242k (33.6% below list) — sets the bar for 1% rule.
Location & tenants
- Location reads 67/100 on livability (#1,007 in PA) — a middle-class / working-renter tenant base. Strengths: cost of living A+, housing A+, employment A-; Watch: schools D-, amenities F, commute F.
- Central Dauphin SD (suburban): math 30% / reading 52% proficiency, ranked #305 of 539 in PA (top 57%) — families likely to look elsewhere, expect single-tenant / working-renter base with shorter leases.
- Market conditions: Rents rising (+3.8%/yr); 178 active listings in the ZIP; 1 comparable units currently listed for rent nearby; solid renter incomes; 540 units permitted in Dauphin County in 2024 (194 in 5+ unit buildings).
- This rent runs 34% of the median local income ($86k/yr) — at the standard rent-burdened threshold; future hikes will face affordability resistance.
Forward outlook
- Local home prices are declining (-3.0%/yr); year-one equity from $3k of loan paydown is wiped out by about $11k of value loss. Plan a longer hold.
Negotiation context
- It's been on market 155 days — a 12% lower offer ($321k) is reasonable based on typical stale-listing flexibility.
- 5 sale attempts since 16y ago with the ask held roughly flat each time — persistent listings suggest the price (not the market) is what's stuck; bring a comps-based counter.
- Current owner paid $180k; list at $365k implies a 103% gain — meaningful room to come down on a strong offer.
Risks & watch-outs
- Climate carrying-cost: extreme-heat days projected 7→15/yr by 2055 (HVAC capex compounding) — expect insurance premiums to compound above CPI over the hold.
Questions for the listing agent
- What do current leases actually rent for vs. the listed asking? Can we see a recent rent roll and the last 12 months of T-12 income?
- It's been on market 155 days. Have you received any prior offers? Is the seller open to a 34% concession, seller financing, or rate buy-down credit?
- Built in 1970 — when were the roof, HVAC, electrical panel, plumbing, and water heater last replaced?
- Why hasn't it sold? Are there any deal-killer items the seller is aware of (foundation, flood, title, zoning, code violations)?
- Is there a deadline driving the sale (1031 exchange, divorce, estate, relocation)? That informs how much negotiation room exists.
- Schools are D-rated, which usually means shorter tenancies and higher turnover. Who's the typical renter profile here, and what's been the actual vacancy rate?
- The area grade is low — what's the realistic commute time and amenity access for the typical tenant pool here? Any planned neighborhood developments (good or bad) we should know about?
- What's the average days-on-market for RENTAL listings here right now (not sales)? A rising rental-DOM trend means longer vacancies and softer asking-rent achievability than the comps imply.
- What's the recent tenant-quality profile in this submarket — average credit score on applications, eviction rate, late-payment / NSF rate, and stable-employment percentage? A property-management company in the area should have these aggregated.
- How much new for-sale + rental construction is in the pipeline within 1–3 miles? Heavy new supply typically softens prices + rents 12–24 months out; constrained supply supports both.
Investment metrics
- 1% rule
- 0.66% ✗
- Cap rate
- 4.91%
- Cash-on-cash
- -4.94%
- DSCR
- 0.78
- GRM
- 12.6
CMA / ARV
- ARV (median comp)
- $490,217
- List price
- $365,000
- Delta
- -25.54%
- Verdict
- UNDERPRICED
- Comps
- 20 within 1.0 mi
Show comp detail 7 sales within ~0.75 mi
| Address | Dist | Beds/Ba | Sqft | Sold | Price | $/sf | Match |
|---|---|---|---|---|---|---|---|
| 7035 Woodsman Dr | 0.67mi | 4/3.5 | 3,206 (+1%) | 6mo | $540,000 | $168 | 55 |
| 7094 Creek Crossing Dr | 0.35mi | 5/3.0 (+1) | 3,448 (+8%) | 6mo | $562,500 | $163 | 54 |
| 7038 Woodsman Dr | 0.64mi | 4/2.5 | 3,412 (+7%) | 10mo | $534,900 | $157 | 46 |
| 7078 Creek Crossing Dr | 0.48mi | 4/2.5 | 2,742 (-14%) | 24mo | $502,000 | $183 | 30 |
| 7030 Beech Tree Dr | 0.70mi | 4/2.5 | 2,708 (-15%) | 10mo | $500,000 | $185 | 30 |
| 7037 Beech Tree Dr | 0.55mi | 4/2.5 | 2,750 (-14%) | 23mo | $535,000 | $195 | 29 |
| 7029 Beech Tree Dr | 0.64mi | 4/3.5 | 2,710 (-15%) | 10mo | $505,000 | $186 | 29 |
Match score weights: distance 35% · size 25% · config 20% · recency 20%. Top-matched comps best support the ARV.
Projected returns pro-forma
-3.0% appreciation · 3.76% rent growth · sell at horizon
- IRR
- -24.0%
- Equity multiple
- 0.18×
- Total profit
- $-84,170
- Equity at exit
- $54,423
- IRR
- -17.4%
- Equity multiple
- 0.02×
- Total profit
- $-100,358
- Equity at exit
- $31,559
Cash invested: $102,200 (down + closing). Projections, not guarantees.
Landlord ↔ Tenant lean methodology
- Overall (STATE)
- 62 Landlord-Friendly
- State Pennsylvania
- 62 Landlord-Friendly · EVEN
- County
- — inherits STATE
- City
- — inherits STATE
ZIP-level market 17111
- Rents YoY
- 3.8%
- Active inventory
- 178
- Price-to-rent
- 12.6×
Monthly cashflow live
- Estimated rent
- $2,423 medium interval (Pro) →
- Mortgage (P&I)
- −$1,914
- Tax from tax record
- −$269 /mo · $3,230/yr
- Insurance
- −$152
- HOA
- −$0
- Vacancy / Maint / Mgmt
- −$509
- Net cashflow
- $-421
Break-even live
UW: 25.0% down · 7.5% · 30yr · 1.5% tax · 5.0% vac · 8.0% maint · 8.0% mgmt
Financing live
Cash to close
- Down payment
- $91,250
- Closing costs
- $10,950
- Reserves months
- —
- Total cash needed
- —
Loan-product check · same deal, 3 products live
Conventional
25% down · 7.5% · 30yr
- Down + closing
- —
- Monthly P&I
- —
- Monthly cashflow
- —
- DSCR
- —
- Eligible?
- —
Personal DTI + credit; lowest rate.
DSCR
20% down · 8.5% · 30yr
- Down + closing
- —
- Monthly P&I
- —
- Monthly cashflow
- —
- DSCR
- —
- Eligible?
- —
No personal income docs; deal must DSCR.
Hard money
10% down · 12.0% · 12mo
- Down + closing
- —
- Monthly P&I
- —
- Monthly cashflow
- —
- DSCR
- —
- Eligible?
- —
Short-term bridge; refi at stabilization.
Rent comps 1 comps
| Address | Beds | Baths | Sqft | Rent | $/sqft | DOM | Units | Dist |
|---|---|---|---|---|---|---|---|---|
| 6226 Lehigh Ave Harrisburg, PA | 4.0 | 4.0 | 2128 | $2,975 | $1.40 | 14d | 1 | 0.53mi |
Listing history 22 events
-
2026-06-10days on market $365,000 Active 155 DOM
-
2026-06-09days on market $365,000 Active 154 DOM
-
2026-06-08days on market $365,000 Active 153 DOM
-
2026-06-07days on market $365,000 Active 152 DOM
-
2026-06-05days on market $365,000 Active 149 DOM
-
2026-06-03days on market $365,000 Active 148 DOM
-
2026-06-02days on market $365,000 Active 147 DOM
-
2026-06-01days on market $365,000 Active 146 DOM
-
2026-05-31days on market $365,000 Active 145 DOM
-
2026-05-31days on market $365,000 Active 144 DOM
-
2026-04-07status Active 592-char remark
Show marketing remark (592 chars)
This home is a must see! Updated kitchen , and updated floors. Offering 5 bedrooms and 2 1/2baths, and a relaxing sunroom. The living room with fireplace will make it more like home. 2 bedrooms on first and second floor both with a full bath. Large partially finished basement with laundry room, and half bath, could be separate living quarters. Solar panels on the roof. Fenced in backyard, and new roof on house and garage, new windows, and new exterior doors. The detached 3 car garage with space above, make this house a must see. Seller would prefer Cash or Conventional loan, sold as-is
-
2026-03-18status Pending 592-char remark
Show marketing remark (592 chars)
This home is a must see! Updated kitchen , and updated floors. Offering 5 bedrooms and 2 1/2baths, and a relaxing sunroom. The living room with fireplace will make it more like home. 2 bedrooms on first and second floor both with a full bath. Large partially finished basement with laundry room, and half bath, could be separate living quarters. Solar panels on the roof. Fenced in backyard, and new roof on house and garage, new windows, and new exterior doors. The detached 3 car garage with space above, make this house a must see. Seller would prefer Cash or Conventional loan, sold as-is
-
2025-12-17$365,000 Active 592-char remark
Show marketing remark (592 chars)
This home is a must see! Updated kitchen , and updated floors. Offering 5 bedrooms and 2 1/2baths, and a relaxing sunroom. The living room with fireplace will make it more like home. 2 bedrooms on first and second floor both with a full bath. Large partially finished basement with laundry room, and half bath, could be separate living quarters. Solar panels on the roof. Fenced in backyard, and new roof on house and garage, new windows, and new exterior doors. The detached 3 car garage with space above, make this house a must see. Seller would prefer Cash or Conventional loan, sold as-is
-
2017-03-05historical
-
2017-02-22soldstatus $179,500
-
2017-02-17soldstatus $179,500
-
2016-11-01$179,500
-
2016-09-05$184,000
-
2011-02-04soldstatus $150,000
-
2011-01-31soldstatus $150,000
-
2011-01-06historical
-
2010-03-24$179,900
ⓘ Source: listings_history table (triggers on properties + properties_extension) + one-shot
backfill from property_details.listing_events for pre-trigger history.
Tax reassessment forecast PA · Partial reset (capped growth)
- Current annual tax
- $3,230 · $269/mo
- Projected year-2 tax
- $4,499 · $375/mo
- Expected delta
- +$1,268/yr (+$106/mo · 39.3%)
ⓘ Screening estimate from a state-policy table — verify with the county assessor before closing.
Climate risk First Street
- Flood 1/10 Low FEMA zone X (unshaded) · 0% chance over 30 yrs
- Wildfire 1/10 Low
- Heat 5/10 Major 7 d/yr ≥100°F today · 15 d/yr by 30 yrs out
- Wind 3/10 Moderate 7% chance of damaging wind over 30 yrs
- Air quality 3/10 Moderate 2 unhealthy d/yr today · 4 by 30 yrs out
Nearby sold comps map
Loading sold comps map…
Walkable amenities ~0.75 mi
Loading nearby amenities…
Taxation est. · year 1
- Rental income
- $29,079
- − Mortgage interest
- −$20,446
- − Property taxes
- −$3,230
- − Insurance
- −$1,825
- − Repairs & maintenance
- −$2,326
- − Management
- −$2,326
- − Depreciation
- −$10,618
- Taxable loss
- −$11,693
- Est. tax savings @ 24.0%
- +$2,806
- After-tax cash flow
- $-2,246/yr
For passive investors: Depreciation is non-cash, so a rental often shows a tax loss while cash-flowing — sheltering income. Rental losses are passive: they offset passive income freely, and up to $25,000/yr can offset ordinary (W-2) income if you actively participate and your MAGI is under $100k (phasing out to $0 by $150k); unused losses carry forward. On sale, claimed depreciation is recaptured at up to 25%, and gains may owe capital-gains tax (a 1031 exchange can defer both). Figures are a year-1 estimate at your 24.0% rate — not tax advice; consult a CPA.
Schools (NCES district)
- District
- Central Dauphin SD
- NCES district ID
- 4205400
- Math proficiency
- 30% ▼ -12.00%
- Reading proficiency
- 52% ▼ -7.00%
- Median HH income
- $62,792
- Composite
- 36.46/100
- National rank
- #4664
- State rank
- #305 of 539 in PA
Livability — Rutherford
- Score
- 67/100
- State rank
- #1007
- US rank
- #11116
Category grades
Schools grade is shown separately in the Schools card above.
Census & demographics
- Census place
- Rutherford, PA
- County
- Dauphin County · 247,857 people
- City population
- 35,818
- Metro
- Harrisburg-Carlisle, PA
- Population (ZIP)
- 36,744
- Household income
- $86,385
- Rent vs Own
- Severe rent burden
- 756.0
Population outlook (Dauphin County) Hauer SSP2
- Today (2025)
- 281,628 people
- By 2030
- 283,549 · +0.7%
- By 2040
- 285,385 · +1.3%
- By 2050
- 286,188 · +1.6%
- By 2075
- 291,053 · +3.3%
- By 2100
- 282,374 · +0.3%
Race, ethnicity, and origin ACS 2023
- Neighborhood character
- Diverse neighborhood (Simpson 0.65)
- Race & ethnicity
- White 53% Black 22% Asian 13% Hispanic / Latino 8% Two or more races 6%
- Hispanic origin (detail)
- Mexican 1% Puerto Rican 4%
- Common ancestry
- Romanian 4% Lithuanian 1% Serbian 1%
- Foreign-born
- 14% · India, Canada, Vietnam
- Languages at home
- 83% English-only · Other Indo-European 7% Spanish 6% Vietnamese 1%
Political lean MEDSL · Dauphin
- 2024 margin
- Lean D (+5.9) · D 52.4% · R 46.5% · Other 1.1%
- 2008→2024 swing
- -3.1pp toward R · 2008: 9.1pp · 2024: 5.9pp
- All cycles
- 2024: D+5.9 2020: D+8.5 2016: D+2.8 2012: D+6.0 2008: D+9.1
Not yet ingested
- Civics
- —
Market trends
- HPI YoY
- ▼ -140.67%
- Current HPI
- 236.6936
- Rent YoY
- ▲ 3.76%
- Metro
- Harrisburg-Carlisle, PA
- State GDP YoY
- ▲ 1.68%
- F500 in state
- 34
Industry mix (Fortune 500 HQ in PA)
| Industry | F500 HQs | Revenue |
|---|---|---|
| Healthcare | 2 | $309B |
|
||
| Insurance | 2 | $27B |
|
||
| Telecommunications / Media | 1 | $124B |
|
||
| Industrial Distribution | 1 | $22B |
|
||
| Financial Services | 1 | $20B |
|
||
| Chemicals / Materials | 1 | $18B |
|
||
Price history
+102.9% since first listed12 events — show timeline
- 2026-04-07 Relisted — BRIGHT MLS
- 2026-03-18 Pending — BRIGHT MLS
- 2025-12-17 Listed $365,000 BRIGHT MLS
- 2017-03-05 Listing Removed — BRIGHT MLS
- 2017-02-22 Sold (Public Records) $179,500 Public Records
- 2017-02-17 Sold (MLS) $179,500 BRIGHT MLS
- 2016-11-01 Listed $179,500 BRIGHT MLS
- 2016-09-05 Listed $184,000 BRIGHT MLS
- 2011-02-04 Sold (Public Records) $150,000 Public Records
- 2011-01-31 Sold (MLS) $150,000 BRIGHT MLS
- 2011-01-06 Listing Removed — BRIGHT MLS
- 2010-03-24 Listed $179,900 BRIGHT MLS
Property tax history
+1.9%/yrLatest (2026): $3,230 · +5.5% YoY. Source: county tax records.
Cash-flow waterfall
monthlySold comps — $/sqft
last 12 mo · ≤1 miLoading sold comps…