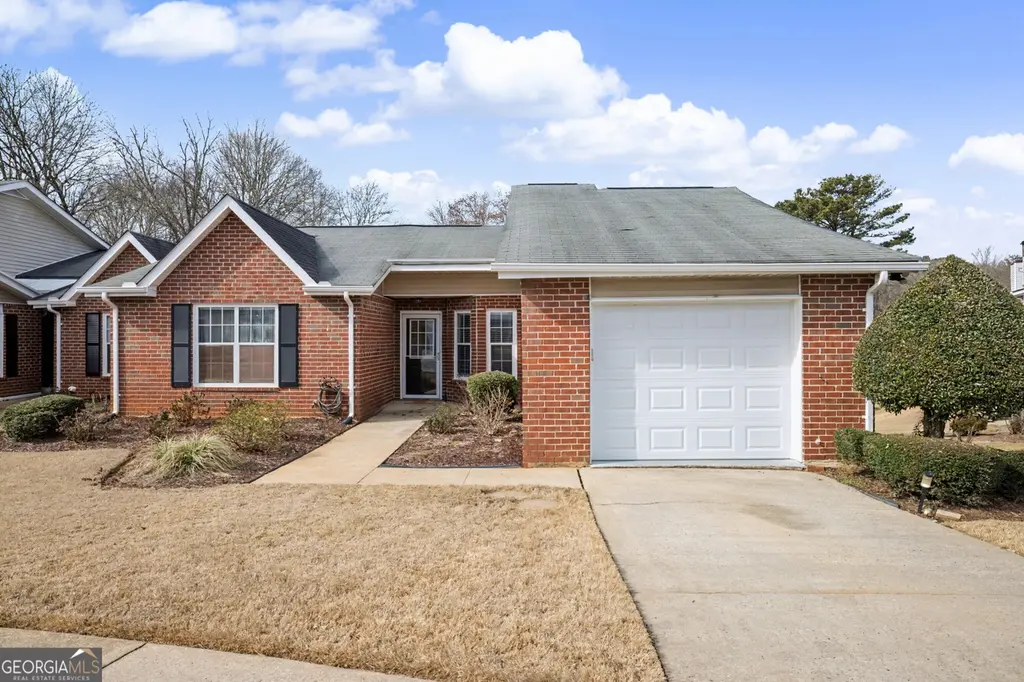
130 Cornwallis Way · Fayetteville, GA
Flood risk 7/10 · Major
- FEMA flood zone
- X (unshaded)
- Chance of flooding over 30 yrs
- 0.76%
- Est. flood insurance / yr
- $473 – $860
Fire risk 3/10 · Minor
- Est. fire insurance / yr
- $963 – $1,789
Heat risk 6/10 · Moderate
- Hot days now (above 106°F)
- 7 days/yr
- Hot days in 30 yrs
- 19 days/yr
Wind risk 6/10 · Moderate
- Chance of severe wind over 30 yrs
- 27.0%
Air-quality risk 4/10 · Minor
- Unhealthy air days now
- 3 days/yr
- Unhealthy air days in 30 yrs
- 5 days/yr
Risk factors via First Street. Map © Google.
Why this score? — see what drove the D grade
The composite is a weighted blend of 9 inputs, each scored 0–100. Each bar is that input's sub-score; the figure is the points it added to the 100-point composite (weight × sub-score).
- ARV discount +13.8/15.0
- Cash flow +9.5/30.0
- Schools +5.1/10.0
- Rent growth +3.6/5.0
- Livability +3.6/5.0
- DSCR +2.7/10.0
- 1% rule +2.5/10.0
- Condition / age +2.5/5.0
- Appreciation +0.0/10.0
$249,900
🖨 Deal sheet (PDF) 📄 Offer letter ✓ Due diligence
Listing remarks MLS
Brick garden home with full basement in over 55 community. End unit. Granite countertops and stainless steel appliances in kitchen with lots of cabinet space, pantry and breakfast area. Skylights and vaulted ceiling in living room. L-shaped dining room. Double sinks in master bath, plus large stand-up shower. Fireplace with gas logs in living room. Tile floors in both baths.
Key facts
- Walk out patio
- Laundry closet
- Granite countertops
Tags
Property features AI
Finance
- Other: Accepted financing: Cash, Conventional, FHA, VA Loan
- HOA & community: Community pool; Sidewalks and street lights; Near shopping; Association with fees (includes facilities fee, management fee, swimming)
Exterior
- Parking: Attached garage with garage door opener (1 parking space)
- Security: Carbon monoxide detector(s); Smoke detector(s)
- Utilities: Public water; Public sewer (connected); 220 volt electric; Cable available; Natural gas available; Phone available; Underground utilities
- Home design: Single-family residence (Garden/Patio home); Attached (end unit); One story; Resale condition
- Construction: Brick construction; Composition roof; Slab foundation; Built in 1989
- Exterior features: Deck; Grassed yard; Level to sloped lot
Interior
- Kitchen: Breakfast area; Pantry; Solid surface counters; Dishwasher; Disposal; Microwave; Refrigerator; Stainless steel appliances; Electric water heater
- Bedrooms: 2 bedrooms (both on the main level)
- Flooring: Carpet; Vinyl
- Bathrooms: 2 full bathrooms (both on the main level)
- Heating & cooling: Central heating (forced air, natural gas); Central air conditioning (electric); Ceiling fan(s)
- Interior features: Double vanity; High ceilings; Separate shower; Tile bath; Walk-in closet(s); Family room; Foyer; Dining room / Living room combo; Basement with concrete daylight, exterior and interior entry (unfinished)
- Laundry & utility: Laundry area in kitchen
Neighborhood map
What this means for you Summary
Snapshot
- This is a 2-bed/3.0-bath single-family listed at $250k.
Deal economics
- At list price, monthly cash flow is $-228 ($-3k/yr) — negative.
- To cash-flow at today's rent, offer at most $210k (16.1% below list).
- To meet the 1% rule (rent ≥ 1% of price), the offer needs to be $188k (24.9% below list).
- Recommended offer: $188k (24.9% below list) — sets the bar for 1% rule.
- Cap rate 5.5% vs local median 4.3% in Fayetteville — meaningfully above typical; check what's discounted (condition, days-on-market, listing class) to confirm the premium yield is real.
Location & tenants
- Location reads 71/100 on livability (#86 in GA) — a middle-class / working-renter tenant base. Strengths: housing A+, health & safety B+, employment B; Watch: amenities F, commute F.
- Fayette County (suburban): math 52% / reading 60% proficiency, ranked #7 of 174 in GA (top 4%) — acceptable for families but not a draw, mixed tenant base, ~2y average lease.
- Zoned schools: Spring Hill Elementary School (math 39% / reading 42%, grade F, #419 of 1,228 statewide, top 35%, 655 students, 63% FRL); Bennett'S Mill Middle School (math 24% / reading 51%, grade F, #162 of 470 statewide, top 35%, 891 students, 53% FRL); Fayette County High School (math 15% / reading 42%, grade F, #149 of 424 statewide, top 35%, 1,368 students, 46% FRL) — zoned schools average 54% FRL vs 21% district-wide (33 pts higher); higher-poverty schools than district average — tighter screening recommended.
- Zoned-school proficiency averages 36% at this address vs 56% district-wide (-20 pts) — the specific schools serving this property underperform the Fayette County average; the district grade overstates school quality for this exact location.
- Market conditions: Rents rising fast (+4.3%/yr); 378 active listings in the ZIP; 12 comparable units currently listed for rent nearby; rentals lingering (median 46d on market — plan ~5-8 weeks vacancy on turnover, expect pricing pressure); 50% of comp listings sitting > 30 days — soft ceiling on asking rent; solid renter incomes; 323 units permitted in Fayette County in 2024 (0 in 5+ unit buildings).
Forward outlook
- Local home prices are declining (-3.0%/yr); year-one equity from $2k of loan paydown is wiped out by about $7k of value loss. Plan a longer hold.
- Fayette County population projected at +13% by 2050 — modest demand growth; plan on rents tracking national, not racing it.
Negotiation context
- Only 11 days on market — expect competitive offers; lowballing is unlikely to land.
- 10 sale attempts since 11y ago; this cycle's ask has dropped $25k (9%) from the opening price — seller is motivated, your offer sets the floor, not the list.
- Current owner paid $170k; 47% above their basis — modest negotiation headroom, anchor on the comps not their cost.
Risks & watch-outs
- Watch-outs: flood insurance adds $56/mo.
- Climate carrying-cost: major flood risk; major wind risk, 27% chance of damaging wind over 30y; extreme-heat days projected 7→19/yr by 2055 (HVAC capex compounding) — expect insurance premiums to compound above CPI over the hold.
Questions for the listing agent
- What do current leases actually rent for vs. the listed asking? Can we see a recent rent roll and the last 12 months of T-12 income?
- What's the actual annual flood-insurance premium (NFIP or private), and is the property in a SFHA with mandatory coverage?
- What does the HOA fee cover, when was the last increase, and are there any pending special assessments or reserve-fund shortfalls?
- Is there a deadline driving the sale (1031 exchange, divorce, estate, relocation)? That informs how much negotiation room exists.
- Schools are B-rated — typically a magnet for longer-tenancy family renters. What's the average tenant stay here, and is there a school-zone premium baked into asking?
- The area grade is low — what's the realistic commute time and amenity access for the typical tenant pool here? Any planned neighborhood developments (good or bad) we should know about?
- What's the average days-on-market for RENTAL listings here right now (not sales)? A rising rental-DOM trend means longer vacancies and softer asking-rent achievability than the comps imply.
- What's the recent tenant-quality profile in this submarket — average credit score on applications, eviction rate, late-payment / NSF rate, and stable-employment percentage? A property-management company in the area should have these aggregated.
- How much new for-sale + rental construction is in the pipeline within 1–3 miles? Heavy new supply typically softens prices + rents 12–24 months out; constrained supply supports both.
Investment metrics
- 1% rule
- 0.75% ✗
- Cap rate
- 5.46%
- Cash-on-cash
- -2.96%
- DSCR
- 0.87
- GRM
- 11.1
CMA / ARV
- ARV (median comp)
- $290,920
- List price
- $249,900
- Delta
- -5.51%
- Verdict
- FAIR
- Comps
- 20 within 1.0 mi
Show comp detail 12 sales within ~0.75 mi
| Address | Dist | Beds/Ba | Sqft | Sold | Price | $/sf | Match |
|---|---|---|---|---|---|---|---|
| 220 Monmouth Dr | 0.06mi | 2/2.0 | 1,446 (+5%) | 14mo | $170,000 | $118 | 73 |
| 135 Gingercake Ct | 0.26mi | 3/2.0 (+1) | 1,314 (-5%) | 0mo | $259,000 | $197 | 70 |
| 205 Lagrange Ct | 0.11mi | 2/2.0 | 1,429 (+4%) | 18mo | $255,000 | $178 | 70 |
| 170 Landing Dr | 0.28mi | 3/2.0 (+1) | 1,479 (+7%) | 1mo | $278,000 | $188 | 65 |
| 445 Cornwallis Way | 0.21mi | 3/2.0 (+1) | 1,243 (-10%) | 0mo | $250,000 | $201 | 64 |
| 295 Monmouth Dr | 0.14mi | 3/2.0 (+1) | 1,364 (-1%) | 22mo | $270,000 | $198 | 64 |
| 470 Cornwallis Way | 0.30mi | 3/2.0 (+1) | 1,306 (-5%) | 9mo | $270,000 | $207 | 61 |
| 491 Oak St | 0.55mi | 3/2.0 (+1) | 1,424 (+3%) | 0mo | $300,000 | $211 | 60 |
| 345 Sharon Dr | 0.51mi | 3/2.0 (+1) | 1,363 (-1%) | 10mo | $340,000 | $249 | 57 |
| 260 Sharon Dr | 0.46mi | 3/2.0 (+1) | 1,462 (+6%) | 11mo | $300,000 | $205 | 50 |
| 165 Gingercake Ct | 0.22mi | 3/2.0 (+1) | 1,582 (+15%) | 14mo | $242,000 | $153 | 45 |
| 125 Maple Pl | 0.45mi | 3/2.0 (+1) | 1,561 (+13%) | 4mo | $280,000 | $179 | 44 |
Match score weights: distance 35% · size 25% · config 20% · recency 20%. Top-matched comps best support the ARV.
Projected returns pro-forma
-3.0% appreciation · 4.29% rent growth · sell at horizon
- IRR
- -21.5%
- Equity multiple
- 0.25×
- Total profit
- $-52,549
- Equity at exit
- $37,261
- IRR
- -12.4%
- Equity multiple
- 0.23×
- Total profit
- $-54,013
- Equity at exit
- $21,607
Cash invested: $69,972 (down + closing). Projections, not guarantees.
Landlord ↔ Tenant lean methodology
- Overall (STATE)
- 90 Strongly Landlord-Friendly
- State Georgia
- 90 Strongly Landlord-Friendly · R+3
- County
- — inherits STATE
- City
- — inherits STATE
ZIP-level market 30214
- Rents YoY
- 4.3%
- Active inventory
- 378
- Price-to-rent
- 11.1×
Monthly cashflow live
- Estimated rent
- $1,876 high interval (Pro) →
- Mortgage (P&I)
- −$1,311
- Tax from tax record
- −$120 /mo · $1,446/yr
- Insurance
- −$104
- Flood insurance flood zone
- −$56 /mo · $666/yr
- HOA
- −$120
- Vacancy / Maint / Mgmt
- −$394
- Net cashflow
- $-228
Break-even live
Sensitivity live
| Price | -10% $-87 | -5% $-158 | +0% $-228 | +5% $-299 | +10% $-370 |
|---|---|---|---|---|---|
| Rent | -10% $-377 | -5% $-302 | +0% $-228 | +5% $-154 | +10% $-80 |
| Rate | -1.0pp $-102 | -0.5pp $-165 | base $-228 | +0.5pp $-293 | +1.0pp $-359 |
UW: 25.0% down · 7.5% · 30yr · 1.5% tax · 5.0% vac · 8.0% maint · 8.0% mgmt
Financing live
Cash to close
- Down payment
- $62,475
- Closing costs
- $7,497
- Reserves months
- —
- Total cash needed
- —
Loan-product check · same deal, 3 products live
Conventional
25% down · 7.5% · 30yr
- Down + closing
- —
- Monthly P&I
- —
- Monthly cashflow
- —
- DSCR
- —
- Eligible?
- —
Personal DTI + credit; lowest rate.
DSCR
20% down · 8.5% · 30yr
- Down + closing
- —
- Monthly P&I
- —
- Monthly cashflow
- —
- DSCR
- —
- Eligible?
- —
No personal income docs; deal must DSCR.
Hard money
10% down · 12.0% · 12mo
- Down + closing
- —
- Monthly P&I
- —
- Monthly cashflow
- —
- DSCR
- —
- Eligible?
- —
Short-term bridge; refi at stabilization.
Rent comps 12 comps
| Address | Beds | Baths | Sqft | Rent | $/sqft | DOM | Units | Dist |
|---|---|---|---|---|---|---|---|---|
| 255 Monmouth Dr Fayetteville, GA | 2.0 | 2.0 | 1231 | $1,700 | $1.38 | 45d | 1 | 0.07mi |
| 315 Cornwallis Way Fayetteville, GA | 3.0 | 2.0 | 1374 | $1,895 | $1.38 | 3d | 1 | 0.20mi |
| 165 Gingercake Ct Fayetteville, GA | 3.0 | 2.0 | 1582 | $2,110 | $1.33 | 45d | 1 | 0.21mi |
| 160 Belle Dr Fayetteville, GA | 1.0–2.0 | 1.0–2.0 | 885 | $1,575 | $1.78 | 45d | 1 | 0.27mi |
| 110 Gingerbread Pl Fayetteville, GA | 3.0 | 2.0 | 1582 | $2,120 | $1.34 | 0d | 1 | 0.29mi |
| 145 Belle Dr Fayetteville, GA | 2.0 | 1.5 | 1100 | $1,300 | $1.18 | 45d | 1 | 0.29mi |
| 280 Chase Dr Fayetteville, GA | 2.0 | 1.0 | 1010 | $1,325 | $1.31 | 45d | 1 | 0.33mi |
| 235 Sharon Dr Fayetteville, GA | 3.0 | 2.0 | 1299 | $1,676 | $1.29 | 26d | 1 | 0.48mi |
| 216 Ginger Cake Rd Fayetteville, GA | 3.0 | 2.0 | 1659 | $2,195 | $1.32 | 0d | 1 | 0.60mi |
| 130 Pye Ct Fayetteville, GA | 3.0 | 2.0 | 1292 | $5,500 | $4.26 | 45d | 1 | 0.63mi |
| 270 Winona Dr Fayetteville, GA | 3.0 | 2.0 | 1378 | $2,011 | $1.46 | 14d | 1 | 0.74mi |
| 119 Forrest Ave Fayetteville, GA | 2.0 | 1.5 | 1240 | $1,750 | $1.41 | 7d | 1 | 1.32mi |
HOA detail
- Monthly dues
- $120 · $1,440/yr
- Likely covers
- gas
Listing history 27 events
-
2026-05-31status $249,900 Under Contract 11 DOM
-
2026-05-19historical
-
2026-03-04status Back On Market
-
2026-03-03status Under Contract
-
2026-01-23$274,900 New
-
2026-01-22historical
-
2025-12-22$249,900 New 1676-char remark
-
2021-03-22soldstatus $170,000
-
2021-03-15soldstatus $170,000 Sold
Show marketing remark (378 chars)
Brick garden home with full basement in over 55 community. End unit. Granite countertops and stainless steel appliances in kitchen with lots of cabinet space, pantry and breakfast area. Skylights and vaulted ceiling in living room. L-shaped dining room. Double sinks in master bath, plus large stand-up shower. Fireplace with gas logs in living room. Tile floors in both baths.
-
2021-02-04status Under Contract
Show marketing remark (378 chars)
Brick garden home with full basement in over 55 community. End unit. Granite countertops and stainless steel appliances in kitchen with lots of cabinet space, pantry and breakfast area. Skylights and vaulted ceiling in living room. L-shaped dining room. Double sinks in master bath, plus large stand-up shower. Fireplace with gas logs in living room. Tile floors in both baths.
-
2021-02-01$169,900 New
Show marketing remark (378 chars)
Brick garden home with full basement in over 55 community. End unit. Granite countertops and stainless steel appliances in kitchen with lots of cabinet space, pantry and breakfast area. Skylights and vaulted ceiling in living room. L-shaped dining room. Double sinks in master bath, plus large stand-up shower. Fireplace with gas logs in living room. Tile floors in both baths.
-
2015-12-23price $110,000
-
2015-12-02soldstatus $110,000 Sold
-
2015-10-23status Under Contract
-
2015-10-23price $115,000
-
2015-10-21status Back On Market
-
2015-09-24status Under Contract
-
2015-09-08$115,000 New
-
2015-09-01historical
-
2015-06-16$120,000 New
-
2015-06-16historical
-
2015-05-28status Active
-
2015-04-25historical Pending
-
2015-04-23status Active
-
2015-04-06historical Pending
-
2015-03-25$120,000 Active
-
2014-12-01soldstatus $67,000
ⓘ Source: listings_history table (triggers on properties + properties_extension) + one-shot
backfill from property_details.listing_events for pre-trigger history.
Tax reassessment forecast GA · Resets to sale price
- Current annual tax
- $1,446 · $120/mo
- Projected year-2 tax
- $2,299 · $192/mo
- Expected delta
- +$853/yr (+$71/mo · 59.0%)
ⓘ Screening estimate from a state-policy table — verify with the county assessor before closing.
Climate risk First Street
- Flood 7/10 Severe FEMA zone X (unshaded) · 76% chance over 30 yrs
- Wildfire 3/10 Moderate
- Heat 6/10 Major 7 d/yr ≥106°F today · 19 d/yr by 30 yrs out
- Wind 6/10 Major 27% chance of damaging wind over 30 yrs
- Air quality 4/10 Moderate 3 unhealthy d/yr today · 5 by 30 yrs out
Nearby sold comps map
Loading sold comps map…
Walkable amenities ~0.75 mi
Loading nearby amenities…
Taxation est. · year 1
- Rental income
- $22,517
- − Mortgage interest
- −$13,998
- − Property taxes
- −$1,446
- − Insurance
- −$1,916
- − Repairs & maintenance
- −$1,801
- − Management
- −$1,801
- − HOA
- −$1,440
- − Depreciation
- −$7,270
- Taxable loss
- −$7,156
- Est. tax savings @ 24.0%
- +$1,717
- After-tax cash flow
- $-1,022/yr
For passive investors: Depreciation is non-cash, so a rental often shows a tax loss while cash-flowing — sheltering income. Rental losses are passive: they offset passive income freely, and up to $25,000/yr can offset ordinary (W-2) income if you actively participate and your MAGI is under $100k (phasing out to $0 by $150k); unused losses carry forward. On sale, claimed depreciation is recaptured at up to 25%, and gains may owe capital-gains tax (a 1031 exchange can defer both). Figures are a year-1 estimate at your 24.0% rate — not tax advice; consult a CPA.
Schools (NCES district)
- District
- Fayette County
- NCES district ID
- 1302130
- Math proficiency
- 52% ▼ -12.00%
- Reading proficiency
- 60% ▼ -7.00%
- Median HH income
- $80,746
- Composite
- 50.67/100
- National rank
- #1824
- State rank
- #7 of 174 in GA
Livability — Fayetteville
- Score
- 71/100
- State rank
- #86
- US rank
- #7167
Category grades
Schools grade is shown separately in the Schools card above.
Census & demographics
- Census place
- Fayetteville, GA
- County
- Fayette County · 112,821 people
- City population
- 72,287
- Metro
- Atlanta-Sandy Springs-Alpharetta, GA
- Population (ZIP)
- 31,811
- Household income
- $89,912
- Rent vs Own
- Severe rent burden
- 634.0
Population outlook (Fayette County) Hauer SSP2
- Today (2025)
- 120,914 people
- By 2030
- 125,439 · +3.7%
- By 2040
- 132,378 · +9.5%
- By 2050
- 137,123 · +13.4%
- By 2075
- 156,091 · +29.1%
- By 2100
- 163,102 · +34.9%
Race, ethnicity, and origin ACS 2023
- Neighborhood character
- Diverse neighborhood (Simpson 0.62)
- Race & ethnicity
- Black 51% White 33% Hispanic / Latino 9% Two or more races 5% Asian 3%
- Hispanic origin (detail)
- Mexican 6% Puerto Rican 1%
- Common ancestry
- Italian 2% Slovak 1% Serbian 1%
- Foreign-born
- 10% · Canada, Vietnam
- Languages at home
- 85% English-only · Spanish 8% Other Asian/Pacific 1% French/Haitian/Cajun 1%
Political lean MEDSL · Fayette
- 2024 margin
- Toss-up / Even · D 48.0% · R 51.1%
- 2008→2024 swing
- +27.5pp toward D · 2008: -30.7pp · 2024: -3.1pp
- All cycles
- 2024: R+3.1 2020: R+6.8 2016: R+19.5 2012: R+31.4 2008: R+30.7
Not yet ingested
- Civics
- —
Market trends
- HPI YoY
- ▼ -142.65%
- Current HPI
- 243.9416
- Rent YoY
- ▲ 4.29%
- Metro
- Atlanta-Sandy Springs-Alpharetta, GA
- State GDP YoY
- ▲ 2.66%
- F500 in state
- 28
Industry mix (Fortune 500 HQ in GA)
| Industry | F500 HQs | Revenue |
|---|---|---|
| Paper / Packaging | 2 | $29B |
|
||
| Retail | 1 | $160B |
|
||
| Transportation / Logistics | 1 | $91B |
|
||
| Airlines | 1 | $62B |
|
||
| Consumer Goods | 1 | $47B |
|
||
| Utilities | 1 | $25B |
|
||
Price history
+310.3% since first listed27 events — show timeline
- 2026-05-30 Pending — GAMLS
- 2026-05-19 Listing Removed — GAMLS
- 2026-03-04 Relisted — GAMLS
- 2026-03-03 Pending — GAMLS
- 2026-01-23 Listed $274,900 GAMLS
- 2026-01-22 Coming Soon — GAMLS
- 2025-12-22 Listed $249,900 GAMLS
- 2021-03-22 Sold (Public Records) $170,000 Public Records
- 2021-03-15 Sold (MLS) $170,000 GAMLS
- 2021-02-04 Pending — GAMLS
- 2021-02-01 Listed $169,900 GAMLS
- 2015-12-23 Price Changed $110,000 GAMLS
- 2015-12-02 Sold (MLS) $110,000 GAMLS
- 2015-10-23 Pending — GAMLS
- 2015-10-23 Price Changed $115,000 GAMLS
- 2015-10-21 Relisted — GAMLS
- 2015-09-24 Pending — GAMLS
- 2015-09-08 Listed $115,000 GAMLS
- 2015-09-01 Listing Removed — GAMLS
- 2015-06-16 Listed $120,000 GAMLS
- 2015-06-16 Listing Removed — FMLS
- 2015-05-28 Relisted — FMLS
- 2015-04-25 Contingent — FMLS
- 2015-04-23 Relisted — FMLS
- 2015-04-06 Contingent — FMLS
- 2015-03-25 Listed $120,000 FMLS
- 2014-12-01 Sold (Public Records) $67,000 Public Records
Property tax history
+7.1%/yrLatest (2025): $1,446 · +1.2% YoY. Source: county tax records.
Cash-flow waterfall
monthlySold comps — $/sqft
last 12 mo · ≤1 miLoading sold comps…