 Multi-family
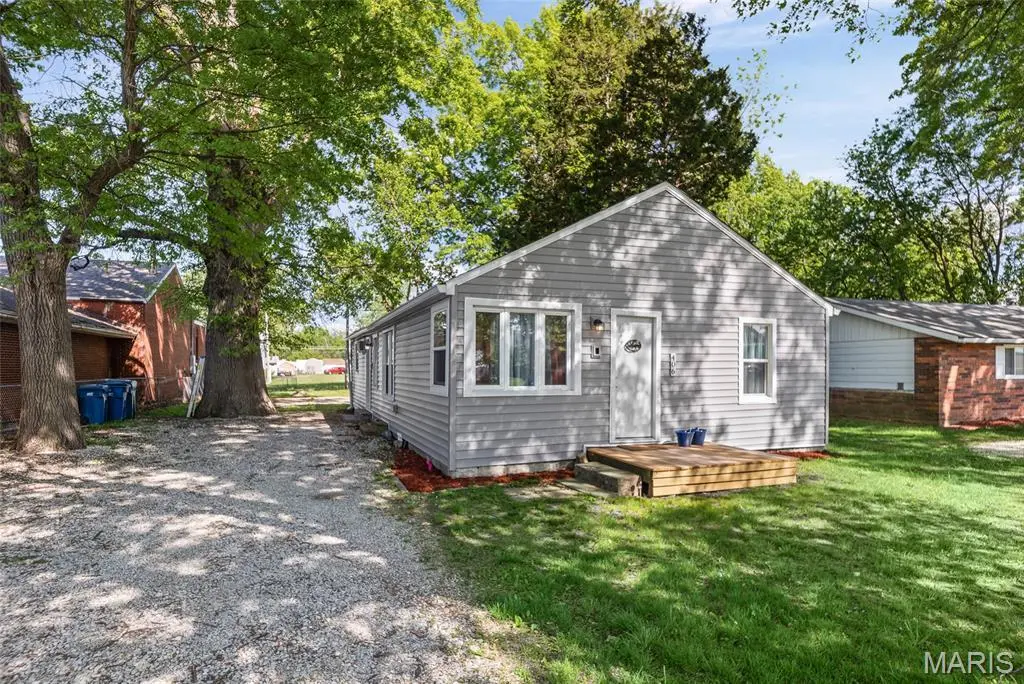
406 Southard Pl · South Roxana, IL
Flood risk 1/10 · Minimal
- FEMA flood zone
- X
- Chance of flooding over 30 yrs
- 0.0%
- Est. flood insurance / yr
- $507 – $1,088
Fire risk 1/10 · Minimal
- Est. fire insurance / yr
- $804 – $1,492
Heat risk 5/10 · Moderate
- Hot days now (above 107°F)
- 7 days/yr
- Hot days in 30 yrs
- 20 days/yr
Wind risk 2/10 · Minimal
- Chance of severe wind over 30 yrs
- 1.0%
Air-quality risk 4/10 · Minor
- Unhealthy air days now
- 5 days/yr
- Unhealthy air days in 30 yrs
- 6 days/yr
Risk factors via First Street. Map © Google.
Why this score? — see what drove the B- grade
The composite is a weighted blend of 9 inputs, each scored 0–100. Each bar is that input's sub-score; the figure is the points it added to the 100-point composite (weight × sub-score).
- Cash flow +25.5/30.0
- ARV discount +11.4/15.0
- DSCR +8.5/10.0
- 1% rule +7.0/10.0
- Appreciation +5.0/10.0
- Livability +2.9/5.0
- Rent growth +2.5/5.0
- Condition / age +2.5/5.0
- Schools +1.7/10.0
$82,000
🖨 Deal sheet 📄 Offer letter ✓ Due diligence
Multi-family units
County records classify this as Multi-Family (2-4 Unit). Listing-text estimate: 1 unit. estimate disagrees with records
Listing remarks
Constructed in the 60's as a two family duplex this structure was built for simplicity and convenience. This home was converted from a duplex in 2023 with the idea to create an open space, and accomodating three bedrooms, spacious main level laundry and second bathroom. There are two functioning furnaces. All new Apex water lines and plumbing in crawl space. Sump pump to manage ground water. New roof, gutters and downspouts all new in 2023 along with the majority of windows are also newer. The home has easy access with front, rear and side entry. This is a simple pallette with loads of potential. Contact BHHS Select Properties and schedule your tour. Rent Roll included for Investors, and fo
Key facts
- 6,873 sq ft lot
- Built 1964
- Listed 51 days
Property features AI
Finance
- Other: Living area about 1,152 (per public records); Above-grade finished area listed as 1,100 (per public records)
- HOA & community: No association amenities; Public bus access
Exterior
- Parking: On-site parking; no garage
- Security: Smoke detectors
- Utilities: Public water; Public sewer; Electric service by Ameren; Electricity connected; Natural gas connected
- Home design: Single-family residence; Updated/remodeled condition; One level
- Construction: Vinyl siding; Architectural shingle roof; Block foundation; House structure
- Exterior features: Porch; City lot; Asphalt road frontage (city street); Shed(s)
Interior
- Kitchen: Eat-in kitchen
- Bedrooms: 3 bedrooms on the main level; Bonus room on the main level
- Flooring: Carpet; Vinyl
- Bathrooms: 1 full bathroom; 1 half bathroom (main level)
- Heating & cooling: Forced air heating; Ceiling fans; Gas cooling/heating connections; Window unit(s)
- Interior features: Eat-in kitchen; Double pane windows; Window coverings; Sump pump (basement)
- Laundry & utility: Laundry room inside on the main level
Neighborhood map
What this means for you Summary
Snapshot
- This is a 4-bed/1.5-bath multifamily listed at $82k.
Deal economics
- At list price, monthly cash flow is $192 ($2k/yr) — positive.
- The deal already cash-flows at list — no discount required.
- Meets the 1% rule at list price ($988 rent vs $82k).
- Recommended offer: $80k (3.0% below list) — sets the bar for market timing.
Location & tenants
- Location reads 58/100 on livability (#1,141 in IL) — a working-class tenant base; expect higher turnover. Strengths: cost of living A+, housing A+; Watch: amenities F, commute F, employment F.
- Roxana CUSD 1 (suburban): math 18% / reading 19% proficiency, ranked #440 of 620 in IL (top 71%) — low school quality limits family demand, transient renter base, plan for 1-2y turnover.
- Zoned schools: Roxana Sr High School (math 12% / reading 12%, grade F, #511 of 693 statewide, top 75%, 515 students, 0% FRL) — zoned schools average 0% FRL vs 51% district-wide (51 pts lower); this property's tenant base skews higher-income than the district average.
- Market conditions: 6 active listings in the ZIP; 336 units permitted in Madison County in 2024 (0 in 5+ unit buildings).
Forward outlook
- In year one you build about $3k of equity ($567 loan paydown + $2k appreciation (3.0% local appreciation)).
- Madison County population projected at -18% by 2050 — secular population decline; favor cash flow + early exit over multi-decade hold.
- At projected returns (3.0% appreciation + 3.0% rent growth), your $23k cash investment doubles in ~4 years — after that, you're playing with house money.
Negotiation context
- It's been on market 51 days — a 3% lower offer ($80k) is reasonable based on typical stale-listing flexibility.
Risks & watch-outs
- Climate carrying-cost: extreme-heat days projected 7→20/yr by 2055 (HVAC capex compounding) — expect insurance premiums to compound above CPI over the hold.
Questions for the listing agent
- It's been on market 51 days. Have you received any prior offers? Is the seller open to a 3% concession, seller financing, or rate buy-down credit?
- Built in 1964 — when were the roof, HVAC, electrical panel, plumbing, and water heater last replaced?
- Is there a deadline driving the sale (1031 exchange, divorce, estate, relocation)? That informs how much negotiation room exists.
- Schools are F-rated, which usually means shorter tenancies and higher turnover. Who's the typical renter profile here, and what's been the actual vacancy rate?
- What's the average days-on-market for RENTAL listings here right now (not sales)? A rising rental-DOM trend means longer vacancies and softer asking-rent achievability than the comps imply.
- What's the recent tenant-quality profile in this submarket — average credit score on applications, eviction rate, late-payment / NSF rate, and stable-employment percentage? A property-management company in the area should have these aggregated.
- How much new apartment / multifamily construction is in the pipeline within 1–3 miles? Heavy new supply (>2% of stock underway) typically softens rents 12–24 months out; light construction supports rent growth.
Investment metrics
- 1% rule
- 1.20% ✓
- Cap rate
- 9.11%
- Cash-on-cash
- 10.05%
- DSCR
- 1.45
- GRM
- 6.9
CMA / ARV
- ARV (median comp)
- $89,692
- List price
- $82,000
- Delta
- -8.58%
- Verdict
- FAIR
- Comps
- 20 within 1.0 mi
Projected returns pro-forma
3.0% appreciation · 3.0% rent growth · sell at horizon
- IRR
- 16.9%
- Equity multiple
- 1.97×
- Total profit
- $22,158
- Equity at exit
- $36,871
- IRR
- 18.4%
- Equity multiple
- 3.69×
- Total profit
- $61,762
- Equity at exit
- $56,822
Cash invested: $22,960 (down + closing). Projections, not guarantees.
Landlord ↔ Tenant lean methodology
- Overall (STATE)
- 43 Moderately Tenant-Leaning
- State Illinois
- 43 Moderately Tenant-Leaning · D+7
- County
- — inherits STATE
- City
- — inherits STATE
ZIP-level market 62087
- Active inventory
- 6
- Price-to-rent
- 6.9×
Monthly cashflow live
- Estimated rent
- $988 medium interval (Pro) →
- Mortgage (P&I)
- −$430
- Tax from tax record
- −$124 /mo · $1,489/yr
- Insurance
- −$34
- HOA
- −$0
- Vacancy / Maint / Mgmt
- −$207
- Net cashflow
- $192
Break-even live
UW: 25.0% down · 7.5% · 30yr · 1.5% tax · 5.0% vac · 8.0% maint · 8.0% mgmt
Financing live
Cash to close
- Down payment
- $20,500
- Closing costs
- $2,460
- Reserves months
- —
- Total cash needed
- —
Loan-product check · same deal, 3 products live
Conventional
25% down · 7.5% · 30yr
- Down + closing
- —
- Monthly P&I
- —
- Monthly cashflow
- —
- DSCR
- —
- Eligible?
- —
Personal DTI + credit; lowest rate.
DSCR
20% down · 8.5% · 30yr
- Down + closing
- —
- Monthly P&I
- —
- Monthly cashflow
- —
- DSCR
- —
- Eligible?
- —
No personal income docs; deal must DSCR.
Hard money
10% down · 12.0% · 12mo
- Down + closing
- —
- Monthly P&I
- —
- Monthly cashflow
- —
- DSCR
- —
- Eligible?
- —
Short-term bridge; refi at stabilization.
Listing history 15 events
-
2026-06-18days on market $82,000 Active 51 DOM
-
2026-06-17days on market $82,000 Active 50 DOM
-
2026-06-16days on market $82,000 Active 49 DOM
-
2026-06-15days on market $82,000 Active 48 DOM
-
2026-06-13days on market $82,000 Active 46 DOM
-
2026-06-09days on market $82,000 Active 42 DOM
-
2026-06-08remarks 699-char remark
-
2026-06-08days on market $82,000 Active 41 DOM
-
2026-06-07days on market $82,000 Active 40 DOM
-
2026-06-05days on market $82,000 Active 37 DOM
-
2026-06-03days on market $82,000 Active 36 DOM
-
2026-06-02days on market $82,000 Active 35 DOM
-
2026-06-01days on market $82,000 Active 34 DOM
-
2026-05-31days on market $82,000 Active 33 DOM
-
2026-04-28$94,500 Active 532-char remark
ⓘ Source: listings_history table (triggers on properties + properties_extension) + one-shot
backfill from property_details.listing_events for pre-trigger history.
Tax reassessment forecast IL · Partial reset (capped growth)
- Current annual tax
- $1,489 · $124/mo
- Projected year-2 tax
- $1,675 · $140/mo
- Expected delta
- +$186/yr (+$16/mo · 12.5%)
ⓘ Screening estimate from a state-policy table — verify with the county assessor before closing.
Climate risk First Street
- Flood 1/10 Low FEMA zone X · 0% chance over 30 yrs
- Wildfire 1/10 Low
- Heat 5/10 Major 7 d/yr ≥107°F today · 20 d/yr by 30 yrs out
- Wind 2/10 Low 100% chance of damaging wind over 30 yrs
- Air quality 4/10 Moderate 5 unhealthy d/yr today · 6 by 30 yrs out
Nearby sold comps map
Loading sold comps map…
Walkable amenities ~0.75 mi
Loading nearby amenities…
Taxation est. · year 1
- Rental income
- $11,857
- − Mortgage interest
- −$4,593
- − Property taxes
- −$1,489
- − Insurance
- −$410
- − Repairs & maintenance
- −$949
- − Management
- −$949
- − Depreciation
- −$2,385
- Taxable income
- $1,083
- Est. tax owed @ 24.0%
- −$260
- After-tax cash flow
- $2,049/yr
For passive investors: Depreciation is non-cash, so a rental often shows a tax loss while cash-flowing — sheltering income. Rental losses are passive: they offset passive income freely, and up to $25,000/yr can offset ordinary (W-2) income if you actively participate and your MAGI is under $100k (phasing out to $0 by $150k); unused losses carry forward. On sale, claimed depreciation is recaptured at up to 25%, and gains may owe capital-gains tax (a 1031 exchange can defer both). Figures are a year-1 estimate at your 24.0% rate — not tax advice; consult a CPA.
Schools (NCES district)
- District
- Roxana CUSD 1
- NCES district ID
- 1735010
- Math proficiency
- 18% ▼ -8.00%
- Reading proficiency
- 19% ▼ -11.00%
- Median HH income
- $50,661
- Composite
- 16.73/100
- National rank
- #9164
- State rank
- #440 of 620 in IL
Livability — South Roxana
- Score
- 58/100
- State rank
- #1141
- US rank
- #21542
Category grades
Schools grade is shown separately in the Schools card above.
Census & demographics
- Census place
- South Roxana, IL
- Population (ZIP)
- 2,180
Population outlook (Madison County) Hauer SSP2
- Today (2025)
- 258,371 people
- By 2030
- 251,523 · -2.7%
- By 2040
- 233,640 · -9.6%
- By 2050
- 213,042 · -17.5%
- By 2075
- 165,255 · -36.0%
- By 2100
- 123,953 · -52.0%
Race, ethnicity, and origin ACS 2023
- Neighborhood character
- Predominantly White (85%)
- Race & ethnicity
- White 85% Two or more races 9% Hispanic / Latino 5% Black 4%
- Common ancestry
- Iranian 2% Slovak 2% Lithuanian 2%
- Foreign-born
- 2% · Canada
- Languages at home
- 94% English-only · Spanish 6%
Political lean MEDSL · Madison
- 2024 margin
- R (+13.3) · D 42.5% · R 55.8% · Other 1.8%
- 2008→2024 swing
- -22.5pp toward R · 2008: 9.2pp · 2024: -13.3pp
- All cycles
- 2024: R+13.3 2020: R+13.2 2016: R+15.6 2012: R+1.4 2008: D+9.2
Not yet ingested
- Civics
- —
Market trends
- HPI YoY
- —
- Current HPI
- —
- Rent YoY
- —
- Metro
- —
- State GDP YoY
- ▲ 1.59%
- F500 in state
- 60
Industry mix (Fortune 500 HQ in IL)
| Industry | F500 HQs | Revenue |
|---|---|---|
| Insurance | 4 | $201B |
|
||
| Consumer Goods | 4 | $87B |
|
||
| Industrial Machinery | 3 | $64B |
|
||
| Healthcare | 2 | $55B |
|
||
| Retail / Pharmacy | 1 | $148B |
|
||
| Agriculture / Food | 1 | $86B |
|
||
Price history
-13.2% since first listed2 events — show timeline
- 2026-05-28 Price Changed $82,000 MARIS as Distributed by MLS Grid
- 2026-04-28 Listed $94,500 MARIS as Distributed by MLS Grid
Property tax history
+2.4%/yrLatest (2024): $1,489 · +5.3% YoY. Source: county tax records.
Cash-flow waterfall
monthlySold comps — $/sqft
last 12 mo · ≤1 miLoading sold comps…