 Multi-family
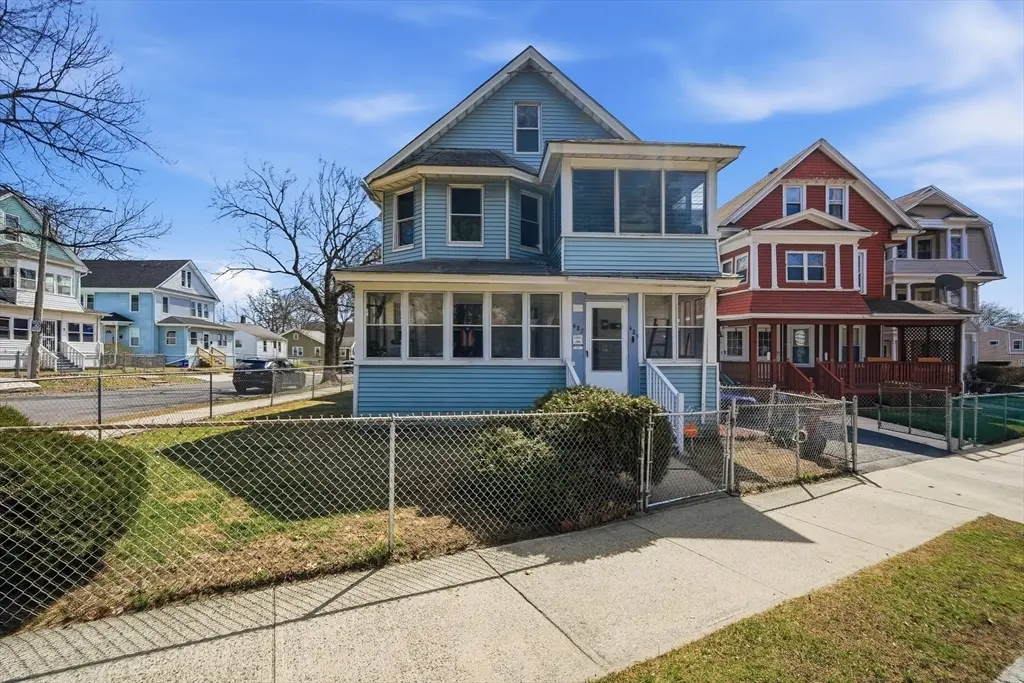
485 Bay St · Springfield, MA
Flood risk No data
- FEMA flood zone
- —
- Chance of flooding over 30 yrs
- —
- Est. flood insurance / yr
- —
Fire risk No data
- Est. fire insurance / yr
- —
Heat risk No data
- Hot days now (above threshold)
- —
- Hot days in 30 yrs
- —
Wind risk No data
- Chance of severe wind over 30 yrs
- —
Air-quality risk No data
- Unhealthy air days now
- —
- Unhealthy air days in 30 yrs
- —
Risk factors via First Street. Map © Google.
Why this score? — see what drove the D grade
The composite is a weighted blend of 9 inputs, each scored 0–100. Each bar is that input's sub-score; the figure is the points it added to the 100-point composite (weight × sub-score).
- Cash flow +19.7/30.0
- DSCR +6.2/10.0
- 1% rule +4.5/10.0
- Livability +3.7/5.0
- ARV discount +2.7/15.0
- Rent growth +2.5/5.0
- Condition / age +2.5/5.0
- Schools +1.6/10.0
- Appreciation +0.0/10.0
$399,000
🖨 Deal sheet (PDF) 📄 Offer letter ✓ Due diligence
Multi-family units
County records classify this as Multi-Family (2-4 Unit). Listing-text estimate: 1 unit. estimate disagrees with records
Listing remarks MLS
Well-maintained multi-family opportunity offering strong income potential. This property features teo units with spacious layouts, separate utilities, and off-street parking. Conveniently located near shopping, public transportation, schools, and major routes. Ideal for investors or owner-occupants looking to build equity while generating rental income. Property offers solid bones with upside potential for increased rents or value-add improvements. Easy access to local amenities and highways. Don’t miss this opportunity to own a versatile income-producing property in a convenient Springfield location.
Key facts
- Spacious layouts
- Separate utilities
- Solid bones
Tags
Neighborhood map
What this means for you Summary
Snapshot
- This is a 6-bed/3.0-bath multifamily listed at $399k.
Deal economics
- At list price, monthly cash flow is $468 ($6k/yr) — positive.
- The deal already cash-flows at list — no discount required.
- To meet the 1% rule (rent ≥ 1% of price), the offer needs to be $380k (4.8% below list).
- Recommended offer: $375k (6.0% below list) — sets the bar for market timing.
- Cap rate 7.7% vs local median 5.0% in Springfield — top-decile yield for the area; either an underpriced asset or a hidden risk that comps aren't pricing in. Stress-test before assuming the spread holds.
Location & tenants
- Location reads 73/100 on livability (#97 in MA) — a middle-class / working-renter tenant base. Strengths: commute A+, health & safety A+, amenities A; Watch: crime F, employment D-.
- Springfield (urban): math 13% / reading 25% proficiency, ranked #296 of 302 in MA (top 98%) — low school quality limits family demand, transient renter base, plan for 1-2y turnover; 81% free/reduced lunch — lower-income household profile, screen leases tightly.
- Zoned schools: Rebecca M Johnson (math 9% / reading 26%, grade F, #811 of 938 statewide, top 87%, 579 students, 0% FRL); John F Kennedy Middle (math 5% / reading 11%, grade F, #297 of 305 statewide, top 97%, 390 students, 0% FRL); Springfield Central High (math 27% / reading 41%, grade F, #250 of 343 statewide, top 73%, 2,095 students, 0% FRL) — zoned schools average 0% FRL vs 81% district-wide (81 pts lower); this property's tenant base skews higher-income than the district average.
- Market conditions: 38 active listings in the ZIP; 2 comparable units currently listed for rent nearby; 453 units permitted in Hampden County in 2024 (116 in 5+ unit buildings).
- At $3,800/mo this rent would consume 94% of the median local household income ($48k/yr) (locally 1322% of renters already pay >50% of income on rent) — very limited rent-growth headroom before tenants either downsize or default.
Forward outlook
- Local home prices are declining (-3.0%/yr); year-one equity from $3k of loan paydown is wiped out by about $12k of value loss. Plan a longer hold.
- Hampden County population projected at +5% by 2050 — modest demand growth; plan on rents tracking national, not racing it.
Negotiation context
- It's been on market 82 days — a 6% lower offer ($375k) is reasonable based on typical stale-listing flexibility.
- Current owner paid $85k; list at $399k implies a 369% gain — meaningful room to come down on a strong offer.
Risks & watch-outs
- Watch-outs: built in 1922 — expect roof / HVAC / electrical / plumbing capex.
Questions for the listing agent
- It's been on market 82 days. Have you received any prior offers? Is the seller open to a 6% concession, seller financing, or rate buy-down credit?
- Built in 1922 — when were the roof, HVAC, electrical panel, plumbing, and water heater last replaced?
- Why hasn't it sold? Are there any deal-killer items the seller is aware of (foundation, flood, title, zoning, code violations)?
- Is there a deadline driving the sale (1031 exchange, divorce, estate, relocation)? That informs how much negotiation room exists.
- Schools are D-rated, which usually means shorter tenancies and higher turnover. Who's the typical renter profile here, and what's been the actual vacancy rate?
- Crime grade is F in this area — have there been break-ins, vandalism, or insurance claims at this property in the last 3 years? What carrier currently insures it and at what premium?
- The area grade is low — what's the realistic commute time and amenity access for the typical tenant pool here? Any planned neighborhood developments (good or bad) we should know about?
- What's the average days-on-market for RENTAL listings here right now (not sales)? A rising rental-DOM trend means longer vacancies and softer asking-rent achievability than the comps imply.
- What's the recent tenant-quality profile in this submarket — average credit score on applications, eviction rate, late-payment / NSF rate, and stable-employment percentage? A property-management company in the area should have these aggregated.
- How much new apartment / multifamily construction is in the pipeline within 1–3 miles? Heavy new supply (>2% of stock underway) typically softens rents 12–24 months out; light construction supports rent growth.
Investment metrics
- 1% rule
- 0.95% ✗
- Cap rate
- 7.70%
- Cash-on-cash
- 5.03%
- DSCR
- 1.22
- GRM
- 8.8
CMA / ARV
- ARV (median comp)
- $360,478
- List price
- $399,000
- Delta
- 10.69%
- Verdict
- OVERPRICED
- Comps
- 20 within 1.0 mi
Show comp detail 10 sales within ~0.75 mi
| Address | Dist | Beds/Ba | Sqft | Sold | Price | $/sf | Match |
|---|---|---|---|---|---|---|---|
| 16-20 Cambridge St | 0.14mi | 6/3.0 | 2,800 (+5%) | 1mo | $540,000 | $193 | 84 |
| 15-17 Sycamore St | 0.02mi | 6/2.0 | 2,340 (-12%) | 3mo | $390,000 | $167 | 72 |
| 73-75 Kenyon St | 0.23mi | 6/2.0 | 2,602 (-2%) | 15mo | $285,000 | $110 | 68 |
| 142-144 Yale St | 0.26mi | 7/3.0 (+1) | 2,798 (+5%) | 13mo | $400,000 | $143 | 64 |
| 148-150 Oak Grove Ave | 0.28mi | 7/3.0 (+1) | 2,897 (+8%) | 8mo | $320,000 | $110 | 60 |
| 62-64 Catharine St | 0.57mi | 6/2.5 | 2,746 (+3%) | 17mo | $285,000 | $104 | 52 |
| 151-153 Catharine | 0.43mi | 6/3.0 | 2,400 (-10%) | 18mo | $455,000 | $190 | 48 |
| 43 Colonial Ave | 0.70mi | 7/4.0 (+1) | 2,514 (-6%) | 6mo | $230,000 | $91 | 44 |
| 95 Dawes St | 0.30mi | 6/2.5 | 2,339 (-12%) | 24mo | $320,000 | $137 | 43 |
| 36-38 Dearborn St | 0.70mi | 6/2.0 | 2,538 (-5%) | 17mo | $350,000 | $138 | 41 |
Match score weights: distance 35% · size 25% · config 20% · recency 20%. Top-matched comps best support the ARV.
Projected returns pro-forma
-3.0% appreciation · 3.0% rent growth · sell at horizon
- IRR
- -8.5%
- Equity multiple
- 0.69×
- Total profit
- $-34,927
- Equity at exit
- $59,492
- IRR
- 1.0%
- Equity multiple
- 1.07×
- Total profit
- $7,644
- Equity at exit
- $34,498
Cash invested: $111,720 (down + closing). Projections, not guarantees.
Landlord ↔ Tenant lean methodology
- Overall (STATE)
- 20 Strongly Tenant-Friendly
- State Massachusetts
- 20 Strongly Tenant-Friendly · D+15
- County
- — inherits STATE
- City
- — inherits STATE
ZIP-level market 01109
- Home prices YoY
- -22.8%
- Active inventory
- 38
- Price-to-rent
- 17.5×
Monthly cashflow live
- Estimated rent
- $3,800 high interval (Pro) →
- Mortgage (P&I)
- −$2,092
- Tax from tax record
- −$275 /mo · $3,304/yr
- Insurance
- −$166
- HOA
- −$0
- Vacancy / Maint / Mgmt
- −$798
- Net cashflow
- $468
Break-even live
Sensitivity live
| Price | -10% $694 | -5% $581 | +0% $468 | +5% $355 | +10% $242 |
|---|---|---|---|---|---|
| Rent | -10% $168 | -5% $318 | +0% $468 | +5% $618 | +10% $768 |
| Rate | -1.0pp $669 | -0.5pp $569 | base $468 | +0.5pp $365 | +1.0pp $259 |
2-unit breakdown (identical units grouped — click to expand)
| Units | Beds | Baths | Est. rent |
|---|---|---|---|
| 2× units | 2 | 1 | $3,800 |
| #1 | 2 | 1 | $1,900 |
| #2 | 2 | 1 | $1,900 |
| Total (2 units) | $3,800 | ||
UW: 25.0% down · 7.5% · 30yr · 1.5% tax · 5.0% vac · 8.0% maint · 8.0% mgmt
Financing live
Cash to close
- Down payment
- $99,750
- Closing costs
- $11,970
- Reserves months
- —
- Total cash needed
- —
Loan-product check · same deal, 3 products live
Conventional
25% down · 7.5% · 30yr
- Down + closing
- —
- Monthly P&I
- —
- Monthly cashflow
- —
- DSCR
- —
- Eligible?
- —
Personal DTI + credit; lowest rate.
DSCR
20% down · 8.5% · 30yr
- Down + closing
- —
- Monthly P&I
- —
- Monthly cashflow
- —
- DSCR
- —
- Eligible?
- —
No personal income docs; deal must DSCR.
Hard money
10% down · 12.0% · 12mo
- Down + closing
- —
- Monthly P&I
- —
- Monthly cashflow
- —
- DSCR
- —
- Eligible?
- —
Short-term bridge; refi at stabilization.
Rent comps 2 comps
| Address | Beds | Baths | Sqft | Rent | $/sqft | DOM | Units | Dist |
|---|---|---|---|---|---|---|---|---|
| 834 Worthington St Unit 2nd Fl Springfield, MA | 5.0 | 1.0 | 1841 | $2,450 | $1.33 | 23d | 1 | 1.21mi |
| 296 Hancock St Springfield, MA | 6.0 | 2.0 | 2000 | $2,900 | $1.45 | 45d | 1 | 1.40mi |
Listing history 23 events
-
2026-06-22days on market $399,000 Active 82 DOM
-
2026-06-18days on market $399,000 Active 79 DOM
-
2026-06-17days on market $399,000 Active 78 DOM
-
2026-06-16days on market $399,000 Active 77 DOM
-
2026-06-15days on market $399,000 Active 76 DOM
-
2026-06-14days on market $399,000 Active 74 DOM
-
2026-06-13days on market $399,000 Active 73 DOM
-
2026-06-10days on market $399,000 Active 71 DOM
-
2026-06-09days on market $399,000 Active 70 DOM
-
2026-06-08days on market $399,000 Active 69 DOM
-
2026-06-07days on market $399,000 Active 68 DOM
-
2026-06-05days on market $399,000 Active 65 DOM
-
2026-06-03days on market $399,000 Active 64 DOM
-
2026-06-02days on market $399,000 Active 63 DOM
-
2026-06-01statusdays on market $399,000 Active 62 DOM
-
2026-05-31days on market $399,000 Price Changed 61 DOM
-
2026-05-30days on market $399,000 Price Changed 60 DOM
-
2026-05-15price $420,000 614-char remark
Show marketing remark (614 chars)
Well-maintained multi-family opportunity offering strong income potential. This property features teo units with spacious layouts, separate utilities, and off-street parking. Conveniently located near shopping, public transportation, schools, and major routes. Ideal for investors or owner-occupants looking to build equity while generating rental income. Property offers solid bones with upside potential for increased rents or value-add improvements. Easy access to local amenities and highways. Don’t miss this opportunity to own a versatile income-producing property in a convenient Springfield location.
-
2026-05-08price $425,000 614-char remark
Show marketing remark (614 chars)
Well-maintained multi-family opportunity offering strong income potential. This property features teo units with spacious layouts, separate utilities, and off-street parking. Conveniently located near shopping, public transportation, schools, and major routes. Ideal for investors or owner-occupants looking to build equity while generating rental income. Property offers solid bones with upside potential for increased rents or value-add improvements. Easy access to local amenities and highways. Don’t miss this opportunity to own a versatile income-producing property in a convenient Springfield location.
-
2026-04-30price $430,000 614-char remark
Show marketing remark (614 chars)
Well-maintained multi-family opportunity offering strong income potential. This property features teo units with spacious layouts, separate utilities, and off-street parking. Conveniently located near shopping, public transportation, schools, and major routes. Ideal for investors or owner-occupants looking to build equity while generating rental income. Property offers solid bones with upside potential for increased rents or value-add improvements. Easy access to local amenities and highways. Don’t miss this opportunity to own a versatile income-producing property in a convenient Springfield location.
-
2026-04-14price $440,000 614-char remark
Show marketing remark (614 chars)
Well-maintained multi-family opportunity offering strong income potential. This property features teo units with spacious layouts, separate utilities, and off-street parking. Conveniently located near shopping, public transportation, schools, and major routes. Ideal for investors or owner-occupants looking to build equity while generating rental income. Property offers solid bones with upside potential for increased rents or value-add improvements. Easy access to local amenities and highways. Don’t miss this opportunity to own a versatile income-producing property in a convenient Springfield location.
-
2026-03-31$450,000 New 614-char remark
Show marketing remark (614 chars)
Well-maintained multi-family opportunity offering strong income potential. This property features teo units with spacious layouts, separate utilities, and off-street parking. Conveniently located near shopping, public transportation, schools, and major routes. Ideal for investors or owner-occupants looking to build equity while generating rental income. Property offers solid bones with upside potential for increased rents or value-add improvements. Easy access to local amenities and highways. Don’t miss this opportunity to own a versatile income-producing property in a convenient Springfield location.
-
2006-01-19soldstatus $85,000
ⓘ Source: listings_history table (triggers on properties + properties_extension) + one-shot
backfill from property_details.listing_events for pre-trigger history.
Tax reassessment forecast MA · Partial reset (capped growth)
- Current annual tax
- $3,304 · $275/mo
- Projected year-2 tax
- $4,106 · $342/mo
- Expected delta
- +$802/yr (+$67/mo · 24.3%)
ⓘ Screening estimate from a state-policy table — verify with the county assessor before closing.
Nearby sold comps map
Loading sold comps map…
Walkable amenities ~0.75 mi
Loading nearby amenities…
Taxation est. · year 1
- Rental income
- $45,600
- − Mortgage interest
- −$22,350
- − Property taxes
- −$3,304
- − Insurance
- −$1,995
- − Repairs & maintenance
- −$3,648
- − Management
- −$3,648
- − Depreciation
- −$11,607
- Taxable loss
- −$952
- Est. tax savings @ 24.0%
- +$229
- After-tax cash flow
- $5,845/yr
For passive investors: Depreciation is non-cash, so a rental often shows a tax loss while cash-flowing — sheltering income. Rental losses are passive: they offset passive income freely, and up to $25,000/yr can offset ordinary (W-2) income if you actively participate and your MAGI is under $100k (phasing out to $0 by $150k); unused losses carry forward. On sale, claimed depreciation is recaptured at up to 25%, and gains may owe capital-gains tax (a 1031 exchange can defer both). Figures are a year-1 estimate at your 24.0% rate — not tax advice; consult a CPA.
Schools (NCES district)
- District
- Springfield
- NCES district ID
- 2511130
- Math proficiency
- 13% ▼ -12.00%
- Reading proficiency
- 25% ▼ -5.00%
- Median HH income
- $34,938
- Composite
- 15.6/100
- National rank
- #9293
- State rank
- #296 of 302 in MA
Livability — Springfield
- Score
- 73/100
- State rank
- #97
- US rank
- #5195
Category grades
Schools grade is shown separately in the Schools card above.
Census & demographics
- Census place
- Springfield, MA
- County
- Hampden County · 230,965 people
- City population
- 61,006
- Metro
- Springfield, MA
- Population (ZIP)
- 31,124
- Household income
- $48,415
- Rent vs Own
- Severe rent burden
- 1322.0
Population outlook (Hampden County) Hauer SSP2
- Today (2025)
- 485,646 people
- By 2030
- 491,517 · +1.2%
- By 2040
- 500,539 · +3.1%
- By 2050
- 508,827 · +4.8%
- By 2075
- 539,167 · +11.0%
- By 2100
- 545,698 · +12.4%
Race, ethnicity, and origin ACS 2023
- Neighborhood character
- Diverse neighborhood (Simpson 0.67)
- Race & ethnicity
- Hispanic / Latino 45% Black 31% Two or more races 20% White 18% Asian 1% Native American 1%
- Hispanic origin (detail)
- Puerto Rican 39% Dominican 3%
- Common ancestry
- Lithuanian 2% Romanian 1%
- Foreign-born
- 9% · Canada, China
- Languages at home
- 65% English-only · Spanish 32% Other Asian/Pacific 1% Russian/Polish/Slavic 1%
Political lean MEDSL · Hampden
- 2024 margin
- Lean D (+8.9) · D 53.4% · R 44.5% · Other 2.1%
- 2008→2024 swing
- -16.4pp toward R · 2008: 25.3pp · 2024: 8.9pp
- All cycles
- 2024: D+8.9 2020: D+17.7 2016: D+16.0 2012: D+25.4 2008: D+25.3
Not yet ingested
- Civics
- —
Market trends
- HPI YoY
- ▼ -113.11%
- Current HPI
- 382.9038
- Rent YoY
- —
- Metro
- Springfield, MA
- State GDP YoY
- ▲ 2.28%
- F500 in state
- 38
Industry mix (Fortune 500 HQ in MA)
| Industry | F500 HQs | Revenue |
|---|---|---|
| Technology | 3 | $17B |
|
||
| Insurance | 2 | $84B |
|
||
| Retail | 2 | $76B |
|
||
| Life Sciences | 1 | $43B |
|
||
| Energy Technology | 1 | $31B |
|
||
| Aerospace / Defense | 1 | $18B |
|
||
Price history
+394.1% since first listed6 events — show timeline
- 2026-05-15 Price Changed $420,000 MLS PIN
- 2026-05-08 Price Changed $425,000 MLS PIN
- 2026-04-30 Price Changed $430,000 MLS PIN
- 2026-04-14 Price Changed $440,000 MLS PIN
- 2026-03-31 Listed $450,000 MLS PIN
- 2006-01-19 Sold (Public Records) $85,000 Public Records
Property tax history
+3.7%/yrLatest (2023): $3,304 · +1.0% YoY. Source: county tax records.
Cash-flow waterfall
monthlySold comps — $/sqft
last 12 mo · ≤1 miLoading sold comps…