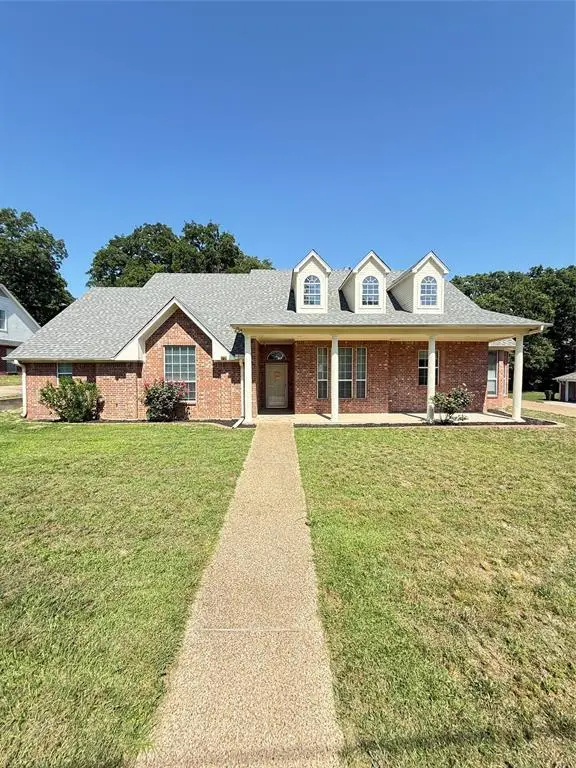
3814 Lamb Dr · Tyler, TX
Flood risk 1/10 · Minimal
- FEMA flood zone
- X (unshaded)
- Chance of flooding over 30 yrs
- 0.0%
- Est. flood insurance / yr
- $507 – $1,088
Fire risk 4/10 · Minor
- Est. fire insurance / yr
- $1,222 – $2,270
Heat risk 6/10 · Moderate
- Hot days now (above 109°F)
- 7 days/yr
- Hot days in 30 yrs
- 27 days/yr
Wind risk 6/10 · Moderate
- Chance of severe wind over 30 yrs
- 65.0%
Air-quality risk 2/10 · Minimal
- Unhealthy air days now
- 0 days/yr
- Unhealthy air days in 30 yrs
- 1 days/yr
Risk factors via First Street. Map © Google.
Why this score? — see what drove the C grade
The composite is a weighted blend of 9 inputs, each scored 0–100. Each bar is that input's sub-score; the figure is the points it added to the 100-point composite (weight × sub-score).
- Cash flow +19.1/30.0
- ARV discount +13.1/15.0
- DSCR +6.0/10.0
- 1% rule +5.2/10.0
- Livability +3.8/5.0
- Schools +3.3/10.0
- Rent growth +2.5/5.0
- Condition / age +2.5/5.0
- Appreciation +0.0/10.0
$439,900
🖨 Deal sheet 📄 Offer letter ✓ Due diligence
Listing remarks
Beautifully refreshed 3-bedroom, 2.5-bath traditional home in established Briarwood Estates, minutes from Cascades. This 2,760 sq ft single-story home sits on a generous . 37-acre lot and has been thoughtfully updated and is move-in ready. Recent improvements include: a brand new roof, new HVAC system, fresh exterior paint, updated landscaping, and a professional cleaning throughout. Features include a 2-car garage, spacious living areas, and a functional floor plan ideal for family living or entertaining. Located in Tyler ISD, with easy access to schools, shopping, and dining. Major mechanical systems just replaced means peace of mind from day one. Don't miss this turnkey opportunity in on
Key facts
- Updated landscaping
- Fresh exterior paint
- New roof
Tags
Property features AI
Finance
- Other: Property is treated as clear for loan purposes; No second mortgage reported
- Financial info: Special listing condition: Real Estate Owned; Listing agreement: Exclusive Right To Sell
- HOA & community: No association (no HOA)
Exterior
- Parking: Attached 2-car garage; 2 covered parking spaces; Driveway
- Security: No specific security features listed
- Utilities: City water; City sewer; No municipal utility district
- Home design: Single family residence; Residential property; One story
- Construction: Brick construction; Composition roof; Built in 2003
- Exterior features: Less than 0.5 acre lot; Subdivision: Briarwood Estates; Directions available
Interior
- Kitchen: Dishwasher; Electric oven; Gas cooktop; Microwave; Kitchen island; Granite counters; Eat-in kitchen
- Bedrooms: 3 bedrooms; Primary bedroom on main level
- Flooring: Flooring details not provided
- Bathrooms: 3 full bathrooms
- Heating & cooling: Central heating (electric); Central air; Ceiling fan(s)
- Interior features: Built-in features; Eat-in kitchen; Granite counters; Kitchen island; Walk-in closet(s); Two living areas; One dining area; One level home
- Laundry & utility: Laundry/utility details not provided
Neighborhood map
What this means for you Summary
Snapshot
- This is a 3-bed/2.5-bath single-family listed at $440k.
Deal economics
- At list price, monthly cash flow is $470 ($6k/yr) — positive.
- The deal already cash-flows at list — no discount required.
- Meets the 1% rule at list price ($4k rent vs $440k).
- Recommended offer: $433k (1.5% below list) — sets the bar for market timing.
- Cap rate 7.6% vs local median 3.6% in Tyler — top-decile yield for the area; either an underpriced asset or a hidden risk that comps aren't pricing in. Stress-test before assuming the spread holds.
Location & tenants
- Location reads 75/100 on livability (#147 in TX, #4,181 nationally) — a middle-class / working-renter tenant base. Strengths: cost of living A+, housing A+, health & safety A+; Watch: employment C-, crime D+, commute F.
- Tyler ISD (urban): math 39% / reading 38% proficiency, ranked #449 of 826 in TX (top 54%) — families likely to look elsewhere, expect single-tenant / working-renter base with shorter leases; 66% free/reduced lunch — lower-income household profile, screen leases tightly.
- Zoned schools: Dixie El (math 28% / reading 24%, grade F, #2,954 of 4,322 statewide, top 69%, 616 students, 92% FRL) — zoned schools average 92% FRL vs 66% district-wide (27 pts higher); higher-poverty schools than district average — tighter screening recommended.
- Zoned-school proficiency averages 26% at this address vs 38% district-wide (-12 pts) — the specific schools serving this property underperform the Tyler ISD average; the district grade overstates school quality for this exact location.
- Market conditions: 90 active listings in the ZIP; 1 comparable units currently listed for rent nearby; 595 units permitted in Smith County in 2024 (45 in 5+ unit buildings).
Forward outlook
- Local home prices are declining (-3.0%/yr); year-one equity from $3k of loan paydown is wiped out by about $13k of value loss. Plan a longer hold.
- Smith County population projected at +24% by 2050 — long-run rental-demand tailwind backs the buy-and-hold thesis.
Negotiation context
- It's been on market 30 days — a 2% lower offer ($433k) is reasonable based on typical stale-listing flexibility.
Risks & watch-outs
- Climate carrying-cost: major wind risk, 65% chance of damaging wind over 30y; extreme-heat days projected 7→27/yr by 2055 (HVAC capex compounding) — expect insurance premiums to compound above CPI over the hold.
Questions for the listing agent
- Is there a deadline driving the sale (1031 exchange, divorce, estate, relocation)? That informs how much negotiation room exists.
- Schools are D-rated, which usually means shorter tenancies and higher turnover. Who's the typical renter profile here, and what's been the actual vacancy rate?
- Crime grade is D in this area — have there been break-ins, vandalism, or insurance claims at this property in the last 3 years? What carrier currently insures it and at what premium?
- What's the average days-on-market for RENTAL listings here right now (not sales)? A rising rental-DOM trend means longer vacancies and softer asking-rent achievability than the comps imply.
- What's the recent tenant-quality profile in this submarket — average credit score on applications, eviction rate, late-payment / NSF rate, and stable-employment percentage? A property-management company in the area should have these aggregated.
- How much new for-sale + rental construction is in the pipeline within 1–3 miles? Heavy new supply typically softens prices + rents 12–24 months out; constrained supply supports both.
Investment metrics
- 1% rule
- 1.02% ✓
- Cap rate
- 7.57%
- Cash-on-cash
- 4.57%
- DSCR
- 1.20
- GRM
- 8.1
CMA / ARV
- ARV (on-the-fly)
- $502,320
- Comps found
- 1
Show comp detail 1 sale within ~0.75 mi
| Address | Dist | Beds/Ba | Sqft | Sold | Price | $/sf | Match |
|---|---|---|---|---|---|---|---|
| 3928 Hogan Dr | 0.44mi | 4/2.5 (+1) | 2,471 (-10%) | 6mo | $449,900 | $182 | 52 |
Match score weights: distance 35% · size 25% · config 20% · recency 20%. Top-matched comps best support the ARV.
Projected returns pro-forma
-3.0% appreciation · 3.0% rent growth · sell at horizon
- IRR
- -9.1%
- Equity multiple
- 0.66×
- Total profit
- $-41,281
- Equity at exit
- $65,591
- IRR
- 0.3%
- Equity multiple
- 1.02×
- Total profit
- $2,952
- Equity at exit
- $38,035
Cash invested: $123,172 (down + closing). Projections, not guarantees.
Landlord ↔ Tenant lean methodology
- Overall (STATE)
- 87 Strongly Landlord-Friendly
- State Texas
- 87 Strongly Landlord-Friendly · R+5
- County
- — inherits STATE
- City
- — inherits STATE
ZIP-level market 75709
- Home prices YoY
- -16.5%
- Active inventory
- 90
- Price-to-rent
- 8.1×
Monthly cashflow live
- Estimated rent
- $4,500 medium interval (Pro) →
- Mortgage (P&I)
- −$2,307
- Tax from tax record
- −$595 /mo · $7,143/yr
- Insurance
- −$183
- HOA
- −$0
- Vacancy / Maint / Mgmt
- −$945
- Net cashflow
- $470
Break-even live
UW: 25.0% down · 7.5% · 30yr · 1.5% tax · 5.0% vac · 8.0% maint · 8.0% mgmt
Financing live
Cash to close
- Down payment
- $109,975
- Closing costs
- $13,197
- Reserves months
- —
- Total cash needed
- —
Loan-product check · same deal, 3 products live
Conventional
25% down · 7.5% · 30yr
- Down + closing
- —
- Monthly P&I
- —
- Monthly cashflow
- —
- DSCR
- —
- Eligible?
- —
Personal DTI + credit; lowest rate.
DSCR
20% down · 8.5% · 30yr
- Down + closing
- —
- Monthly P&I
- —
- Monthly cashflow
- —
- DSCR
- —
- Eligible?
- —
No personal income docs; deal must DSCR.
Hard money
10% down · 12.0% · 12mo
- Down + closing
- —
- Monthly P&I
- —
- Monthly cashflow
- —
- DSCR
- —
- Eligible?
- —
Short-term bridge; refi at stabilization.
Rent comps 1 comps
| Address | Beds | Baths | Sqft | Rent | $/sqft | DOM | Units | Dist |
|---|---|---|---|---|---|---|---|---|
| 2801 Wexford Dr Tyler, TX | 3.0 | 2.0 | 2339 | $4,500 | $1.92 | 21d | 1 | 0.19mi |
Listing history 18 events
-
2026-06-19days on market $439,900 Active 30 DOM
-
2026-06-18days on market $439,900 Active 29 DOM
-
2026-06-17days on market $439,900 Active 28 DOM
-
2026-06-16days on market $439,900 Active 27 DOM
-
2026-06-15days on market $439,900 Active 26 DOM
-
2026-06-14days on market $439,900 Active 24 DOM
-
2026-06-13days on market $439,900 Active 23 DOM
-
2026-06-10days on market $439,900 Active 21 DOM
-
2026-06-09days on market $439,900 Active 20 DOM
-
2026-06-08days on market $439,900 Active 19 DOM
-
2026-06-07days on market $439,900 Active 18 DOM
-
2026-06-05days on market $439,900 Active 15 DOM
-
2026-06-02days on market $439,900 Active 13 DOM
-
2026-06-01days on market $439,900 Active 12 DOM
-
2026-05-31days on market $439,900 Active 11 DOM
-
2026-05-30days on market $439,900 Active 10 DOM
-
2026-05-11$439,900 Active
-
2003-08-25soldstatus
ⓘ Source: listings_history table (triggers on properties + properties_extension) + one-shot
backfill from property_details.listing_events for pre-trigger history.
Tax reassessment forecast TX · Resets to sale price
- Current annual tax
- $7,143 · $595/mo
- Projected year-2 tax
- $8,050 · $671/mo
- Expected delta
- +$907/yr (+$76/mo · 12.7%)
ⓘ Screening estimate from a state-policy table — verify with the county assessor before closing.
Climate risk First Street
- Flood 1/10 Low FEMA zone X (unshaded) · 0% chance over 30 yrs
- Wildfire 4/10 Moderate
- Heat 6/10 Major 7 d/yr ≥109°F today · 27 d/yr by 30 yrs out
- Wind 6/10 Major 65% chance of damaging wind over 30 yrs
- Air quality 2/10 Low 0 unhealthy d/yr today · 1 by 30 yrs out
Nearby sold comps map
Loading sold comps map…
Walkable amenities ~0.75 mi
Loading nearby amenities…
Taxation est. · year 1
- Rental income
- $54,000
- − Mortgage interest
- −$24,641
- − Property taxes
- −$7,143
- − Insurance
- −$2,200
- − Repairs & maintenance
- −$4,320
- − Management
- −$4,320
- − Depreciation
- −$12,797
- Taxable loss
- −$1,421
- Est. tax savings @ 24.0%
- +$341
- After-tax cash flow
- $5,976/yr
For passive investors: Depreciation is non-cash, so a rental often shows a tax loss while cash-flowing — sheltering income. Rental losses are passive: they offset passive income freely, and up to $25,000/yr can offset ordinary (W-2) income if you actively participate and your MAGI is under $100k (phasing out to $0 by $150k); unused losses carry forward. On sale, claimed depreciation is recaptured at up to 25%, and gains may owe capital-gains tax (a 1031 exchange can defer both). Figures are a year-1 estimate at your 24.0% rate — not tax advice; consult a CPA.
Schools (NCES district)
- District
- Tyler ISD
- NCES district ID
- 4843470
- Math proficiency
- 39% ▼ -4.00%
- Reading proficiency
- 38% ▼ -1.00%
- Median HH income
- $44,090
- Composite
- 32.69/100
- National rank
- #5650
- State rank
- #449 of 826 in TX
Livability — Tyler
- Score
- 75/100
- State rank
- #147
- US rank
- #4181
Category grades
Schools grade is shown separately in the Schools card above.
Census & demographics
- Census place
- Tyler, TX
- City population
- 127,842
- Population (ZIP)
- 5,237
Population outlook (Smith County) Hauer SSP2
- Today (2025)
- 248,890 people
- By 2030
- 261,665 · +5.1%
- By 2040
- 286,114 · +15.0%
- By 2050
- 308,006 · +23.8%
- By 2075
- 354,171 · +42.3%
- By 2100
- 372,828 · +49.8%
Race, ethnicity, and origin ACS 2023
- Neighborhood character
- Diverse neighborhood (Simpson 0.67)
- Race & ethnicity
- White 43% Hispanic / Latino 33% Black 19% Two or more races 8% Asian 1%
- Hispanic origin (detail)
- Mexican 29%
- Common ancestry
- Slovak 3% Lithuanian 2% Serbian 1%
- Foreign-born
- 10% · Canada, Dominican Republic
- Languages at home
- 67% English-only · Spanish 31% Other Indo-European 1%
Political lean MEDSL · Smith
- 2024 margin
- Solid R (+45.1) · D 27.0% · R 72.1%
- 2008→2024 swing
- -5.6pp toward R · 2008: -39.5pp · 2024: -45.1pp
- All cycles
- 2024: R+45.1 2020: R+39.4 2016: R+43.9 2012: R+46.9 2008: R+39.5
Not yet ingested
- Civics
- —
Market trends
- HPI YoY
- ▼ -39.17%
- Current HPI
- 197.8711
- Rent YoY
- —
- Metro
- —
- State GDP YoY
- ▲ 3.95%
- F500 in state
- 110
Industry mix (Fortune 500 HQ in TX)
| Industry | F500 HQs | Revenue |
|---|---|---|
| Energy | 16 | $1,198B |
|
||
| Technology | 5 | $198B |
|
||
| Engineering / Construction | 4 | $72B |
|
||
| Energy Services | 3 | $60B |
|
||
| Utilities | 3 | $41B |
|
||
| Healthcare | 2 | $330B |
|
||
Price history
2 events — show timeline
- 2026-05-11 Listed $439,900 NTREIS
- 2003-08-25 Sold (Public Records) — Public Records
Property tax history
+2.3%/yrLatest (2024): $7,143 · +7.4% YoY. Source: county tax records.
Cash-flow waterfall
monthlySold comps — $/sqft
last 12 mo · ≤1 miLoading sold comps…