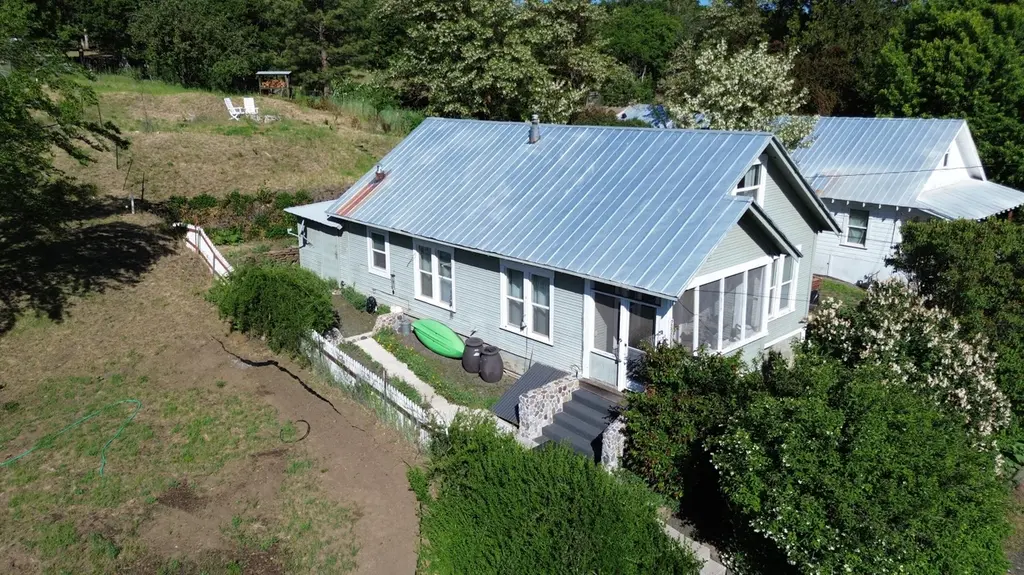
24806 Long St · Fall River Mills, CA
Flood risk 1/10 · Minimal
- FEMA flood zone
- X (unshaded)
- Chance of flooding over 30 yrs
- 0.0%
- Est. flood insurance / yr
- $507 – $1,088
Fire risk 7/10 · Major
- Est. fire insurance / yr
- $659 – $1,223
Heat risk 4/10 · Minor
- Hot days now (above 93°F)
- 7 days/yr
- Hot days in 30 yrs
- 17 days/yr
Wind risk 1/10 · Minimal
- Chance of severe wind over 30 yrs
- —
Air-quality risk 9/10 · Severe
- Unhealthy air days now
- 20 days/yr
- Unhealthy air days in 30 yrs
- 25 days/yr
Risk factors via First Street. Map © Google.
Why this score? — see what drove the D grade
The composite is a weighted blend of 9 inputs, each scored 0–100. Each bar is that input's sub-score; the figure is the points it added to the 100-point composite (weight × sub-score).
- Cash flow +13.2/30.0
- ARV discount +7.5/15.0
- Appreciation +6.4/10.0
- DSCR +4.0/10.0
- 1% rule +2.9/10.0
- Schools +2.7/10.0
- Livability +2.6/5.0
- Rent growth +2.5/5.0
- Condition / age +2.5/5.0
$225,000
🖨 Deal sheet (PDF) 📄 Offer letter ✓ Due diligence
Listing remarks MLS
4 bedroom home is Fall River Mills. Cute home within walking distance to stores, Fall River and Fall River Lake. Nice kitchen with tile countertops.
Key facts
- 6,969 sq ft lot
- Built 1912
Neighborhood map
What this means for you Summary
Snapshot
- This is a 4-bed/1.0-bath single-family listed at $225k.
Deal economics
- At list price, monthly cash flow is $-5 ($-64/yr) — negative.
- To cash-flow at today's rent, offer at most $224k (0.4% below list).
- To meet the 1% rule (rent ≥ 1% of price), the offer needs to be $178k (21.0% below list).
- Recommended offer: $178k (21.0% below list) — sets the bar for 1% rule.
Location & tenants
- Location reads 52/100 on livability (#1,038 in CA) — a working-class tenant base; expect higher turnover. Strengths: crime A, housing B; Watch: amenities F, commute F, employment F.
- Fall River Joint Unified (rural): math 28% / reading 35% proficiency, ranked #335 of 517 in CA (top 65%) — families likely to look elsewhere, expect single-tenant / working-renter base with shorter leases.
- Zoned schools: Fall River Elementary (math 27% / reading 37%, grade F, #779 of 1,571 statewide, top 52%, 282 students, 51% FRL); Fall River Junior-Senior High (math 47% / reading 57%, grade D+, #296 of 1,170 statewide, top 27%, 275 students, 41% FRL) — zoned schools at 46% FRL track the district average.
- Market conditions: 30 active listings in the ZIP; 246 units permitted in Shasta County in 2024 (0 in 5+ unit buildings).
Forward outlook
- In year one you build about $8k of equity ($2k loan paydown + $6k appreciation (2.9% local appreciation)).
- Shasta County population projected to shrink 9% by 2050 — rents likely to lag national; underwrite the cash flow, not the appreciation.
- At projected returns (2.9% appreciation + 3.0% rent growth), your $63k cash investment doubles in ~7 years — after that, you're playing with house money.
- By year 5, paydown + projected appreciation supports a ~$35k cash-out refi (75% LTV) — recoverable capital for the next deal without selling this one.
Negotiation context
- Only 0 days on market — expect competitive offers; lowballing is unlikely to land.
- 2 sale attempts since 5y ago; this cycle's ask has dropped $24k (10%) from the opening price — seller is motivated, your offer sets the floor, not the list.
- Current owner paid $140k; list at $225k implies a 61% gain — meaningful room to come down on a strong offer.
Risks & watch-outs
- Watch-outs: built in 1912 — expect roof / HVAC / electrical / plumbing capex.
- Climate carrying-cost: major wildfire risk — expect insurance premiums to compound above CPI over the hold.
Questions for the listing agent
- What do current leases actually rent for vs. the listed asking? Can we see a recent rent roll and the last 12 months of T-12 income?
- Built in 1912 — when were the roof, HVAC, electrical panel, plumbing, and water heater last replaced?
- Is there a deadline driving the sale (1031 exchange, divorce, estate, relocation)? That informs how much negotiation room exists.
- Schools are D-rated, which usually means shorter tenancies and higher turnover. Who's the typical renter profile here, and what's been the actual vacancy rate?
- The area grade is low — what's the realistic commute time and amenity access for the typical tenant pool here? Any planned neighborhood developments (good or bad) we should know about?
- What's the average days-on-market for RENTAL listings here right now (not sales)? A rising rental-DOM trend means longer vacancies and softer asking-rent achievability than the comps imply.
- What's the recent tenant-quality profile in this submarket — average credit score on applications, eviction rate, late-payment / NSF rate, and stable-employment percentage? A property-management company in the area should have these aggregated.
- How much new for-sale + rental construction is in the pipeline within 1–3 miles? Heavy new supply typically softens prices + rents 12–24 months out; constrained supply supports both.
Investment metrics
- 1% rule
- 0.79% ✗
- Cap rate
- 6.26%
- Cash-on-cash
- -0.10%
- DSCR
- 1.00
- GRM
- 10.5
CMA / ARV
No comps found within radius.
Projected returns pro-forma
2.87% appreciation · 3.0% rent growth · sell at horizon
- IRR
- 7.0%
- Equity multiple
- 1.40×
- Total profit
- $25,186
- Equity at exit
- $99,556
- IRR
- 9.8%
- Equity multiple
- 2.46×
- Total profit
- $91,977
- Equity at exit
- $152,184
Cash invested: $63,000 (down + closing). Projections, not guarantees.
Landlord ↔ Tenant lean methodology
- Overall (STATE)
- 18 Strongly Tenant-Friendly
- State California
- 18 Strongly Tenant-Friendly · D+13
- County
- — inherits STATE
- City
- — inherits STATE
ZIP-level market 96028
- Home prices YoY
- 2.0%
- Active inventory
- 30
- Price-to-rent
- 10.5×
Monthly cashflow live
- Estimated rent
- $1,778 medium interval (Pro) →
- Mortgage (P&I)
- −$1,180
- Tax from tax record
- −$136 /mo · $1,632/yr
- Insurance
- −$94
- HOA
- −$0
- Vacancy / Maint / Mgmt
- −$373
- Net cashflow
- $-5
Break-even live
Sensitivity live
| Price | -10% $122 | -5% $58 | +0% $-5 | +5% $-69 | +10% $-133 |
|---|---|---|---|---|---|
| Rent | -10% $-146 | -5% $-76 | +0% $-5 | +5% $65 | +10% $135 |
| Rate | -1.0pp $108 | -0.5pp $52 | base $-5 | +0.5pp $-64 | +1.0pp $-123 |
UW: 25.0% down · 7.5% · 30yr · 1.5% tax · 5.0% vac · 8.0% maint · 8.0% mgmt
Financing live
Cash to close
- Down payment
- $56,250
- Closing costs
- $6,750
- Reserves months
- —
- Total cash needed
- —
Loan-product check · same deal, 3 products live
Conventional
25% down · 7.5% · 30yr
- Down + closing
- —
- Monthly P&I
- —
- Monthly cashflow
- —
- DSCR
- —
- Eligible?
- —
Personal DTI + credit; lowest rate.
DSCR
20% down · 8.5% · 30yr
- Down + closing
- —
- Monthly P&I
- —
- Monthly cashflow
- —
- DSCR
- —
- Eligible?
- —
No personal income docs; deal must DSCR.
Hard money
10% down · 12.0% · 12mo
- Down + closing
- —
- Monthly P&I
- —
- Monthly cashflow
- —
- DSCR
- —
- Eligible?
- —
Short-term bridge; refi at stabilization.
Listing history 7 events
-
2025-05-19$249,000 Active
-
2021-05-28soldstatus $140,000 148-char remark
Show marketing remark (148 chars)
4 bedroom home is Fall River Mills. Cute home within walking distance to stores, Fall River and Fall River Lake. Nice kitchen with tile countertops.
-
2021-05-28soldstatus $140,000
Show marketing remark (148 chars)
4 bedroom home is Fall River Mills. Cute home within walking distance to stores, Fall River and Fall River Lake. Nice kitchen with tile countertops.
-
2021-01-25$149,000 148-char remark
Show marketing remark (148 chars)
4 bedroom home is Fall River Mills. Cute home within walking distance to stores, Fall River and Fall River Lake. Nice kitchen with tile countertops.
-
2014-10-15soldstatus $88,000
-
2005-12-06soldstatus $67,500
-
2003-02-05soldstatus $61,500
ⓘ Source: listings_history table (triggers on properties + properties_extension) + one-shot
backfill from property_details.listing_events for pre-trigger history.
Tax reassessment forecast CA · Resets to sale price
- Current annual tax
- $1,632 · $136/mo
- Projected year-2 tax
- $1,710 · $142/mo
- Expected delta
- +$78/yr (+$6/mo · 4.8%)
ⓘ Screening estimate from a state-policy table — verify with the county assessor before closing.
Climate risk First Street
- Flood 1/10 Low FEMA zone X (unshaded) · 0% chance over 30 yrs
- Wildfire 7/10 Severe
- Heat 4/10 Moderate 7 d/yr ≥93°F today · 17 d/yr by 30 yrs out
- Wind 1/10 Low
- Air quality 9/10 Extreme 20 unhealthy d/yr today · 25 by 30 yrs out
Nearby sold comps map
Loading sold comps map…
Walkable amenities ~0.75 mi
Loading nearby amenities…
Taxation est. · year 1
- Rental income
- $21,332
- − Mortgage interest
- −$12,603
- − Property taxes
- −$1,632
- − Insurance
- −$1,125
- − Repairs & maintenance
- −$1,707
- − Management
- −$1,707
- − Depreciation
- −$6,545
- Taxable loss
- −$3,987
- Est. tax savings @ 24.0%
- +$957
- After-tax cash flow
- $893/yr
For passive investors: Depreciation is non-cash, so a rental often shows a tax loss while cash-flowing — sheltering income. Rental losses are passive: they offset passive income freely, and up to $25,000/yr can offset ordinary (W-2) income if you actively participate and your MAGI is under $100k (phasing out to $0 by $150k); unused losses carry forward. On sale, claimed depreciation is recaptured at up to 25%, and gains may owe capital-gains tax (a 1031 exchange can defer both). Figures are a year-1 estimate at your 24.0% rate — not tax advice; consult a CPA.
Schools (NCES district)
- District
- Fall River Joint Unified
- NCES district ID
- 0613470
- Math proficiency
- 28% ▼ -9.00%
- Reading proficiency
- 35% ▼ -3.00%
- Median HH income
- $40,991
- Composite
- 26.57/100
- National rank
- #7186
- State rank
- #335 of 517 in CA
Livability — Fall River Mills
- Score
- 52/100
- State rank
- #1038
- US rank
- #25079
Category grades
Schools grade is shown separately in the Schools card above.
Census & demographics
- Census place
- Fall River Mills, CA
- Population (ZIP)
- 1,667
Population outlook (Shasta County) Hauer SSP2
- Today (2025)
- 179,231 people
- By 2030
- 176,953 · -1.3%
- By 2040
- 169,982 · -5.2%
- By 2050
- 162,547 · -9.3%
- By 2075
- 145,649 · -18.7%
- By 2100
- 123,025 · -31.4%
Race, ethnicity, and origin ACS 2023
- Neighborhood character
- Predominantly White (68%)
- Race & ethnicity
- White 68% Two or more races 23% Hispanic / Latino 22% Native American 3%
- Hispanic origin (detail)
- Mexican 21%
- Common ancestry
- Slovak 8% Romanian 5% Italian 4%
- Foreign-born
- 1% · Canada
- Languages at home
- 91% English-only · Spanish 8% German/W. Germanic 1%
Political lean MEDSL · Shasta
- 2024 margin
- Solid R (+36.5) · D 30.5% · R 67.0% · Other 2.5%
- 2008→2024 swing
- -10.7pp toward R · 2008: -25.8pp · 2024: -36.5pp
- All cycles
- 2024: R+36.5 2020: R+33.1 2016: R+37.4 2012: R+30.3 2008: R+25.8
Not yet ingested
- Civics
- —
Market trends
- HPI YoY
- ▲ 2.87%
- Current HPI
- 149.094
- Rent YoY
- —
- Metro
- —
- State GDP YoY
- ▲ 3.21%
- F500 in state
- 116
Industry mix (Fortune 500 HQ in CA)
| Industry | F500 HQs | Revenue |
|---|---|---|
| Technology | 27 | $1,492B |
|
||
| Financial Services | 3 | $174B |
|
||
| Retail | 3 | $44B |
|
||
| Insurance | 3 | $26B |
|
||
| Media / Entertainment | 2 | $115B |
|
||
| Pharmaceuticals / Biotech | 2 | $62B |
|
||
Price history
+304.9% since first listed7 events — show timeline
- 2025-05-19 Listed $249,000 SAOR
- 2021-05-28 Sold (Public Records) $140,000 Public Records
- 2021-05-28 Sold (MLS) $140,000 SAOR
- 2021-01-25 Listed $149,000 SAOR
- 2014-10-15 Sold (Public Records) $88,000 Public Records
- 2005-12-06 Sold (Public Records) $67,500 Public Records
- 2003-02-05 Sold (Public Records) $61,500 Public Records
Property tax history
+10.6%/yrLatest (2025): $1,632 · +1.9% YoY. Source: county tax records.
Cash-flow waterfall
monthlySold comps — $/sqft
last 12 mo · ≤1 miLoading sold comps…