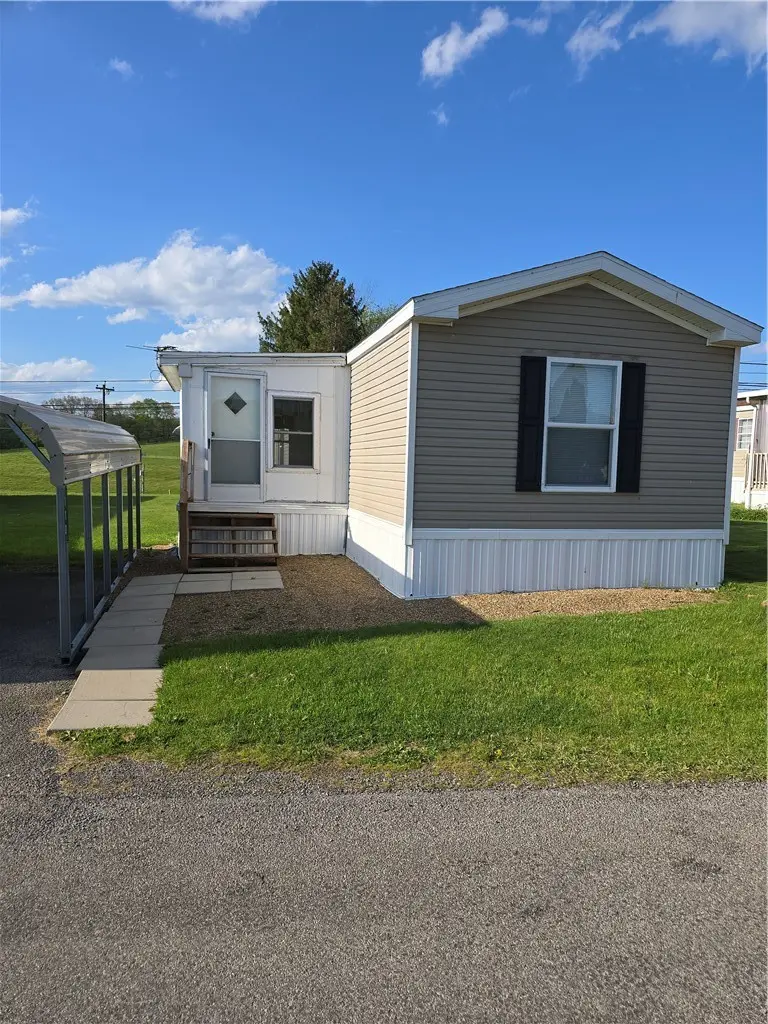
110 Country Garden Estates Dr · East Franklin, PA
Flood risk 1/10 · Minimal
- FEMA flood zone
- X (unshaded)
- Chance of flooding over 30 yrs
- 0.0%
- Est. flood insurance / yr
- $473 – $860
Fire risk 1/10 · Minimal
- Est. fire insurance / yr
- $511 – $949
Heat risk 3/10 · Minor
- Hot days now (above 96°F)
- 7 days/yr
- Hot days in 30 yrs
- 17 days/yr
Wind risk 2/10 · Minimal
- Chance of severe wind over 30 yrs
- 0.0%
Air-quality risk 3/10 · Minor
- Unhealthy air days now
- 2 days/yr
- Unhealthy air days in 30 yrs
- 3 days/yr
Risk factors via First Street. Map © Google.
Why this score? — see what drove the D+ grade
The composite is a weighted blend of 9 inputs, each scored 0–100. Each bar is that input's sub-score; the figure is the points it added to the 100-point composite (weight × sub-score).
- Cash flow +11.2/30.0
- 1% rule +10.0/10.0
- ARV discount +7.5/15.0
- Appreciation +4.9/10.0
- Schools +4.0/10.0
- DSCR +3.3/10.0
- Rent growth +2.5/5.0
- Livability +2.5/5.0
- Condition / age +2.5/5.0
$39,900
🖨 Deal sheet 📄 Offer letter ✓ Due diligence
Listing remarks
Welcome to this well - maintained 2 bedroom, 1 bathroom mobile home offering comfort, convenience and exceptional value. Perfect for first-time buyers, downsizers or anyone seeking an affordable lifestyle without sacrificing charm. Step inside the bright and inviting 3 season room that leads to a warm and welcoming living area. The open layout flows into the well equipped kitchen that includes all appliances, ample cabinet space and room for casual dining. Both bedrooms feature ample closet space. The full bathroom is complete with included washer and dryer. The yard features country views and a private shed. There is also a carport area with dedicated parking for 2 vehicles. Conveniently l
Key facts
- 4,356 sq ft lot
- 2 parking spots
- Built 2014
Property features AI
Finance
- HOA & community: Association fee of $355 per month
Exterior
- Parking: Covered parking; Two total parking spaces
- Utilities: Public water; Public sewer
- Home design: Single-story home; Resale property; Asphalt roof; Vinyl siding
- Construction: Built with vinyl siding; Asphalt roof
- Exterior features: Small lot (approximately 0.1 acre)
Interior
- Kitchen: Kitchen on the main level (12x12); Dishwasher; Stove; Refrigerator; Some gas appliances
- Bedrooms: Two bedrooms on the main level (9x12 and 12x12)
- Flooring: Vinyl
- Bathrooms: One full bathroom
- Heating & cooling: Electric forced-air heating; Central air conditioning
- Interior features: Vinyl flooring
- Laundry & utility: Washer; Dryer
Neighborhood map
What this means for you Summary
Snapshot
- This is a 2-bed/1.0-bath manufactured listed at $40k.
Deal economics
- At list price, monthly cash flow is $-15 ($-184/yr) — negative.
- To cash-flow at today's rent, offer at most $37k (6.8% below list).
- Meets the 1% rule at list price ($880 rent vs $40k).
- Recommended offer: $37k (6.8% below list) — sets the bar for cash-flow.
Location & tenants
- Location reads: area grade D — affects rentability + tenant quality, not the cash-flow math above.
- Armstrong SD (rural): math 38% / reading 58% proficiency, ranked #233 of 539 in PA (top 43%) — families likely to look elsewhere, expect single-tenant / working-renter base with shorter leases.
- Market conditions: 7 active listings in the ZIP; 58 units permitted in Armstrong County in 2024 (20 in 5+ unit buildings).
Forward outlook
- In year one you build about $211 of equity ($276 loan paydown + $-65 appreciation (-0.2% local appreciation)).
- Armstrong County population projected at -27% by 2050 — secular population decline; favor cash flow + early exit over multi-decade hold.
Negotiation context
- It's been on market 44 days — a 3% lower offer ($39k) is reasonable based on typical stale-listing flexibility.
- 2 sale attempts; this cycle's ask has dropped $5k (11%) from the opening price — seller is motivated, your offer sets the floor, not the list.
Risks & watch-outs
- Watch-outs: property tax is 3.9% of price; HOA is 40% of rent.
Questions for the listing agent
- What do current leases actually rent for vs. the listed asking? Can we see a recent rent roll and the last 12 months of T-12 income?
- It's been on market 44 days. Have you received any prior offers? Is the seller open to a 7% concession, seller financing, or rate buy-down credit?
- Property tax is high relative to price — has the assessment been appealed recently, and will the sale trigger a re-assessment?
- What does the HOA fee cover, when was the last increase, and are there any pending special assessments or reserve-fund shortfalls?
- Is there a deadline driving the sale (1031 exchange, divorce, estate, relocation)? That informs how much negotiation room exists.
- The area grade is low — what's the realistic commute time and amenity access for the typical tenant pool here? Any planned neighborhood developments (good or bad) we should know about?
- What's the average days-on-market for RENTAL listings here right now (not sales)? A rising rental-DOM trend means longer vacancies and softer asking-rent achievability than the comps imply.
- What's the recent tenant-quality profile in this submarket — average credit score on applications, eviction rate, late-payment / NSF rate, and stable-employment percentage? A property-management company in the area should have these aggregated.
- How much new for-sale + rental construction is in the pipeline within 1–3 miles? Heavy new supply typically softens prices + rents 12–24 months out; constrained supply supports both.
Investment metrics
- 1% rule
- 2.21% ✓
- Cap rate
- 5.83%
- Cash-on-cash
- -1.65%
- DSCR
- 0.93
- GRM
- 3.8
CMA / ARV
No comps found within radius.
Projected returns pro-forma
-0.16% appreciation · 3.0% rent growth · sell at horizon
- IRR
- -4.2%
- Equity multiple
- 0.81×
- Total profit
- $-2,167
- Equity at exit
- $11,262
- IRR
- 2.4%
- Equity multiple
- 1.26×
- Total profit
- $2,891
- Equity at exit
- $13,283
Cash invested: $11,172 (down + closing). Projections, not guarantees.
Landlord ↔ Tenant lean methodology
- Overall (STATE)
- 62 Landlord-Friendly
- State Pennsylvania
- 62 Landlord-Friendly · EVEN
- County
- — inherits STATE
- City
- — inherits STATE
ZIP-level market 16262
- Home prices YoY
- -0.1%
- Active inventory
- 7
- Price-to-rent
- 3.8×
Monthly cashflow live
- Estimated rent
- $880 medium interval (Pro) →
- Mortgage (P&I)
- −$209
- Tax from tax record
- −$130 /mo · $1,561/yr
- Insurance
- −$17
- HOA
- −$355
- Vacancy / Maint / Mgmt
- −$185
- Net cashflow
- $-15
Break-even live
UW: 25.0% down · 7.5% · 30yr · 1.5% tax · 5.0% vac · 8.0% maint · 8.0% mgmt
Financing live
Cash to close
- Down payment
- $9,975
- Closing costs
- $1,197
- Reserves months
- —
- Total cash needed
- —
Loan-product check · same deal, 3 products live
Conventional
25% down · 7.5% · 30yr
- Down + closing
- —
- Monthly P&I
- —
- Monthly cashflow
- —
- DSCR
- —
- Eligible?
- —
Personal DTI + credit; lowest rate.
DSCR
20% down · 8.5% · 30yr
- Down + closing
- —
- Monthly P&I
- —
- Monthly cashflow
- —
- DSCR
- —
- Eligible?
- —
No personal income docs; deal must DSCR.
Hard money
10% down · 12.0% · 12mo
- Down + closing
- —
- Monthly P&I
- —
- Monthly cashflow
- —
- DSCR
- —
- Eligible?
- —
Short-term bridge; refi at stabilization.
HOA detail
- Monthly dues
- $355 · $4,260/yr
Listing history 17 events
-
2026-06-18price $39,900 Active 44 DOM
-
2026-06-18days on market $42,900 Active 44 DOM
-
2026-06-17days on market $42,900 Active 43 DOM
-
2026-06-16days on market $42,900 Active 42 DOM
-
2026-06-16price $42,900 Active 41 DOM
-
2026-06-15days on market $45,000 Active 41 DOM
-
2026-06-13days on market $45,000 Active 39 DOM
-
2026-06-12days on market $45,000 Active 38 DOM
-
2026-06-09days on market $45,000 Active 35 DOM
-
2026-06-08days on market $45,000 Active 34 DOM
-
2026-06-08days on market $45,000 Active 33 DOM
-
2026-06-07days on market $45,000 Active 32 DOM
-
2026-06-04days on market $45,000 Active 29 DOM
-
2026-06-02days on market $45,000 Active 28 DOM
-
2026-06-01days on market $45,000 Active 27 DOM
-
2026-05-31days on market $45,000 Active 26 DOM
-
2026-05-04$45,000 Active 842-char remark
ⓘ Source: listings_history table (triggers on properties + properties_extension) + one-shot
backfill from property_details.listing_events for pre-trigger history.
Tax reassessment forecast PA · Partial reset (capped growth)
- Current annual tax
- $1,561 · $130/mo
- Projected year-2 tax
- $1,561 · $130/mo
- Expected delta
- $0/yr ($0/mo · 0.0%)
ⓘ Screening estimate from a state-policy table — verify with the county assessor before closing.
Climate risk First Street
- Flood 1/10 Low FEMA zone X (unshaded) · 0% chance over 30 yrs
- Wildfire 1/10 Low
- Heat 3/10 Moderate 7 d/yr ≥96°F today · 17 d/yr by 30 yrs out
- Wind 2/10 Low 0% chance of damaging wind over 30 yrs
- Air quality 3/10 Moderate 2 unhealthy d/yr today · 3 by 30 yrs out
Nearby sold comps map
Loading sold comps map…
Walkable amenities ~0.75 mi
Loading nearby amenities…
Taxation est. · year 1
- Rental income
- $10,566
- − Mortgage interest
- −$2,235
- − Property taxes
- −$1,561
- − Insurance
- −$200
- − Repairs & maintenance
- −$845
- − Management
- −$845
- − HOA
- −$4,260
- − Depreciation
- −$1,161
- Taxable loss
- −$540
- Est. tax savings @ 24.0%
- +$130
- After-tax cash flow
- $-54/yr
For passive investors: Depreciation is non-cash, so a rental often shows a tax loss while cash-flowing — sheltering income. Rental losses are passive: they offset passive income freely, and up to $25,000/yr can offset ordinary (W-2) income if you actively participate and your MAGI is under $100k (phasing out to $0 by $150k); unused losses carry forward. On sale, claimed depreciation is recaptured at up to 25%, and gains may owe capital-gains tax (a 1031 exchange can defer both). Figures are a year-1 estimate at your 24.0% rate — not tax advice; consult a CPA.
Schools (NCES district)
- District
- Armstrong SD
- NCES district ID
- 4202590
- Math proficiency
- 38% ▼ -13.00%
- Reading proficiency
- 58% ▼ -6.00%
- Median HH income
- $43,333
- Composite
- 40.41/100
- National rank
- #3729
- State rank
- #233 of 539 in PA
Livability — East Franklin
No livability data for this city. (Only ~50 U.S. cities are tracked.)
Census & demographics
- Population (ZIP)
- 2,811
Population outlook (Armstrong County) Hauer SSP2
- Today (2025)
- 62,513 people
- By 2030
- 59,579 · -4.7%
- By 2040
- 52,890 · -15.4%
- By 2050
- 45,904 · -26.6%
- By 2075
- 32,023 · -48.8%
- By 2100
- 20,415 · -67.3%
Race, ethnicity, and origin ACS 2023
- Neighborhood character
- Predominantly White (99%)
- Race & ethnicity
- White 99%
- Common ancestry
- Romanian 3% Serbian 2% Slovak 2%
- Foreign-born
- 0%
Political lean MEDSL · Armstrong
- 2024 margin
- Solid R (+53.2) · D 23.0% · R 76.2%
- 2008→2024 swing
- -28.6pp toward R · 2008: -24.6pp · 2024: -53.2pp
- All cycles
- 2024: R+53.2 2020: R+52.3 2016: R+52.0 2012: R+37.2 2008: R+24.6
Not yet ingested
- Civics
- —
Market trends
- HPI YoY
- ▼ -0.16%
- Current HPI
- 157.0474
- Rent YoY
- —
- Metro
- —
- State GDP YoY
- ▲ 1.68%
- F500 in state
- 34
Industry mix (Fortune 500 HQ in PA)
| Industry | F500 HQs | Revenue |
|---|---|---|
| Healthcare | 2 | $309B |
|
||
| Insurance | 2 | $27B |
|
||
| Telecommunications / Media | 1 | $124B |
|
||
| Industrial Distribution | 1 | $22B |
|
||
| Financial Services | 1 | $20B |
|
||
| Chemicals / Materials | 1 | $18B |
|
||
Price history
-4.7% since first listed4 events — show timeline
- 2026-06-16 Price Changed $42,900 West Penn MLS
- 2026-05-26 Relisted — West Penn MLS
- 2026-05-20 Contingent — West Penn MLS
- 2026-05-04 Listed $45,000 West Penn MLS
Property tax history
+0.9%/yrLatest (2026): $1,561 · +0.0% YoY. Source: county tax records.
Cash-flow waterfall
monthlySold comps — $/sqft
last 12 mo · ≤1 miLoading sold comps…