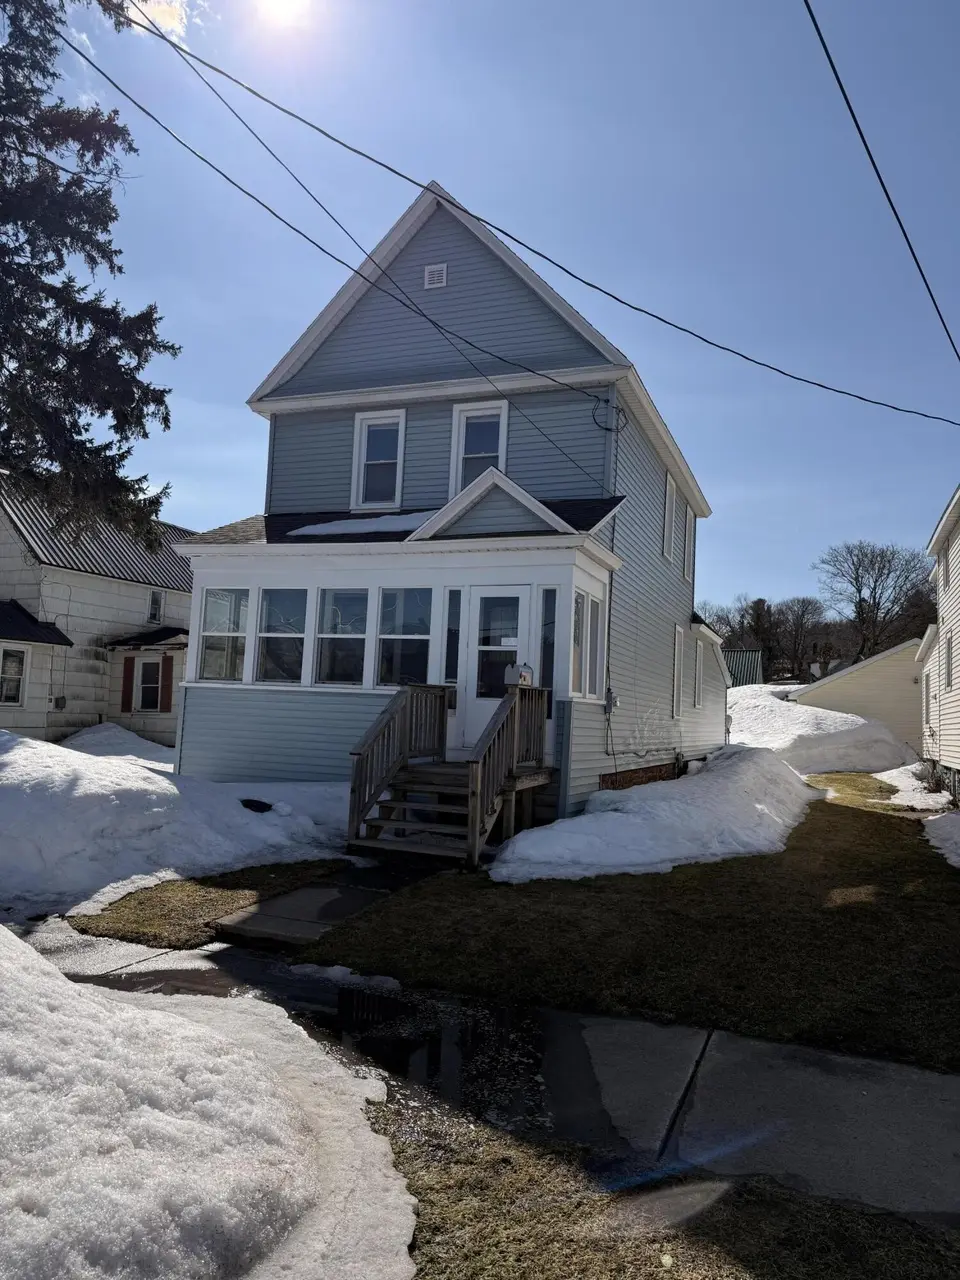
1004 John St · Sault Ste. Marie, MI
Flood risk 1/10 · Minimal
- FEMA flood zone
- X (unshaded)
- Chance of flooding over 30 yrs
- 0.0%
- Est. flood insurance / yr
- $507 – $1,088
Fire risk 1/10 · Minimal
- Est. fire insurance / yr
- $784 – $1,456
Heat risk 1/10 · Minimal
- Hot days now (above 88°F)
- 7 days/yr
- Hot days in 30 yrs
- 14 days/yr
Wind risk 1/10 · Minimal
- Chance of severe wind over 30 yrs
- —
Air-quality risk 1/10 · Minimal
- Unhealthy air days now
- 0 days/yr
- Unhealthy air days in 30 yrs
- 0 days/yr
Risk factors via First Street. Map © Google.
Why this score? — see what drove the D grade
The composite is a weighted blend of 9 inputs, each scored 0–100. Each bar is that input's sub-score; the figure is the points it added to the 100-point composite (weight × sub-score).
- Cash flow +19.4/30.0
- DSCR +6.1/10.0
- 1% rule +4.5/10.0
- Schools +3.3/10.0
- Rent growth +2.5/5.0
- Livability +2.5/5.0
- Condition / age +2.5/5.0
- ARV discount +1.3/15.0
- Appreciation +0.0/10.0
$150,000
🖨 Deal sheet (PDF) 📄 Offer letter ✓ Due diligence
Listing remarks
Unlock incredible value three-bedroom, 1.5-bath residence in the heart of Sault Ste. Marie, Michigan. Perfectly situated just blocks from Lake Superior State University (LSSU), this property is a standout choice for those looking to build equity in a high-demand rental and residential area. The Potential:With a fresh coat of paint, a nice deep clean, and new carpeting, the transformation will be immediate. For the savvy buyer, this minimal investment will yield surprising results in both comfort and property value. Property Highlights:Location: Unbeatable proximity to the LSSU campus, making it ideal for faculty, students, or university staff. Layout: A functional three-bedroom floor plan w
Key facts
- Fresh coat of paint
- New carpeting
- 5,200 sq ft lot
Tags
Neighborhood map
What this means for you Summary
Snapshot
- This is a 4-bed/2.0-bath single-family listed at $150k.
Deal economics
- At list price, monthly cash flow is $168 ($2k/yr) — positive.
- The deal already cash-flows at list — no discount required.
- To meet the 1% rule (rent ≥ 1% of price), the offer needs to be $143k (4.9% below list).
- Recommended offer: $143k (4.9% below list) — sets the bar for 1% rule.
- Cap rate 7.6% vs local median 4.4% in Sault Ste. Marie — top-decile yield for the area; either an underpriced asset or a hidden risk that comps aren't pricing in. Stress-test before assuming the spread holds.
Location & tenants
- Location reads: area grade D — affects rentability + tenant quality, not the cash-flow math above.
- Sault Ste. Marie Area Schools (town): math 35% / reading 44% proficiency, ranked #230 of 540 in MI (top 43%) — families likely to look elsewhere, expect single-tenant / working-renter base with shorter leases.
- Zoned schools: Sault Area Middle School (math 35% / reading 46%, grade F, #202 of 493 statewide, top 42%, 533 students, 50% FRL).
- Market conditions: 129 active listings in the ZIP; 92 units permitted in Chippewa County in 2024 (40 in 5+ unit buildings).
Forward outlook
- Local home prices are declining (-3.0%/yr); year-one equity from $1k of loan paydown is wiped out by about $4k of value loss. Plan a longer hold.
- Chippewa County population projected at -10% by 2050 — secular population decline; favor cash flow + early exit over multi-decade hold.
Negotiation context
- It's been on market 27 days — a 2% lower offer ($148k) is reasonable based on typical stale-listing flexibility.
Risks & watch-outs
- Watch-outs: built in 1900 — expect roof / HVAC / electrical / plumbing capex.
Questions for the listing agent
- Built in 1900 — when were the roof, HVAC, electrical panel, plumbing, and water heater last replaced?
- Is there a deadline driving the sale (1031 exchange, divorce, estate, relocation)? That informs how much negotiation room exists.
- The area grade is low — what's the realistic commute time and amenity access for the typical tenant pool here? Any planned neighborhood developments (good or bad) we should know about?
- What's the average days-on-market for RENTAL listings here right now (not sales)? A rising rental-DOM trend means longer vacancies and softer asking-rent achievability than the comps imply.
- What's the recent tenant-quality profile in this submarket — average credit score on applications, eviction rate, late-payment / NSF rate, and stable-employment percentage? A property-management company in the area should have these aggregated.
- How much new for-sale + rental construction is in the pipeline within 1–3 miles? Heavy new supply typically softens prices + rents 12–24 months out; constrained supply supports both.
Investment metrics
- 1% rule
- 0.95% ✗
- Cap rate
- 7.64%
- Cash-on-cash
- 4.81%
- DSCR
- 1.21
- GRM
- 8.8
CMA / ARV
- ARV (on-the-fly)
- $131,856
- Comps found
- 12
Show comp detail 12 sales within ~0.75 mi
| Address | Dist | Beds/Ba | Sqft | Sold | Price | $/sf | Match |
|---|---|---|---|---|---|---|---|
| 1211 Minneapolis St | 0.31mi | 4/2.0 | 1,100 (+3%) | 3mo | $200,000 | $182 | 79 |
| 810 Court St | 0.16mi | 3/1.5 (-1) | 985 (-8%) | 2mo | $75,000 | $76 | 70 |
| 605 Newton Ave | 0.28mi | 3/1.5 (-1) | 1,130 (+5%) | 4mo | $168,000 | $149 | 68 |
| 816 Court St | 0.14mi | 3/1.0 (-1) | 1,146 (+7%) | 10mo | $120,000 | $105 | 65 |
| 906 John | 0.08mi | 3/1.0 (-1) | 1,232 (+15%) | 3mo | $155,000 | $126 | 60 |
| 811 Augusta St | 0.28mi | 3/1.0 (-1) | 995 (-7%) | 12mo | $149,900 | $151 | 56 |
| 1612 Minneapolis St | 0.48mi | 3/1.0 (-1) | 1,002 (-6%) | 3mo | $95,000 | $95 | 55 |
| 116 W 12th Ave | 0.57mi | 3/1.5 (-1) | 1,020 (-5%) | 10mo | $160,000 | $157 | 50 |
| 911 E 4th Ave | 0.47mi | 3/1.5 (-1) | 1,172 (+9%) | 9mo | $62,000 | $53 | 48 |
| 123 W 10th Ave | 0.45mi | 3/1.0 (-1) | 1,200 (+12%) | 3mo | $85,000 | $71 | 47 |
| 121 W 12th Ave | 0.60mi | 3/1.0 (-1) | 1,008 (-6%) | 8mo | $124,468 | $123 | 46 |
| 123 W 12th Ave | 0.60mi | 3/2.0 (-1) | 1,196 (+12%) | 7mo | $127,500 | $107 | 42 |
Match score weights: distance 35% · size 25% · config 20% · recency 20%. Top-matched comps best support the ARV.
Projected returns pro-forma
-3.0% appreciation · 3.0% rent growth · sell at horizon
- IRR
- -8.8%
- Equity multiple
- 0.68×
- Total profit
- $-13,613
- Equity at exit
- $22,365
- IRR
- 0.6%
- Equity multiple
- 1.04×
- Total profit
- $1,843
- Equity at exit
- $12,969
Cash invested: $42,000 (down + closing). Projections, not guarantees.
Landlord ↔ Tenant lean methodology
- Overall (STATE)
- 62 Landlord-Friendly
- State Michigan
- 62 Landlord-Friendly · EVEN
- County
- — inherits STATE
- City
- — inherits STATE
ZIP-level market 49783
- Active inventory
- 129
- Price-to-rent
- 8.8×
Monthly cashflow live
- Estimated rent
- $1,426 medium interval (Pro) →
- Mortgage (P&I)
- −$787
- Tax from tax record
- −$109 /mo · $1,312/yr
- Insurance
- −$62
- HOA
- −$0
- Vacancy / Maint / Mgmt
- −$300
- Net cashflow
- $168
Break-even live
Sensitivity live
| Price | -10% $253 | -5% $211 | +0% $168 | +5% $126 | +10% $83 |
|---|---|---|---|---|---|
| Rent | -10% $56 | -5% $112 | +0% $168 | +5% $225 | +10% $281 |
| Rate | -1.0pp $244 | -0.5pp $206 | base $168 | +0.5pp $129 | +1.0pp $90 |
UW: 25.0% down · 7.5% · 30yr · 1.5% tax · 5.0% vac · 8.0% maint · 8.0% mgmt
Financing live
Cash to close
- Down payment
- $37,500
- Closing costs
- $4,500
- Reserves months
- —
- Total cash needed
- —
Loan-product check · same deal, 3 products live
Conventional
25% down · 7.5% · 30yr
- Down + closing
- —
- Monthly P&I
- —
- Monthly cashflow
- —
- DSCR
- —
- Eligible?
- —
Personal DTI + credit; lowest rate.
DSCR
20% down · 8.5% · 30yr
- Down + closing
- —
- Monthly P&I
- —
- Monthly cashflow
- —
- DSCR
- —
- Eligible?
- —
No personal income docs; deal must DSCR.
Hard money
10% down · 12.0% · 12mo
- Down + closing
- —
- Monthly P&I
- —
- Monthly cashflow
- —
- DSCR
- —
- Eligible?
- —
Short-term bridge; refi at stabilization.
Listing history 2 events
-
2026-04-20status Pending
-
2026-03-24$150,000 Active
ⓘ Source: listings_history table (triggers on properties + properties_extension) + one-shot
backfill from property_details.listing_events for pre-trigger history.
Tax reassessment forecast MI · Partial reset (capped growth)
- Current annual tax
- $1,312 · $109/mo
- Projected year-2 tax
- $1,811 · $151/mo
- Expected delta
- +$499/yr (+$42/mo · 38.0%)
ⓘ Screening estimate from a state-policy table — verify with the county assessor before closing.
Climate risk First Street
- Flood 1/10 Low FEMA zone X (unshaded) · 0% chance over 30 yrs
- Wildfire 1/10 Low
- Heat 1/10 Low 7 d/yr ≥88°F today · 14 d/yr by 30 yrs out
- Wind 1/10 Low
- Air quality 1/10 Low 0 unhealthy d/yr today · 0 by 30 yrs out
Nearby sold comps map
Loading sold comps map…
Walkable amenities ~0.75 mi
Loading nearby amenities…
Taxation est. · year 1
- Rental income
- $17,116
- − Mortgage interest
- −$8,402
- − Property taxes
- −$1,312
- − Insurance
- −$750
- − Repairs & maintenance
- −$1,369
- − Management
- −$1,369
- − Depreciation
- −$4,364
- Taxable loss
- −$451
- Est. tax savings @ 24.0%
- +$108
- After-tax cash flow
- $2,128/yr
For passive investors: Depreciation is non-cash, so a rental often shows a tax loss while cash-flowing — sheltering income. Rental losses are passive: they offset passive income freely, and up to $25,000/yr can offset ordinary (W-2) income if you actively participate and your MAGI is under $100k (phasing out to $0 by $150k); unused losses carry forward. On sale, claimed depreciation is recaptured at up to 25%, and gains may owe capital-gains tax (a 1031 exchange can defer both). Figures are a year-1 estimate at your 24.0% rate — not tax advice; consult a CPA.
Schools (NCES district)
- District
- Sault Ste. Marie Area Schools
- NCES district ID
- 2630990
- Math proficiency
- 35% ▼ -9.00%
- Reading proficiency
- 44% ▼ -12.00%
- Median HH income
- $40,273
- Composite
- 33.12/100
- National rank
- #5559
- State rank
- #230 of 540 in MI
Livability — Sault Ste. Marie
No livability data for this city. (Only ~50 U.S. cities are tracked.)
Census & demographics
- Census place
- Sault Ste. Marie, MI
- Population (ZIP)
- 18,778
Population outlook (Chippewa County) Hauer SSP2
- Today (2025)
- 37,043 people
- By 2030
- 36,431 · -1.7%
- By 2040
- 34,911 · -5.8%
- By 2050
- 33,350 · -10.0%
- By 2075
- 29,789 · -19.6%
- By 2100
- 24,171 · -34.7%
Race, ethnicity, and origin ACS 2023
- Neighborhood character
- Predominantly White (70%)
- Race & ethnicity
- White 70% Native American 14% Two or more races 13% Hispanic / Latino 2%
- Common ancestry
- Lithuanian 6% Romanian 6% Slovak 4%
- Foreign-born
- 4% · Canada, Vietnam, Guatemala
- Languages at home
- 95% English-only · Spanish 1% Other Indo-European 1% German/W. Germanic 1%
Political lean MEDSL · Chippewa
- 2024 margin
- Strong R (+24.2) · D 37.0% · R 61.3% · Other 1.7%
- 2008→2024 swing
- -23.8pp toward R · 2008: -0.5pp · 2024: -24.2pp
- All cycles
- 2024: R+24.2 2020: R+22.9 2016: R+24.2 2012: R+7.6 2008: R+0.5
Not yet ingested
- Civics
- —
Market trends
- HPI YoY
- ▼ -183.63%
- Current HPI
- 149.9878
- Rent YoY
- —
- Metro
- —
- State GDP YoY
- ▲ 1.37%
- F500 in state
- 28
Industry mix (Fortune 500 HQ in MI)
| Industry | F500 HQs | Revenue |
|---|---|---|
| Automotive Parts | 3 | $48B |
|
||
| Automotive | 2 | $372B |
|
||
| Chemicals | 1 | $45B |
|
||
| Automotive Retail | 1 | $29B |
|
||
| Healthcare / Medical Devices | 1 | $23B |
|
||
| Automotive Technology | 1 | $20B |
|
||
Price history
2 events — show timeline
- 2026-04-20 Pending — EUPBR
- 2026-03-24 Listed $150,000 EUPBR
Property tax history
-0.3%/yrLatest (2024): $1,312 · +192.7% YoY. Source: county tax records.
Cash-flow waterfall
monthlySold comps — $/sqft
last 12 mo · ≤1 miLoading sold comps…