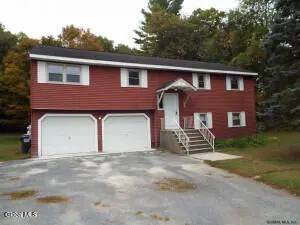
292 Washington St · Saratoga Springs, NY
Flood risk 1/10 · Minimal
- FEMA flood zone
- X
- Chance of flooding over 30 yrs
- 0.0%
- Est. flood insurance / yr
- $473 – $860
Fire risk 3/10 · Minor
- Est. fire insurance / yr
- $691 – $1,283
Heat risk 3/10 · Minor
- Hot days now (above 97°F)
- 7 days/yr
- Hot days in 30 yrs
- 16 days/yr
Wind risk 2/10 · Minimal
- Chance of severe wind over 30 yrs
- 4.0%
Air-quality risk 1/10 · Minimal
- Unhealthy air days now
- 0 days/yr
- Unhealthy air days in 30 yrs
- 0 days/yr
Risk factors via First Street. Map © Google.
Why this score? — see what drove the D+ grade
The composite is a weighted blend of 9 inputs, each scored 0–100. Each bar is that input's sub-score; the figure is the points it added to the 100-point composite (weight × sub-score).
- ARV discount +15.0/15.0
- Cash flow +10.5/30.0
- Schools +6.1/10.0
- Rent growth +4.8/5.0
- Livability +4.1/5.0
- DSCR +3.0/10.0
- 1% rule +2.8/10.0
- Condition / age +2.5/5.0
- Appreciation +0.0/10.0
$459,000
🖨 Deal sheet 📄 Offer letter ✓ Due diligence
Listing remarks MLS
Sold before in MLS
Key facts
- Modern kitchen
- Bonus area
- 0.87 acre lot
Tags
Property features AI
Exterior
- Parking: Detached or on-site parking for a total of 6 vehicles; 2-car garage; Paved parking
- Security: Carbon monoxide detector(s)
- Utilities: Public sewer; Cable available and connected
- Home design: Single family residence; Below-grade finished area (basement) present
- Construction: Vinyl siding; Asbestos shingle roof
- Exterior features: Front porch; Patio; Paved driveway/drive area; On-site storage structure; Sloped and landscaped lot; Approximately 0.87-acre lot with about 130 ft of road frontage
Interior
- Kitchen: Kitchen on the first floor; Second kitchen in the basement; Dishwasher; Microwave; Oven; Refrigerator
- Bedrooms: Primary bedroom on the first floor; Two additional bedrooms on the first floor; Bedroom in the basement
- Bathrooms: Two full bathrooms — one on the first floor and one in the basement
- Heating & cooling: Has heating; Window unit(s) for cooling
- Interior features: Paddle fan; Finished apartment in the basement; Total of 10 rooms
- Laundry & utility: Laundry in the basement
Neighborhood map
What this means for you Summary
Snapshot
- This is a 4-bed/2.0-bath single-family listed at $459k.
Deal economics
- At list price, monthly cash flow is $-234 ($-3k/yr) — negative.
- To cash-flow at today's rent, offer at most $418k (9.0% below list).
- To meet the 1% rule (rent ≥ 1% of price), the offer needs to be $360k (21.6% below list).
- Recommended offer: $360k (21.6% below list) — sets the bar for 1% rule.
- Cap rate 5.7% vs local median 2.0% in Saratoga Springs — top-decile yield for the area; either an underpriced asset or a hidden risk that comps aren't pricing in. Stress-test before assuming the spread holds.
Location & tenants
- Location reads 82/100 on livability (#83 in NY, #1,284 nationally) — a professional / high-income tenant draw. Strengths: employment A+, housing A+, health & safety A; Watch: amenities D+, cost of living F.
- Saratoga Springs City SD (suburban): math 67% / reading 72% proficiency, ranked #138 of 590 in NY (top 23%) — acceptable for families but not a draw, mixed tenant base, ~2y average lease; only 15% free/reduced lunch — higher-income household profile.
- Zoned schools: Division Street Elementary School (math 67% / reading 72%, grade A-, #447 of 2,108 statewide, top 24%, 414 students, 25% FRL); Saratoga Springs High School (math 98% / reading 92%, grade A+, #83 of 1,100 statewide, top 8%, 1,947 students, 26% FRL).
- Zoned-school proficiency averages 82% at this address vs 70% district-wide (+13 pts) — the actual schools serving this property are materially stronger than the Saratoga Springs City SD average implies; a family-tenant draw the district grade alone would hide.
- Market conditions: Rents rising fast (+9.2%/yr); 474 active listings in the ZIP; 5 comparable units currently listed for rent nearby; rentals lingering (median 44d on market — plan ~5-8 weeks vacancy on turnover, expect pricing pressure); 60% of comp listings sitting > 30 days — soft ceiling on asking rent; solid renter incomes; 1,132 units permitted in Saratoga County in 2024 (378 in 5+ unit buildings).
- This rent runs 42% of the median local income ($102k/yr) — at the standard rent-burdened threshold; future hikes will face affordability resistance.
Forward outlook
- Local home prices are declining (-3.0%/yr); year-one equity from $3k of loan paydown is wiped out by about $14k of value loss. Plan a longer hold.
- Saratoga County population projected at +4% by 2050 — modest demand growth; plan on rents tracking national, not racing it.
Negotiation context
- It's been on market 35 days — a 3% lower offer ($445k) is reasonable based on typical stale-listing flexibility.
- 8 sale attempts since 22y ago; this cycle's ask has dropped $40k (8%) from the opening price — seller is motivated, your offer sets the floor, not the list.
Questions for the listing agent
- What do current leases actually rent for vs. the listed asking? Can we see a recent rent roll and the last 12 months of T-12 income?
- It's been on market 35 days. Have you received any prior offers? Is the seller open to a 22% concession, seller financing, or rate buy-down credit?
- Built in 1977 — when were the roof, HVAC, electrical panel, plumbing, and water heater last replaced?
- Is there a deadline driving the sale (1031 exchange, divorce, estate, relocation)? That informs how much negotiation room exists.
- Schools are A-rated — typically a magnet for longer-tenancy family renters. What's the average tenant stay here, and is there a school-zone premium baked into asking?
- The area grade is low — what's the realistic commute time and amenity access for the typical tenant pool here? Any planned neighborhood developments (good or bad) we should know about?
- What's the average days-on-market for RENTAL listings here right now (not sales)? A rising rental-DOM trend means longer vacancies and softer asking-rent achievability than the comps imply.
- What's the recent tenant-quality profile in this submarket — average credit score on applications, eviction rate, late-payment / NSF rate, and stable-employment percentage? A property-management company in the area should have these aggregated.
- How much new for-sale + rental construction is in the pipeline within 1–3 miles? Heavy new supply typically softens prices + rents 12–24 months out; constrained supply supports both.
Investment metrics
- 1% rule
- 0.78% ✗
- Cap rate
- 5.68%
- Cash-on-cash
- -2.18%
- DSCR
- 0.90
- GRM
- 10.6
CMA / ARV
- ARV (median comp)
- $653,521
- List price
- $459,000
- Delta
- -29.77%
- Verdict
- UNDERPRICED
- Comps
- 20 within 1.0 mi
Show comp detail 12 sales within ~0.75 mi
| Address | Dist | Beds/Ba | Sqft | Sold | Price | $/sf | Match |
|---|---|---|---|---|---|---|---|
| 292 Washington St | 0.00mi | 4/2.0 | 2,028 (0%) | 13mo | $425,000 | $210 | 89 |
| 32 Friar Tuck Way | 0.31mi | 4/2.5 | 1,920 (-5%) | 2mo | $700,000 | $365 | 73 |
| 26 Walter Dr | 0.43mi | 4/2.5 | 2,000 (-1%) | 8mo | $537,000 | $269 | 69 |
| 35 Sherwood Trl | 0.23mi | 3/2.5 (-1) | 1,984 (-2%) | 12mo | $688,000 | $347 | 69 |
| 8 Pinehurst Dr | 0.37mi | 4/2.5 | 1,926 (-5%) | 5mo | $479,000 | $249 | 69 |
| 25 Jenee Way | 0.41mi | 3/2.0 (-1) | 1,974 (-3%) | 7mo | $625,000 | $317 | 66 |
| 487 Grand Ave | 0.46mi | 3/2.5 (-1) | 2,006 (-1%) | 8mo | $660,000 | $329 | 63 |
| 23 Walter Dr | 0.40mi | 4/2.0 | 1,860 (-8%) | 9mo | $508,500 | $273 | 61 |
| 37 Kirby Rd | 0.34mi | 3/2.0 (-1) | 1,904 (-6%) | 14mo | $389,000 | $204 | 58 |
| 11 Worden Dr | 0.50mi | 4/2.0 | 2,240 (+10%) | 5mo | $425,000 | $190 | 55 |
| 11 King Arthur Court South | 0.62mi | 4/2.5 | 1,858 (-8%) | 9mo | $565,000 | $304 | 48 |
| 15 Callagan Dr | 0.71mi | 4/2.5 | 1,737 (-14%) | 1mo | $580,000 | $334 | 40 |
Match score weights: distance 35% · size 25% · config 20% · recency 20%. Top-matched comps best support the ARV.
Projected returns pro-forma
-3.0% appreciation · 8.0% rent growth · sell at horizon
- IRR
- -14.6%
- Equity multiple
- 0.45×
- Total profit
- $-70,265
- Equity at exit
- $68,438
- IRR
- 0.6%
- Equity multiple
- 1.05×
- Total profit
- $6,161
- Equity at exit
- $39,686
Cash invested: $128,520 (down + closing). Projections, not guarantees.
Landlord ↔ Tenant lean methodology
- Overall (STATE)
- 15 Strongly Tenant-Friendly
- State New York
- 15 Strongly Tenant-Friendly · D+10
- County
- — inherits STATE
- City
- — inherits STATE
ZIP-level market 12866
- Home prices YoY
- -31.8%
- Rents YoY
- 9.2%
- Active inventory
- 474
- Price-to-rent
- 10.6×
Monthly cashflow live
- Estimated rent
- $3,598 medium interval (Pro) →
- Mortgage (P&I)
- −$2,407
- Tax from tax record
- −$478 /mo · $5,739/yr
- Insurance
- −$191
- HOA
- −$0
- Vacancy / Maint / Mgmt
- −$756
- Net cashflow
- $-234
Break-even live
UW: 25.0% down · 7.5% · 30yr · 1.5% tax · 5.0% vac · 8.0% maint · 8.0% mgmt
Financing live
Cash to close
- Down payment
- $114,750
- Closing costs
- $13,770
- Reserves months
- —
- Total cash needed
- —
Loan-product check · same deal, 3 products live
Conventional
25% down · 7.5% · 30yr
- Down + closing
- —
- Monthly P&I
- —
- Monthly cashflow
- —
- DSCR
- —
- Eligible?
- —
Personal DTI + credit; lowest rate.
DSCR
20% down · 8.5% · 30yr
- Down + closing
- —
- Monthly P&I
- —
- Monthly cashflow
- —
- DSCR
- —
- Eligible?
- —
No personal income docs; deal must DSCR.
Hard money
10% down · 12.0% · 12mo
- Down + closing
- —
- Monthly P&I
- —
- Monthly cashflow
- —
- DSCR
- —
- Eligible?
- —
Short-term bridge; refi at stabilization.
Rent comps 5 comps
| Address | Beds | Baths | Sqft | Rent | $/sqft | DOM | Units | Dist |
|---|---|---|---|---|---|---|---|---|
| 26 Quiet Harbor Dr Saratoga Springs, NY | 2.0–3.0 | 1.0–2.5 | 1179 | $2,500 | $2.12 | 13d | 1 | 0.26mi |
| 504 Grand Ave Saratoga Springs, NY | 4.0 | 2.5 | 2470 | $10,000 | $4.05 | 43d | 1 | 0.60mi |
| 11 Outlook Ave Saratoga Springs, NY | 3.0 | 2.5 | 1706 | $28,000 | $16.41 | 23d | 1 | 1.06mi |
| 34 Hyde St Saratoga Springs, NY | 3.0 | 2.5 | 2283 | $45,000 | $19.71 | 43d | 1 | 1.24mi |
| 194 Grand Ave Saratoga Springs, NY | 4.0 | 2.5 | 2200 | $28,000 | $12.73 | 43d | 1 | 1.34mi |
Listing history 39 events
-
2026-06-18days on market $459,000 Active 35 DOM
-
2026-06-17days on market $459,000 Active 34 DOM
-
2026-06-16days on market $459,000 Active 33 DOM
-
2026-06-15days on market $459,000 Active 32 DOM
-
2026-06-14days on market $459,000 Active 30 DOM
-
2026-06-13days on market $459,000 Active 29 DOM
-
2026-06-10days on market $459,000 Active 27 DOM
-
2026-06-09pricedays on market $459,000 Active 26 DOM
-
2026-06-08days on market $479,000 Active 25 DOM
-
2026-06-07days on market $479,000 Active 24 DOM
-
2026-06-05days on market $479,000 Active 21 DOM
-
2026-06-03days on market $479,000 Active 20 DOM
-
2026-06-02days on market $479,000 Active 19 DOM
-
2026-06-01pricedays on market $479,000 Active 18 DOM
-
2026-05-31days on market $499,000 Active 17 DOM
-
2026-05-31days on market $499,000 Active 16 DOM
-
2026-05-14$499,000 Active 389-char remark
-
2026-05-13historical $2,500
-
2026-03-11$2,500
-
2026-03-02historical
-
2026-02-13price $559,000
-
2026-01-16$569,900 Active
-
2025-09-23soldstatus $425,000 Closed
Show marketing remark (18 chars)
Sold before in MLS
-
2025-09-23$420,000 Active
Show marketing remark (18 chars)
Sold before in MLS
-
2025-06-06soldstatus $425,000
-
2016-06-03soldstatus $239,650
-
2016-05-10soldstatus $231,500 Closed (Final Sale)
-
2016-05-03status Pend (Under Cntr)
-
2015-11-24price $239,000
-
2015-11-24status Active
-
2015-11-19historical
-
2015-11-04price $247,000
-
2015-11-04status Active
-
2015-10-30historical
-
2015-10-12$249,000 Active
-
2004-07-23soldstatus $149,900
-
2004-07-23soldstatus $149,900
-
2004-06-27historical
-
2004-06-25$149,900
ⓘ Source: listings_history table (triggers on properties + properties_extension) + one-shot
backfill from property_details.listing_events for pre-trigger history.
Tax reassessment forecast NY · Partial reset (capped growth)
- Current annual tax
- $5,739 · $478/mo
- Projected year-2 tax
- $6,748 · $562/mo
- Expected delta
- +$1,009/yr (+$84/mo · 17.6%)
ⓘ Screening estimate from a state-policy table — verify with the county assessor before closing.
Climate risk First Street
- Flood 1/10 Low FEMA zone X · 0% chance over 30 yrs
- Wildfire 3/10 Moderate
- Heat 3/10 Moderate 7 d/yr ≥97°F today · 16 d/yr by 30 yrs out
- Wind 2/10 Low 4% chance of damaging wind over 30 yrs
- Air quality 1/10 Low 0 unhealthy d/yr today · 0 by 30 yrs out
Nearby sold comps map
Loading sold comps map…
Walkable amenities ~0.75 mi
Loading nearby amenities…
Taxation est. · year 1
- Rental income
- $43,179
- − Mortgage interest
- −$25,711
- − Property taxes
- −$5,739
- − Insurance
- −$2,295
- − Repairs & maintenance
- −$3,454
- − Management
- −$3,454
- − Depreciation
- −$13,353
- Taxable loss
- −$10,828
- Est. tax savings @ 24.0%
- +$2,599
- After-tax cash flow
- $-209/yr
For passive investors: Depreciation is non-cash, so a rental often shows a tax loss while cash-flowing — sheltering income. Rental losses are passive: they offset passive income freely, and up to $25,000/yr can offset ordinary (W-2) income if you actively participate and your MAGI is under $100k (phasing out to $0 by $150k); unused losses carry forward. On sale, claimed depreciation is recaptured at up to 25%, and gains may owe capital-gains tax (a 1031 exchange can defer both). Figures are a year-1 estimate at your 24.0% rate — not tax advice; consult a CPA.
Schools (NCES district)
- District
- Saratoga Springs City SD
- NCES district ID
- 3625770
- Math proficiency
- 67% ▼ -10.00%
- Reading proficiency
- 72% ▲ 6.00%
- Median HH income
- $69,864
- Composite
- 60.83/100
- National rank
- #818
- State rank
- #138 of 590 in NY
Livability — Saratoga Springs
- Score
- 82/100
- State rank
- #83
- US rank
- #1284
Category grades
Schools grade is shown separately in the Schools card above.
Census & demographics
- Census place
- Saratoga Springs, NY
- County
- Saratoga County · 166,192 people
- City population
- 40,057
- Metro
- Albany-Schenectady-Troy, NY
- Population (ZIP)
- 40,057
- Household income
- $101,901
- Rent vs Own
- Severe rent burden
- 1424.0
Population outlook (Saratoga County) Hauer SSP2
- Today (2025)
- 238,889 people
- By 2030
- 243,681 · +2.0%
- By 2040
- 249,118 · +4.3%
- By 2050
- 248,638 · +4.1%
- By 2075
- 241,675 · +1.2%
- By 2100
- 213,150 · -10.8%
Race, ethnicity, and origin ACS 2023
- Neighborhood character
- Predominantly White (87%)
- Race & ethnicity
- White 87% Two or more races 5% Hispanic / Latino 4% Asian 2% Black 2%
- Common ancestry
- Romanian 6% Lithuanian 5% Slovak 2%
- Foreign-born
- 6% · Canada, South Korea, China
- Languages at home
- 92% English-only · Spanish 2% German/W. Germanic 1% Korean 1%
Political lean MEDSL · Saratoga
- 2024 margin
- Toss-up / Even · D 50.9% · R 49.1%
- 2008→2024 swing
- -1.6pp toward R · 2008: 3.4pp · 2024: 1.8pp
- All cycles
- 2024: D+1.8 2020: D+5.4 2016: R+4.4 2012: D+2.1 2008: D+3.4
Not yet ingested
- Civics
- —
Market trends
- HPI YoY
- ▼ -178.78%
- Current HPI
- 382.7429
- Rent YoY
- ▲ 9.15%
- Metro
- Albany-Schenectady-Troy, NY
- State GDP YoY
- ▲ 2.60%
- F500 in state
- 92
Industry mix (Fortune 500 HQ in NY)
| Industry | F500 HQs | Revenue |
|---|---|---|
| Financial Services | 10 | $950B |
|
||
| Consumer Goods | 9 | $162B |
|
||
| Insurance | 4 | $225B |
|
||
| Telecommunications | 2 | $144B |
|
||
| Pharmaceuticals | 2 | $112B |
|
||
| Media / Entertainment | 2 | $69B |
|
||
Price history
+206.2% since first listed25 events — show timeline
- 2026-06-09 Price Changed $459,000 Global MLS
- 2026-06-01 Price Changed $479,000 Global MLS
- 2026-05-14 Listed $499,000 Global MLS
- 2026-05-13 Rental Removed $2,500 GLOBALMLS
- 2026-03-11 Listed for Rent $2,500 GLOBALMLS
- 2026-03-02 Listing Removed — Global MLS
- 2026-02-13 Price Changed $559,000 Global MLS
- 2026-01-16 Listed $569,900 Global MLS
- 2025-09-23 Listed $420,000 Global MLS
- 2025-09-23 Sold (MLS) $425,000 Global MLS
- 2025-06-06 Sold (Public Records) $425,000 Public Records
- 2016-06-03 Sold (Public Records) $239,650 Public Records
- 2016-05-10 Sold (MLS) $231,500 Global MLS
- 2016-05-03 Pending — Global MLS
- 2015-11-24 Price Changed $239,000 Global MLS
- 2015-11-24 Relisted — Global MLS
- 2015-11-19 Listing Removed — Global MLS
- 2015-11-04 Price Changed $247,000 Global MLS
- 2015-11-04 Relisted — Global MLS
- 2015-10-30 Listing Removed — Global MLS
- 2015-10-12 Listed $249,000 Global MLS
- 2004-07-23 Sold (Public Records) $149,900 Public Records
- 2004-07-23 Sold (MLS) $149,900 Global MLS
- 2004-06-27 Listing Removed — Global MLS
- 2004-06-25 Listed $149,900 Global MLS
Property tax history
+5.4%/yrLatest (2025): $5,739 · +6.6% YoY. Source: county tax records.
Cash-flow waterfall
monthlySold comps — $/sqft
last 12 mo · ≤1 miLoading sold comps…