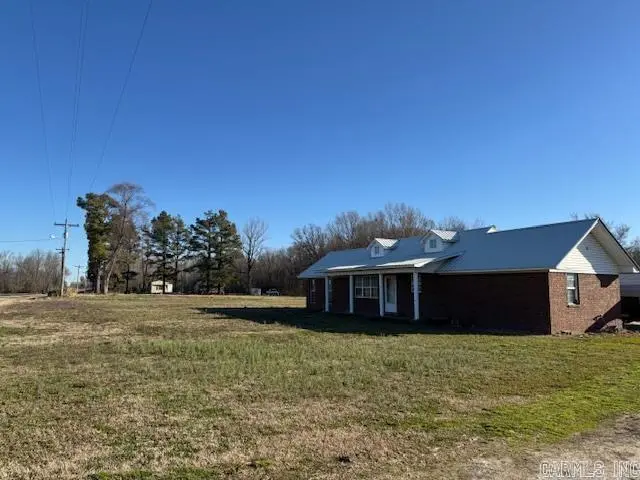
559 Lee 439 Rd · Moro, AR
Flood risk 8/10 · Major
- FEMA flood zone
- —
- Chance of flooding over 30 yrs
- 0.99%
- Est. flood insurance / yr
- —
Fire risk 1/10 · Minimal
- Est. fire insurance / yr
- $1,499 – $2,785
Heat risk 6/10 · Moderate
- Hot days now (above 109°F)
- 7 days/yr
- Hot days in 30 yrs
- 20 days/yr
Wind risk 4/10 · Minor
- Chance of severe wind over 30 yrs
- 24.0%
Air-quality risk 1/10 · Minimal
- Unhealthy air days now
- 0 days/yr
- Unhealthy air days in 30 yrs
- 0 days/yr
Risk factors via First Street. Map © Google.
Why this score? — see what drove the C- grade
The composite is a weighted blend of 9 inputs, each scored 0–100. Each bar is that input's sub-score; the figure is the points it added to the 100-point composite (weight × sub-score).
- Cash flow +22.1/30.0
- ARV discount +7.4/15.0
- DSCR +7.1/10.0
- 1% rule +4.6/10.0
- Appreciation +4.2/10.0
- Livability +2.9/5.0
- Rent growth +2.5/5.0
- Condition / age +2.5/5.0
- Schools +0.6/10.0
$125,000
🖨 Deal sheet 📄 Offer letter ✓ Due diligence
Listing remarks
3 Bedroom 3 bath home in Rural Arkansas Lee County. You will have peaceful country living with plenty of room to enjoy the countryside. Just a short drive from local services. Must see to Appreciate . . private and peaceful lifestyle. A great opportunity for country living.
Key facts
- 1.33 acre lot
- 2 parking spots
- Built 1980
Property features AI
Finance
- Financial info: Financing available: FHA, Conventional, or Cash
Exterior
- Parking: Carport for 2 cars
- Utilities: Septic system
- Home design: Brick exterior
- Construction: Metal roof; Slab foundation
- Exterior features: Porch; Level, cleared yard
Interior
- Kitchen: Free-standing stove; Microwave; Refrigerator stays
- Flooring: Vinyl flooring; Tile flooring
- Bathrooms: 3 full bathrooms
- Heating & cooling: Central electric cooling
- Interior features: Washer stays; Dryer stays; Electric water heater; Ceiling fans; Breakfast bar; Sheetrock walls/ceilings
- Laundry & utility: Washer included; Dryer included
Neighborhood map
What this means for you Summary
Snapshot
- This is a 3-bed/2.0-bath single-family listed at $125k.
Deal economics
- At list price, monthly cash flow is $201 ($2k/yr) — positive.
- The deal already cash-flows at list — no discount required.
- To meet the 1% rule (rent ≥ 1% of price), the offer needs to be $120k (4.0% below list).
- Recommended offer: $120k (4.0% below list) — sets the bar for 1% rule.
Location & tenants
- Location reads 57/100 on livability (#338 in AR) — a working-class tenant base; expect higher turnover. Strengths: cost of living A+, housing A+; Watch: employment D, schools F, crime F.
- Lee County School District (town): math 8% / reading 9% proficiency, ranked #235 of 238 in AR (top 99%) — low school quality limits family demand, transient renter base, plan for 1-2y turnover; 96% free/reduced lunch — lower-income household profile, screen leases tightly.
- Market conditions: 5 active listings in the ZIP; 1 units permitted in Lee County in 2024 (0 in 5+ unit buildings).
Forward outlook
- Local home prices are declining (-1.5%/yr); year-one equity from $864 of loan paydown is wiped out by about $2k of value loss. Plan a longer hold.
- Lee County population projected at -22% by 2050 — secular population decline; favor cash flow + early exit over multi-decade hold.
Negotiation context
- It's been on market 18 days — a 2% lower offer ($123k) is reasonable based on typical stale-listing flexibility.
- 2 sale attempts with the ask held roughly flat each time — persistent listings suggest the price (not the market) is what's stuck; bring a comps-based counter.
Risks & watch-outs
- Climate carrying-cost: severe flood risk; extreme-heat days projected 7→20/yr by 2055 (HVAC capex compounding) — expect insurance premiums to compound above CPI over the hold.
Questions for the listing agent
- Is there a deadline driving the sale (1031 exchange, divorce, estate, relocation)? That informs how much negotiation room exists.
- Schools are F-rated, which usually means shorter tenancies and higher turnover. Who's the typical renter profile here, and what's been the actual vacancy rate?
- Crime grade is F in this area — have there been break-ins, vandalism, or insurance claims at this property in the last 3 years? What carrier currently insures it and at what premium?
- What's the average days-on-market for RENTAL listings here right now (not sales)? A rising rental-DOM trend means longer vacancies and softer asking-rent achievability than the comps imply.
- What's the recent tenant-quality profile in this submarket — average credit score on applications, eviction rate, late-payment / NSF rate, and stable-employment percentage? A property-management company in the area should have these aggregated.
- How much new for-sale + rental construction is in the pipeline within 1–3 miles? Heavy new supply typically softens prices + rents 12–24 months out; constrained supply supports both.
Investment metrics
- 1% rule
- 0.96% ✗
- Cap rate
- 8.22%
- Cash-on-cash
- 6.88%
- DSCR
- 1.31
- GRM
- 8.7
CMA / ARV
- ARV (on-the-fly)
- $124,752
- Comps found
- 1
Show comp detail 1 sale within ~0.75 mi
| Address | Dist | Beds/Ba | Sqft | Sold | Price | $/sf | Match |
|---|---|---|---|---|---|---|---|
| 559 Lee 439 Rd | 0.00mi | 3/3.0 | 1,808 (0%) | 0mo | $125,000 | $69 | 96 |
Match score weights: distance 35% · size 25% · config 20% · recency 20%. Top-matched comps best support the ARV.
Projected returns pro-forma
-1.52% appreciation · 3.0% rent growth · sell at horizon
- IRR
- 0.3%
- Equity multiple
- 1.01×
- Total profit
- $397
- Equity at exit
- $27,078
- IRR
- 7.5%
- Equity multiple
- 1.68×
- Total profit
- $23,829
- Equity at exit
- $25,873
Cash invested: $35,000 (down + closing). Projections, not guarantees.
Landlord ↔ Tenant lean methodology
- Overall (STATE)
- 92 Strongly Landlord-Friendly
- State Arkansas
- 92 Strongly Landlord-Friendly · R+14
- County
- — inherits STATE
- City
- — inherits STATE
ZIP-level market 72368
- Home prices YoY
- -1.6%
- Active inventory
- 5
- Price-to-rent
- 8.7×
Monthly cashflow live
- Estimated rent
- $1,200 medium interval (Pro) →
- Mortgage (P&I)
- −$656
- Tax from tax record
- −$40 /mo · $482/yr
- Insurance
- −$52
- HOA
- −$0
- Vacancy / Maint / Mgmt
- −$252
- Net cashflow
- $201
Break-even live
UW: 25.0% down · 7.5% · 30yr · 1.5% tax · 5.0% vac · 8.0% maint · 8.0% mgmt
Financing live
Cash to close
- Down payment
- $31,250
- Closing costs
- $3,750
- Reserves months
- —
- Total cash needed
- —
Loan-product check · same deal, 3 products live
Conventional
25% down · 7.5% · 30yr
- Down + closing
- —
- Monthly P&I
- —
- Monthly cashflow
- —
- DSCR
- —
- Eligible?
- —
Personal DTI + credit; lowest rate.
DSCR
20% down · 8.5% · 30yr
- Down + closing
- —
- Monthly P&I
- —
- Monthly cashflow
- —
- DSCR
- —
- Eligible?
- —
No personal income docs; deal must DSCR.
Hard money
10% down · 12.0% · 12mo
- Down + closing
- —
- Monthly P&I
- —
- Monthly cashflow
- —
- DSCR
- —
- Eligible?
- —
Short-term bridge; refi at stabilization.
Listing history 5 events
-
2026-04-27status Under Contract
-
2026-04-10$125,000 New Listing
-
2026-03-02historical
-
2025-07-10price $129,000
-
2025-03-11$139,000 New Listing
ⓘ Source: listings_history table (triggers on properties + properties_extension) + one-shot
backfill from property_details.listing_events for pre-trigger history.
Tax reassessment forecast AR · Resets to sale price
- Current annual tax
- $482 · $40/mo
- Projected year-2 tax
- $800 · $67/mo
- Expected delta
- +$318/yr (+$27/mo · 66.0%)
ⓘ Screening estimate from a state-policy table — verify with the county assessor before closing.
Climate risk First Street
- Flood 8/10 Severe 99% chance over 30 yrs
- Wildfire 1/10 Low
- Heat 6/10 Major 7 d/yr ≥109°F today · 20 d/yr by 30 yrs out
- Wind 4/10 Moderate 24% chance of damaging wind over 30 yrs
- Air quality 1/10 Low 0 unhealthy d/yr today · 0 by 30 yrs out
Nearby sold comps map
Loading sold comps map…
Walkable amenities ~0.75 mi
Loading nearby amenities…
Taxation est. · year 1
- Rental income
- $14,405
- − Mortgage interest
- −$7,002
- − Property taxes
- −$482
- − Insurance
- −$625
- − Repairs & maintenance
- −$1,152
- − Management
- −$1,152
- − Depreciation
- −$3,636
- Taxable income
- $355
- Est. tax owed @ 24.0%
- −$85
- After-tax cash flow
- $2,321/yr
For passive investors: Depreciation is non-cash, so a rental often shows a tax loss while cash-flowing — sheltering income. Rental losses are passive: they offset passive income freely, and up to $25,000/yr can offset ordinary (W-2) income if you actively participate and your MAGI is under $100k (phasing out to $0 by $150k); unused losses carry forward. On sale, claimed depreciation is recaptured at up to 25%, and gains may owe capital-gains tax (a 1031 exchange can defer both). Figures are a year-1 estimate at your 24.0% rate — not tax advice; consult a CPA.
Schools (NCES district)
- District
- Lee County School District
- NCES district ID
- 0509360
- Math proficiency
- 8% ▼ -6.00%
- Reading proficiency
- 9% ▼ -5.00%
- Median HH income
- $28,151
- Composite
- 6.29/100
- National rank
- #10002
- State rank
- #235 of 238 in AR
Livability — Moro
- Score
- 57/100
- State rank
- #338
- US rank
- #21512
Category grades
Schools grade is shown separately in the Schools card above.
Census & demographics
- Population (ZIP)
- 1,175
Population outlook (Lee County) Hauer SSP2
- Today (2025)
- 8,633 people
- By 2030
- 8,163 · -5.4%
- By 2040
- 7,360 · -14.7%
- By 2050
- 6,711 · -22.3%
- By 2075
- 5,485 · -36.5%
- By 2100
- 4,611 · -46.6%
Race, ethnicity, and origin ACS 2023
- Neighborhood character
- Predominantly White (76%)
- Race & ethnicity
- White 76% Black 14% Hispanic / Latino 7% Two or more races 2%
- Hispanic origin (detail)
- Mexican 7%
- Common ancestry
- Slovak 2% Iranian 1% Italian 1%
- Foreign-born
- 0%
- Languages at home
- 98% English-only · Spanish 2%
Political lean MEDSL · Lee
- 2024 margin
- Toss-up / Even · D 50.4% · R 46.9% · Other 2.7%
- 2008→2024 swing
- -18.0pp toward R · 2008: 21.5pp · 2024: 3.5pp
- All cycles
- 2024: D+3.5 2020: D+4.8 2016: D+16.9 2012: D+24.2 2008: D+21.5
Not yet ingested
- Civics
- —
Market trends
- HPI YoY
- ▼ -1.52%
- Current HPI
- 94.9789
- Rent YoY
- —
- Metro
- —
- State GDP YoY
- ▲ 3.80%
- F500 in state
- 10
Industry mix (Fortune 500 HQ in AR)
| Industry | F500 HQs | Revenue |
|---|---|---|
| Retail | 1 | $681B |
|
||
| Food / Agriculture | 1 | $53B |
|
||
| Retail / Energy | 1 | $22B |
|
||
| Transportation / Logistics | 1 | $12B |
|
||
| Energy | 1 | $4B |
|
||
Price history
-10.1% since first listed5 events — show timeline
- 2026-04-27 Pending — CARMLS
- 2026-04-10 Listed $125,000 CARMLS
- 2026-03-02 Listing Removed — CARMLS
- 2025-07-10 Price Changed $129,000 CARMLS
- 2025-03-11 Listed $139,000 CARMLS
Property tax history
+0.5%/yrLatest (2025): $482 · -52.0% YoY. Source: county tax records.
Cash-flow waterfall
monthlySold comps — $/sqft
last 12 mo · ≤1 miLoading sold comps…