 Triplex
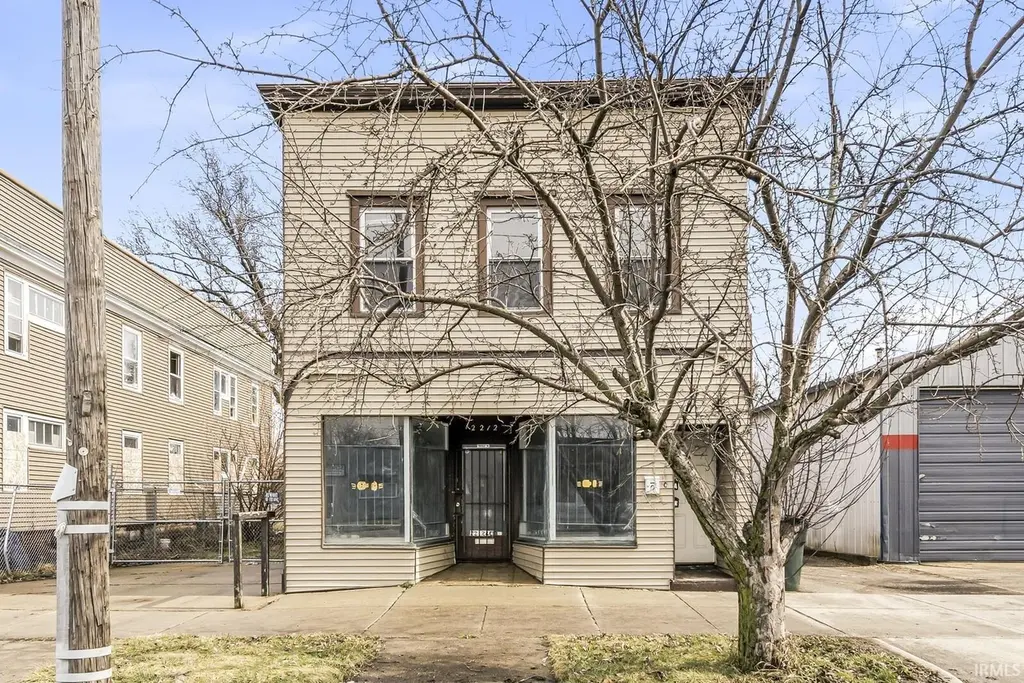
2212 S Michigan St · South Bend, IN
Flood risk 1/10 · Minimal
- FEMA flood zone
- AE
- Chance of flooding over 30 yrs
- 0.0%
- Est. flood insurance / yr
- $1,737 – $8,500
Fire risk 1/10 · Minimal
- Est. fire insurance / yr
- $717 – $1,331
Heat risk 2/10 · Minimal
- Hot days now (above 99°F)
- 7 days/yr
- Hot days in 30 yrs
- 16 days/yr
Wind risk 2/10 · Minimal
- Chance of severe wind over 30 yrs
- —
Air-quality risk 3/10 · Minor
- Unhealthy air days now
- 2 days/yr
- Unhealthy air days in 30 yrs
- 3 days/yr
Risk factors via First Street. Map © Google.
Why this score? — see what drove the B- grade
The composite is a weighted blend of 9 inputs, each scored 0–100. Each bar is that input's sub-score; the figure is the points it added to the 100-point composite (weight × sub-score).
- Cash flow +30.0/30.0
- 1% rule +10.0/10.0
- DSCR +10.0/10.0
- ARV discount +7.5/15.0
- Rent growth +3.5/5.0
- Livability +3.2/5.0
- Condition / age +2.2/5.0
- Schools +1.4/10.0
- Appreciation +0.0/10.0
$129,900
🖨 Deal sheet 📄 Offer letter ✓ Due diligence
Multi-family units
County records classify this as Multi-Family (2-4 Unit). Listing-text estimate: 3 units. confirmed
Listing remarks MLS
MOTIVATED SELLER ALERT!! Looking for a great investment opportunity to add to your portfolio? Look no further than this spacious building that has been recently renovated. The main level offers a storefront (Unit C-no rental history) with a private office and half bathroom that is ready for immediate use. Main level (Unit D-entrance at the back of the building and was collecting $950/$975 per month) is a 2 bedroom apartment with full bathroom. Both upper level apartments have their own private entrances. Unit B (was collecting $850/$875 per month) is a 1 bedroom 1 bathroom efficiency. The other upper unit (Unit A-no rental history) is a 3 bedroom and 1 bathroom efficiency. All units have separate metered utilities. Call today to schedule a private tour to make this building yours.
Key facts
- Private entrances
- Store front
- Office area
Tags
Neighborhood map
What this means for you Summary
Snapshot
- This is a 3 × 5-bed/?-bath units multifamily listed at $130k. Condition is rated fair.
Deal economics
- At list price, monthly cash flow is $3k ($32k/yr) — positive. Per door: $890/mo.
- The deal already cash-flows at list — no discount required.
- Meets the 1% rule at list price ($5k rent vs $130k).
- Recommended offer: $122k (6.0% below list) — sets the bar for market timing.
- Cap rate 34.9% vs local median 4.4% in South Bend — top-decile yield for the area; either an underpriced asset or a hidden risk that comps aren't pricing in. Stress-test before assuming the spread holds.
Location & tenants
- Location reads 64/100 on livability (#365 in IN) — a middle-class / working-renter tenant base. Strengths: cost of living A+, housing A+, health & safety A+; Watch: amenities D, employment D, schools F.
- South Bend Community School Corporation (urban): math 12% / reading 21% proficiency, ranked #284 of 301 in IN (top 94%) — low school quality limits family demand, transient renter base, plan for 1-2y turnover; 66% free/reduced lunch — lower-income household profile, screen leases tightly.
- Market conditions: Rents rising fast (+4.1%/yr); 77 active listings in the ZIP; lower-income renter base — watch delinquency; 754 units permitted in St. Joseph County in 2024 (460 in 5+ unit buildings).
- At $5,057/mo this rent would consume 143% of the median local household income ($43k/yr) (locally 545% of renters already pay >50% of income on rent) — very limited rent-growth headroom before tenants either downsize or default.
Forward outlook
- Local home prices are declining (-3.0%/yr); year-one equity from $898 of loan paydown is wiped out by about $4k of value loss. Plan a longer hold.
- At projected returns (-3.0% appreciation + 4.1% rent growth), your $36k cash investment doubles in ~2 years — after that, you're playing with house money.
Negotiation context
- It's been on market 62 days — a 6% lower offer ($122k) is reasonable based on typical stale-listing flexibility.
- 4 sale attempts since 5y ago; this cycle's ask has dropped $15k (10%) from the opening price — seller is motivated, your offer sets the floor, not the list.
Risks & watch-outs
- Watch-outs: flood insurance adds $427/mo; built in 1890 — expect roof / HVAC / electrical / plumbing capex.
- Climate carrying-cost: in FEMA flood zone AE (mandatory federal flood insurance) — expect insurance premiums to compound above CPI over the hold.
Questions for the listing agent
- It's been on market 62 days. Have you received any prior offers? Is the seller open to a 6% concession, seller financing, or rate buy-down credit?
- Can we see the unit-by-unit rent roll, current vacancy, and any below-market leases? What's the average tenancy length?
- What capital expenditures (roof, boiler, parking lot, exteriors) have been made in the last 5 years, and what's planned in the next 2?
- Have any recent inspections been done? Can we get a copy of the seller's disclosures and any deferred-maintenance estimates?
- Built in 1890 — when were the roof, HVAC, electrical panel, plumbing, and water heater last replaced?
- What's the actual annual flood-insurance premium (NFIP or private), and is the property in a SFHA with mandatory coverage?
- Why hasn't it sold? Are there any deal-killer items the seller is aware of (foundation, flood, title, zoning, code violations)?
- Is there a deadline driving the sale (1031 exchange, divorce, estate, relocation)? That informs how much negotiation room exists.
- Schools are F-rated, which usually means shorter tenancies and higher turnover. Who's the typical renter profile here, and what's been the actual vacancy rate?
- Crime grade is F in this area — have there been break-ins, vandalism, or insurance claims at this property in the last 3 years? What carrier currently insures it and at what premium?
- What's the average days-on-market for RENTAL listings here right now (not sales)? A rising rental-DOM trend means longer vacancies and softer asking-rent achievability than the comps imply.
- What's the recent tenant-quality profile in this submarket — average credit score on applications, eviction rate, late-payment / NSF rate, and stable-employment percentage? A property-management company in the area should have these aggregated.
- How much new apartment / multifamily construction is in the pipeline within 1–3 miles? Heavy new supply (>2% of stock underway) typically softens rents 12–24 months out; light construction supports rent growth.
Investment metrics
- 1% rule
- 3.89% ✓
- Cap rate
- 34.91%
- Cash-on-cash
- 102.19%
- DSCR
- 5.55
- GRM
- 2.1
CMA / ARV
- ARV (median comp)
- $84,343
- List price
- $129,900
- Delta
- 54.01%
- Verdict
- OVERPRICED
- Comps
- 2 within 1.0 mi
Projected returns pro-forma
-3.0% appreciation · 4.08% rent growth · sell at horizon
- IRR
- 90.1%
- Equity multiple
- 5.26×
- Total profit
- $154,946
- Equity at exit
- $19,369
- IRR
- 93.4%
- Equity multiple
- 11.41×
- Total profit
- $378,633
- Equity at exit
- $11,231
Cash invested: $36,372 (down + closing). Projections, not guarantees.
Landlord ↔ Tenant lean methodology
- Overall (STATE)
- 90 Strongly Landlord-Friendly
- State Indiana
- 90 Strongly Landlord-Friendly · R+11
- County
- — inherits STATE
- City
- — inherits STATE
ZIP-level market 46613
- Home prices YoY
- -7.2%
- Rents YoY
- 4.1%
- Active inventory
- 77
- Price-to-rent
- 6.4×
Monthly cashflow live
- Estimated rent
- $5,057 medium interval (Pro) →
- Mortgage (P&I)
- −$681
- Tax est. 1.5%
- −$162 /mo · $1,948/yr
- Insurance
- −$54
- Flood insurance flood zone
- −$427 /mo · $5,118/yr
- HOA
- −$0
- Vacancy / Maint / Mgmt
- −$1,062
- Net cashflow
- $2,671
Break-even live
3-unit breakdown (identical units grouped — click to expand)
| Units | Beds | Baths | Est. rent |
|---|---|---|---|
| 3× units | 5 | — | $5,058 |
| #1 | 5 | — | $1,686 |
| #2 | 5 | — | $1,686 |
| #3 | 5 | — | $1,686 |
| Total (3 units) | $5,057 | ||
UW: 25.0% down · 7.5% · 30yr · 1.5% tax · 5.0% vac · 8.0% maint · 8.0% mgmt
Financing live
Cash to close
- Down payment
- $32,475
- Closing costs
- $3,897
- Reserves months
- —
- Total cash needed
- —
Loan-product check · same deal, 3 products live
Conventional
25% down · 7.5% · 30yr
- Down + closing
- —
- Monthly P&I
- —
- Monthly cashflow
- —
- DSCR
- —
- Eligible?
- —
Personal DTI + credit; lowest rate.
DSCR
20% down · 8.5% · 30yr
- Down + closing
- —
- Monthly P&I
- —
- Monthly cashflow
- —
- DSCR
- —
- Eligible?
- —
No personal income docs; deal must DSCR.
Hard money
10% down · 12.0% · 12mo
- Down + closing
- —
- Monthly P&I
- —
- Monthly cashflow
- —
- DSCR
- —
- Eligible?
- —
Short-term bridge; refi at stabilization.
Listing history 9 events
-
2026-05-14historical Active Under Contract 791-char remark
Show marketing remark (791 chars)
MOTIVATED SELLER ALERT!! Looking for a great investment opportunity to add to your portfolio? Look no further than this spacious building that has been recently renovated. The main level offers a storefront (Unit C-no rental history) with a private office and half bathroom that is ready for immediate use. Main level (Unit D-entrance at the back of the building and was collecting $950/$975 per month) is a 2 bedroom apartment with full bathroom. Both upper level apartments have their own private entrances. Unit B (was collecting $850/$875 per month) is a 1 bedroom 1 bathroom efficiency. The other upper unit (Unit A-no rental history) is a 3 bedroom and 1 bathroom efficiency. All units have separate metered utilities. Call today to schedule a private tour to make this building yours.
-
2026-04-20price $129,900 791-char remark
Show marketing remark (791 chars)
MOTIVATED SELLER ALERT!! Looking for a great investment opportunity to add to your portfolio? Look no further than this spacious building that has been recently renovated. The main level offers a storefront (Unit C-no rental history) with a private office and half bathroom that is ready for immediate use. Main level (Unit D-entrance at the back of the building and was collecting $950/$975 per month) is a 2 bedroom apartment with full bathroom. Both upper level apartments have their own private entrances. Unit B (was collecting $850/$875 per month) is a 1 bedroom 1 bathroom efficiency. The other upper unit (Unit A-no rental history) is a 3 bedroom and 1 bathroom efficiency. All units have separate metered utilities. Call today to schedule a private tour to make this building yours.
-
2026-03-24$145,000 Active 791-char remark
Show marketing remark (791 chars)
MOTIVATED SELLER ALERT!! Looking for a great investment opportunity to add to your portfolio? Look no further than this spacious building that has been recently renovated. The main level offers a storefront (Unit C-no rental history) with a private office and half bathroom that is ready for immediate use. Main level (Unit D-entrance at the back of the building and was collecting $950/$975 per month) is a 2 bedroom apartment with full bathroom. Both upper level apartments have their own private entrances. Unit B (was collecting $850/$875 per month) is a 1 bedroom 1 bathroom efficiency. The other upper unit (Unit A-no rental history) is a 3 bedroom and 1 bathroom efficiency. All units have separate metered utilities. Call today to schedule a private tour to make this building yours.
-
2024-04-29price $200,000
-
2024-03-19$230,000 Active
-
2023-03-24soldstatus $160,000 Closed
-
2023-03-16status Pending
-
2023-03-10$160,000 Active
-
2021-09-20$150,000
ⓘ Source: listings_history table (triggers on properties + properties_extension) + one-shot
backfill from property_details.listing_events for pre-trigger history.
Climate risk First Street
- Flood 1/10 Low FEMA zone AE · 0% chance over 30 yrs
- Wildfire 1/10 Low
- Heat 2/10 Low 7 d/yr ≥99°F today · 16 d/yr by 30 yrs out
- Wind 2/10 Low
- Air quality 3/10 Moderate 2 unhealthy d/yr today · 3 by 30 yrs out
Nearby sold comps map
Loading sold comps map…
Walkable amenities ~0.75 mi
Loading nearby amenities…
Taxation est. · year 1
- Rental income
- $60,684
- − Mortgage interest
- −$7,276
- − Property taxes
- −$1,948
- − Insurance
- −$5,768
- − Repairs & maintenance
- −$4,855
- − Management
- −$4,855
- − Depreciation
- −$3,779
- Taxable income
- $32,203
- Est. tax owed @ 24.0%
- −$7,729
- After-tax cash flow
- $24,321/yr
For passive investors: Depreciation is non-cash, so a rental often shows a tax loss while cash-flowing — sheltering income. Rental losses are passive: they offset passive income freely, and up to $25,000/yr can offset ordinary (W-2) income if you actively participate and your MAGI is under $100k (phasing out to $0 by $150k); unused losses carry forward. On sale, claimed depreciation is recaptured at up to 25%, and gains may owe capital-gains tax (a 1031 exchange can defer both). Figures are a year-1 estimate at your 24.0% rate — not tax advice; consult a CPA.
Condition & rehab AI · 13 photos
This multi-family property requires significant repairs and maintenance to improve its condition and increase its value. The home is in fair condition with several areas in poor condition, including the kitchen, bathrooms, exterior, and windows. The highest-ROI updates include painting the interior, replacing the kitchen cabinets and fixtures, and replacing the exterior siding and windows.
Repairs flagged
- Major Kitchen cabinets — The kitchen cabinets are visibly damaged and need to be replaced.
- Major Bathroom fixtures — The bathroom fixtures are in poor condition and need to be replaced.
- Major Exterior siding — The exterior siding is peeling and damaged, requiring replacement.
- Major Windows — The windows are in poor condition and need to be replaced or repaired.
Value-add opportunities
- Both Paint the interior walls and ceilings — Painting the interior walls and ceilings can improve the overall appearance and increase the home's value.
- Both Replace the kitchen cabinets and fixtures — Replacing the kitchen cabinets and fixtures can improve the functionality and appearance of the kitchen, increasing the home's value.
- Both Replace the bathroom fixtures — Replacing the bathroom fixtures can improve the functionality and appearance of the bathrooms, increasing the home's value.
- Both Replace the exterior siding — Replacing the exterior siding can improve the home's curb appeal and increase its value.
- Both Repair or replace the windows — Repairing or replacing the windows can improve the home's energy efficiency and increase its value.
Renovation cost estimate screening
| Repair item | Severity | Est. cost |
|---|---|---|
| Kitchen cabinets · The kitchen cabinets are visibly damaged and need to be replaced. | Major | $15,000–50,000 |
| Bathroom fixtures · The bathroom fixtures are in poor condition and need to be replaced. | Major | $15,000–50,000 |
| Exterior siding · The exterior siding is peeling and damaged, requiring replacement. | Major | $15,000–50,000 |
| Windows · The windows are in poor condition and need to be replaced or repaired. | Major | $15,000–50,000 |
| Total estimated repair cost · 4 items | $60,000–200,000 |
Value-add ROI direction
- Both Paint the interior walls and ceilings — Painting the interior walls and ceilings can improve the overall appearance and increase the home's value. ↑
- Both Replace the kitchen cabinets and fixtures — Replacing the kitchen cabinets and fixtures can improve the functionality and appearance of the kitchen, increasing the home's value. ↑
- Both Replace the bathroom fixtures — Replacing the bathroom fixtures can improve the functionality and appearance of the bathrooms, increasing the home's value. ↑
- Both Replace the exterior siding — Replacing the exterior siding can improve the home's curb appeal and increase its value. ↑
- Both Repair or replace the windows — Repairing or replacing the windows can improve the home's energy efficiency and increase its value. ↑
ⓘ Cost ranges are severity-bucket heuristics (US national rule-of-thumb). Get contractor quotes + a written scope before underwriting a rehab budget.
Schools (NCES district)
- District
- South Bend Community School Corporation
- NCES district ID
- 1810290
- Math proficiency
- 12% ▼ -10.00%
- Reading proficiency
- 21% ▼ -6.00%
- Median HH income
- $41,935
- Composite
- 14.21/100
- National rank
- #9452
- State rank
- #284 of 301 in IN
Livability — South Bend
- Score
- 64/100
- State rank
- #365
- US rank
- #13730
Category grades
Schools grade is shown separately in the Schools card above.
Census & demographics
- Census place
- South Bend, IN
- County
- Saint Joseph County · 189,048 people
- City population
- 99,767
- Metro
- South Bend-Mishawaka, IN-MI
- Population (ZIP)
- 12,279
- Household income
- $42,537
- Rent vs Own
- Severe rent burden
- 545.0
Population outlook (St. Joseph County) Hauer SSP2
- Today (2025)
- 273,186 people
- By 2030
- 273,594 · +0.1%
- By 2040
- 271,641 · -0.6%
- By 2050
- 269,187 · -1.5%
- By 2075
- 263,136 · -3.7%
- By 2100
- 245,659 · -10.1%
Race, ethnicity, and origin ACS 2023
- Neighborhood character
- Highly diverse neighborhood (Simpson 0.72)
- Race & ethnicity
- White 41% Hispanic / Latino 24% Black 23% Two or more races 22% Asian 2% Native American 1%
- Hispanic origin (detail)
- Mexican 22%
- Common ancestry
- Romanian 4% Italian 1% Slovak 1%
- Foreign-born
- 9% · Canada, Philippines
- Languages at home
- 81% English-only · Spanish 17% Other Asian/Pacific 1%
Political lean MEDSL · St. Joseph
- 2024 margin
- Toss-up / Even · D 50.0% · R 48.5% · Other 1.5%
- 2008→2024 swing
- -15.6pp toward R · 2008: 17.1pp · 2024: 1.5pp
- All cycles
- 2024: D+1.5 2020: D+5.8 2016: D+0.2 2012: D+3.5 2008: D+17.1
Not yet ingested
- Civics
- —
Market trends
- HPI YoY
- ▼ -20.88%
- Current HPI
- 270.0303
- Rent YoY
- ▲ 4.08%
- Metro
- South Bend-Mishawaka, IN-MI
- State GDP YoY
- ▲ 2.90%
- F500 in state
- 18
Industry mix (Fortune 500 HQ in IN)
| Industry | F500 HQs | Revenue |
|---|---|---|
| Industrial Machinery | 2 | $37B |
|
||
| Healthcare | 1 | $177B |
|
||
| Pharmaceuticals | 1 | $45B |
|
||
| Metals / Steel | 1 | $18B |
|
||
| Agriculture | 1 | $17B |
|
||
| Packaging | 1 | $12B |
|
||
Price history
-13.4% since first listed9 events — show timeline
- 2026-05-14 Contingent — IRMLS
- 2026-04-20 Price Changed $129,900 IRMLS
- 2026-03-24 Listed $145,000 IRMLS
- 2024-04-29 Price Changed $200,000 IRMLS
- 2024-03-19 Listed $230,000 IRMLS
- 2023-03-24 Sold (MLS) $160,000 IRMLS
- 2023-03-16 Pending — IRMLS
- 2023-03-10 Listed $160,000 IRMLS
- 2021-09-20 Listed $150,000 IRMLS
Cash-flow waterfall
monthlySold comps — $/sqft
last 12 mo · ≤1 miLoading sold comps…