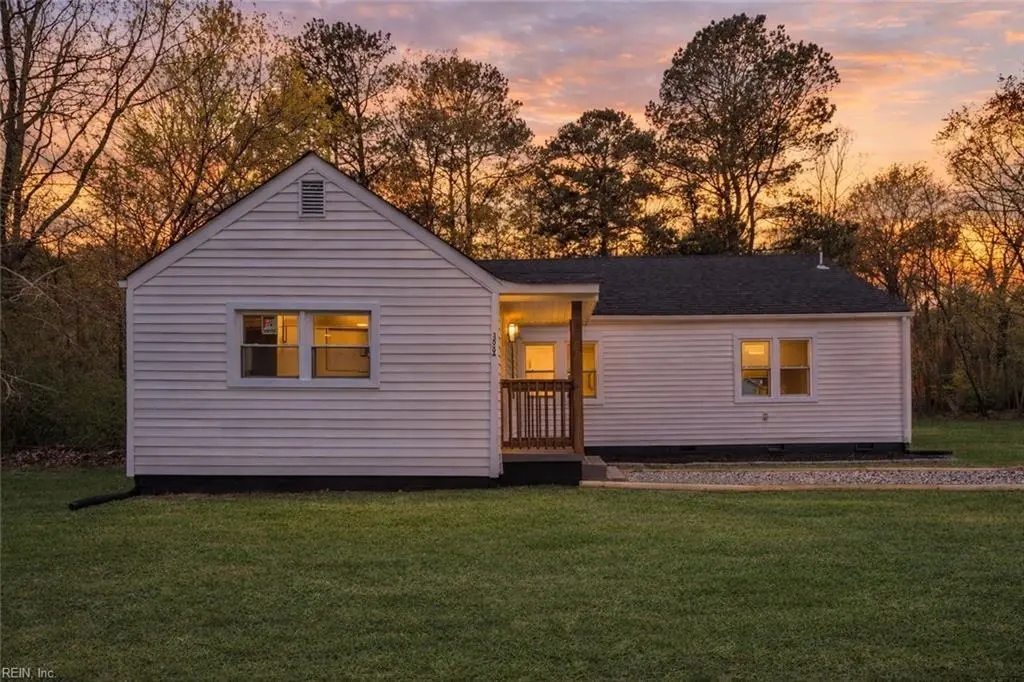
12050 Greenbrier Ln · Smithfield, VA
Flood risk 1/10 · Minimal
- FEMA flood zone
- X (unshaded)
- Chance of flooding over 30 yrs
- 0.0%
- Est. flood insurance / yr
- $507 – $1,088
Fire risk 3/10 · Minor
- Est. fire insurance / yr
- $666 – $1,236
Heat risk 8/10 · Major
- Hot days now (above 106°F)
- 7 days/yr
- Hot days in 30 yrs
- 16 days/yr
Wind risk 8/10 · Major
- Chance of severe wind over 30 yrs
- 80.0%
Air-quality risk 1/10 · Minimal
- Unhealthy air days now
- 0 days/yr
- Unhealthy air days in 30 yrs
- 0 days/yr
Risk factors via First Street. Map © Google.
Why this score? — see what drove the D grade
The composite is a weighted blend of 9 inputs, each scored 0–100. Each bar is that input's sub-score; the figure is the points it added to the 100-point composite (weight × sub-score).
- ARV discount +15.0/15.0
- Cash flow +8.7/30.0
- Schools +5.9/10.0
- Livability +3.9/5.0
- Rent growth +2.5/5.0
- Condition / age +2.5/5.0
- DSCR +2.4/10.0
- 1% rule +1.6/10.0
- Appreciation +0.0/10.0
$379,500
🖨 Deal sheet (PDF) 📄 Offer letter ✓ Due diligence
Listing remarks
This fully renovated rancher offers privacy, comfort, and peace of mind with major updates including a new roof 2026, brand new HVAC and electrical panel and brand new windows. Inside, brand new LVP floors, welcoming atmosphere, complemented by a timeless neutral color palette. The primary suite with a spacious closet, and a beautifully fully renovated bathroom. Three additional bedrooms and a full hall bath. Conveniently located near military bases and just minutes from downtown Smithfield’s shops and dining, this home offers the perfect blend of lifestyle and location.
Key facts
- New lvp floors
- New hvac
- New electrical panel
Tags
Property features AI
Finance
- HOA & community: No HOA fees indicated
Exterior
- Parking: Off-street parking; Street parking
- Utilities: City/County sewer; Electric water heater; Electric power
- Home design: Detached ranch-style home; Single-story
- Construction: Crawl-space foundation
- Exterior features: Vinyl siding; Asphalt shingle roof
Interior
- Kitchen: Dishwasher; Disposal; Microwave; Electric range; Refrigerator
- Bedrooms: Master bedroom; Additional bedroom; Bedroom and full bathroom located on the first floor
- Flooring: Carpet; Laminate
- Bathrooms: 2 full bathrooms
- Heating & cooling: Heat pump heating; Central air conditioning
- Interior features: Carpet and laminate flooring; Bedroom with full bathroom on the first floor; 8 total rooms (living room, great room, dining room, family room, kitchen, utility room, master bedroom, additional bedroom, full bathroom)
- Laundry & utility: Washer hookup; Dryer hookup; Utility room
Neighborhood map
What this means for you Summary
Snapshot
- This is a 4-bed/3.0-bath single-family listed at $380k.
Deal economics
- At list price, monthly cash flow is $-316 ($-4k/yr) — negative.
- To cash-flow at today's rent, offer at most $324k (14.7% below list).
- To meet the 1% rule (rent ≥ 1% of price), the offer needs to be $252k (33.7% below list).
- Recommended offer: $252k (33.7% below list) — sets the bar for 1% rule.
- Cap rate 5.3% vs local median 2.6% in Smithfield — top-decile yield for the area; either an underpriced asset or a hidden risk that comps aren't pricing in. Stress-test before assuming the spread holds.
Location & tenants
- Location reads 78/100 on livability (#82 in VA, #2,722 nationally) — a middle-class / working-renter tenant base. Strengths: employment A+, housing A+, health & safety A+; Watch: amenities F, commute F.
- Isle Of Wight County Public School District (rural): math 62% / reading 73% proficiency, ranked #28 of 131 in VA (top 21%) — acceptable for families but not a draw, mixed tenant base, ~2y average lease.
- Zoned schools: Hardy Elementary (math 67% / reading 67%, grade B+, #381 of 1,108 statewide, top 36%, 526 students, 49% FRL); Westside Elementary (math 56% / reading 69%, grade B+, #139 of 342 statewide, top 41%, 729 students, 34% FRL); Smithfield High (math 66% / reading 80%, grade B+, #129 of 319 statewide, top 41%, 1,347 students, 33% FRL).
- Market conditions: 211 active listings in the ZIP; 3 comparable units currently listed for rent nearby; rentals at typical pace (median 17d on market — plan ~3-4 weeks tenant-placement turnaround); 257 units permitted in Isle of Wight County in 2024 (0 in 5+ unit buildings).
Forward outlook
- Local home prices are declining (-3.0%/yr); year-one equity from $3k of loan paydown is wiped out by about $11k of value loss. Plan a longer hold.
- Isle of Wight County population projected at +10% by 2050 — modest demand growth; plan on rents tracking national, not racing it.
Negotiation context
- Only 11 days on market — expect competitive offers; lowballing is unlikely to land.
- 9 sale attempts since 11y ago with the ask held roughly flat each time — persistent listings suggest the price (not the market) is what's stuck; bring a comps-based counter.
- Current owner paid $205k; list at $380k implies a 85% gain — meaningful room to come down on a strong offer.
Risks & watch-outs
- Watch-outs: built in 1952 — expect roof / HVAC / electrical / plumbing capex.
- Climate carrying-cost: severe wind risk, 80% chance of damaging wind over 30y; extreme-heat days projected 7→16/yr by 2055 (HVAC capex compounding) — expect insurance premiums to compound above CPI over the hold.
Questions for the listing agent
- What do current leases actually rent for vs. the listed asking? Can we see a recent rent roll and the last 12 months of T-12 income?
- Built in 1952 — when were the roof, HVAC, electrical panel, plumbing, and water heater last replaced?
- Is there a deadline driving the sale (1031 exchange, divorce, estate, relocation)? That informs how much negotiation room exists.
- Schools are B-rated — typically a magnet for longer-tenancy family renters. What's the average tenant stay here, and is there a school-zone premium baked into asking?
- The area grade is low — what's the realistic commute time and amenity access for the typical tenant pool here? Any planned neighborhood developments (good or bad) we should know about?
- What's the average days-on-market for RENTAL listings here right now (not sales)? A rising rental-DOM trend means longer vacancies and softer asking-rent achievability than the comps imply.
- What's the recent tenant-quality profile in this submarket — average credit score on applications, eviction rate, late-payment / NSF rate, and stable-employment percentage? A property-management company in the area should have these aggregated.
- How much new for-sale + rental construction is in the pipeline within 1–3 miles? Heavy new supply typically softens prices + rents 12–24 months out; constrained supply supports both.
Investment metrics
- 1% rule
- 0.66% ✗
- Cap rate
- 5.29%
- Cash-on-cash
- -3.57%
- DSCR
- 0.84
- GRM
- 12.6
CMA / ARV
- ARV (median comp)
- $455,000
- List price
- $379,500
- Delta
- -16.59%
- Verdict
- UNDERPRICED
- Comps
- 18 within 1.0 mi
Show comp detail 5 sales within ~0.75 mi
| Address | Dist | Beds/Ba | Sqft | Sold | Price | $/sf | Match |
|---|---|---|---|---|---|---|---|
| 12050 Greenbrier Ln | 0.00mi | 3/3.0 (-1) | 2,156 (0%) | 6mo | $205,100 | $95 | 90 |
| 409 Southampton Ct | 0.64mi | 4/2.5 | 2,280 (+6%) | 8mo | $405,000 | $178 | 52 |
| 1406 Wharf Hill Dr | 0.46mi | 3/2.0 (-1) | 1,897 (-12%) | 2mo | $559,900 | $295 | 48 |
| 141 Lane Cres | 0.58mi | 3/2.0 (-1) | 2,057 (-5%) | 11mo | $400,000 | $194 | 47 |
| 100 Minton Way | 0.70mi | 3/2.0 (-1) | 2,030 (-6%) | 2mo | $445,000 | $219 | 47 |
Match score weights: distance 35% · size 25% · config 20% · recency 20%. Top-matched comps best support the ARV.
Projected returns pro-forma
-3.0% appreciation · 3.0% rent growth · sell at horizon
- IRR
- -22.4%
- Equity multiple
- 0.23×
- Total profit
- $-81,798
- Equity at exit
- $56,585
- IRR
- -16.6%
- Equity multiple
- 0.08×
- Total profit
- $-97,810
- Equity at exit
- $32,812
Cash invested: $106,260 (down + closing). Projections, not guarantees.
Landlord ↔ Tenant lean methodology
- Overall (STATE)
- 55 Moderately Landlord-Leaning
- State Virginia
- 55 Moderately Landlord-Leaning · D+2
- County
- — inherits STATE
- City
- — inherits STATE
ZIP-level market 23430
- Home prices YoY
- -17.2%
- Active inventory
- 211
- Price-to-rent
- 12.6×
Monthly cashflow live
- Estimated rent
- $2,515 medium interval (Pro) →
- Mortgage (P&I)
- −$1,990
- Tax from tax record
- −$155 /mo · $1,862/yr
- Insurance
- −$158
- HOA
- −$0
- Vacancy / Maint / Mgmt
- −$528
- Net cashflow
- $-316
Break-even live
Sensitivity live
| Price | -10% $-101 | -5% $-209 | +0% $-316 | +5% $-424 | +10% $-531 |
|---|---|---|---|---|---|
| Rent | -10% $-515 | -5% $-416 | +0% $-316 | +5% $-217 | +10% $-118 |
| Rate | -1.0pp $-125 | -0.5pp $-220 | base $-316 | +0.5pp $-415 | +1.0pp $-515 |
UW: 25.0% down · 7.5% · 30yr · 1.5% tax · 5.0% vac · 8.0% maint · 8.0% mgmt
Financing live
Cash to close
- Down payment
- $94,875
- Closing costs
- $11,385
- Reserves months
- —
- Total cash needed
- —
Loan-product check · same deal, 3 products live
Conventional
25% down · 7.5% · 30yr
- Down + closing
- —
- Monthly P&I
- —
- Monthly cashflow
- —
- DSCR
- —
- Eligible?
- —
Personal DTI + credit; lowest rate.
DSCR
20% down · 8.5% · 30yr
- Down + closing
- —
- Monthly P&I
- —
- Monthly cashflow
- —
- DSCR
- —
- Eligible?
- —
No personal income docs; deal must DSCR.
Hard money
10% down · 12.0% · 12mo
- Down + closing
- —
- Monthly P&I
- —
- Monthly cashflow
- —
- DSCR
- —
- Eligible?
- —
Short-term bridge; refi at stabilization.
Rent comps 3 comps
| Address | Beds | Baths | Sqft | Rent | $/sqft | DOM | Units | Dist |
|---|---|---|---|---|---|---|---|---|
| 202 Lakeview Cove Smithfield, VA | 3.0 | 3.0 | 1891 | $2,600 | $1.37 | 16d | 1 | 0.73mi |
| 1604 Colonial Ave Smithfield, VA | 3.0 | 2.0 | 1556 | $2,499 | $1.61 | 45d | 1 | 0.87mi |
| 32 Riverside Dr Smithfield, VA | 3.0 | 2.0 | 1832 | $2,400 | $1.31 | 16d | 1 | 1.11mi |
Listing history 37 events
-
2026-06-21days on market $379,500 Active 11 DOM
-
2026-06-18days on market $379,500 Active 8 DOM
-
2026-06-17days on market $379,500 Active 7 DOM
-
2026-06-16days on market $379,500 Active 6 DOM
-
2026-06-15days on market $379,500 Active 5 DOM
-
2026-06-13days on market $379,500 Active 3 DOM
-
2026-06-01days on market $379,500 Active 25 DOM
-
2026-05-31days on market $379,500 Active 24 DOM
-
2026-05-13price $380,000 583-char remark
-
2026-05-07$374,000 Active 583-char remark
-
2026-05-07historical
-
2026-04-29price $374,000
-
2026-04-16price $384,000
-
2026-04-01$389,000 Active
-
2025-12-18soldstatus $205,100 Sold
-
2025-11-04status Under Contract
-
2025-10-27status Active
-
2025-10-17status Under Contract
-
2025-10-07$175,000 Active
-
2025-05-02soldstatus $226,935
-
2025-04-22historical
-
2024-10-30$253,000 Active
-
2023-08-18status Under Contract
-
2023-08-18status Active Under Contract
-
2023-08-18historical
-
2023-08-17historical
-
2023-07-06historical Active Under Contract
-
2023-06-12price $175,000
-
2023-05-19price $231,005
-
2023-05-17$192,000 Active
-
2017-09-26soldstatus $170,000
-
2016-03-25soldstatus $117,800
-
2016-01-20status Under Contract
-
2016-01-19historical
-
2015-10-19price $117,000
-
2015-09-25$125,000 Active
-
2015-05-11price $125,900
ⓘ Source: listings_history table (triggers on properties + properties_extension) + one-shot
backfill from property_details.listing_events for pre-trigger history.
Tax reassessment forecast VA · Resets to sale price
- Current annual tax
- $1,862 · $155/mo
- Projected year-2 tax
- $3,112 · $259/mo
- Expected delta
- +$1,250/yr (+$104/mo · 67.1%)
ⓘ Screening estimate from a state-policy table — verify with the county assessor before closing.
Climate risk First Street
- Flood 1/10 Low FEMA zone X (unshaded) · 0% chance over 30 yrs
- Wildfire 3/10 Moderate
- Heat 8/10 Severe 7 d/yr ≥106°F today · 16 d/yr by 30 yrs out
- Wind 8/10 Severe 80% chance of damaging wind over 30 yrs
- Air quality 1/10 Low 0 unhealthy d/yr today · 0 by 30 yrs out
Nearby sold comps map
Loading sold comps map…
Walkable amenities ~0.75 mi
Loading nearby amenities…
Taxation est. · year 1
- Rental income
- $30,185
- − Mortgage interest
- −$21,258
- − Property taxes
- −$1,862
- − Insurance
- −$1,898
- − Repairs & maintenance
- −$2,415
- − Management
- −$2,415
- − Depreciation
- −$11,040
- Taxable loss
- −$10,702
- Est. tax savings @ 24.0%
- +$2,569
- After-tax cash flow
- $-1,227/yr
For passive investors: Depreciation is non-cash, so a rental often shows a tax loss while cash-flowing — sheltering income. Rental losses are passive: they offset passive income freely, and up to $25,000/yr can offset ordinary (W-2) income if you actively participate and your MAGI is under $100k (phasing out to $0 by $150k); unused losses carry forward. On sale, claimed depreciation is recaptured at up to 25%, and gains may owe capital-gains tax (a 1031 exchange can defer both). Figures are a year-1 estimate at your 24.0% rate — not tax advice; consult a CPA.
Schools (NCES district)
- District
- Isle Of Wight County Public School District
- NCES district ID
- 5102010
- Math proficiency
- 62% ▼ -21.00%
- Reading proficiency
- 73% ▼ -7.00%
- Median HH income
- $64,756
- Composite
- 58.67/100
- National rank
- #982
- State rank
- #28 of 131 in VA
Livability — Smithfield
- Score
- 78/100
- State rank
- #82
- US rank
- #2722
Category grades
Schools grade is shown separately in the Schools card above.
Census & demographics
- Census place
- Smithfield, VA
- Population (ZIP)
- 19,057
Population outlook (Isle of Wight County) Hauer SSP2
- Today (2025)
- 39,005 people
- By 2030
- 40,089 · +2.8%
- By 2040
- 41,703 · +6.9%
- By 2050
- 42,745 · +9.6%
- By 2075
- 47,222 · +21.1%
- By 2100
- 47,810 · +22.6%
Race, ethnicity, and origin ACS 2023
- Neighborhood character
- Predominantly White (70%)
- Race & ethnicity
- White 70% Black 23% Two or more races 4% Hispanic / Latino 3%
- Common ancestry
- Italian 4% Slovak 3% Romanian 2%
- Foreign-born
- 3% · Canada
- Languages at home
- 97% English-only · Spanish 2%
Political lean MEDSL · Isle of Wight
- 2024 margin
- R (+19.8) · D 39.6% · R 59.4%
- 2008→2024 swing
- -6.4pp toward R · 2008: -13.4pp · 2024: -19.8pp
- All cycles
- 2024: R+19.8 2020: R+18.4 2016: R+21.0 2012: R+14.7 2008: R+13.4
Not yet ingested
- Civics
- —
Market trends
- HPI YoY
- ▼ -58.15%
- Current HPI
- 280.3343
- Rent YoY
- —
- Metro
- —
- State GDP YoY
- ▲ 2.40%
- F500 in state
- 50
Industry mix (Fortune 500 HQ in VA)
| Industry | F500 HQs | Revenue |
|---|---|---|
| Aerospace / Defense | 4 | $236B |
|
||
| Technology / Defense | 3 | $32B |
|
||
| Financial Services | 2 | $176B |
|
||
| Utilities | 2 | $27B |
|
||
| Insurance | 2 | $25B |
|
||
| Technology | 2 | $15B |
|
||
Price history
+201.4% since first listed32 events — show timeline
- 2026-06-10 Listed $379,500 REINMLS
- 2026-06-01 Listing Removed — REINMLS
- 2026-05-28 Price Changed $379,500 REINMLS
- 2026-05-13 Price Changed $380,000 REINMLS
- 2026-05-07 Listing Removed — REINMLS
- 2026-05-07 Listed $374,000 REINMLS
- 2026-04-29 Price Changed $374,000 REINMLS
- 2026-04-16 Price Changed $384,000 REINMLS
- 2026-04-01 Listed $389,000 REINMLS
- 2025-12-18 Sold (MLS) $205,100 REINMLS
- 2025-11-04 Pending — REINMLS
- 2025-10-27 Relisted — REINMLS
- 2025-10-17 Pending — REINMLS
- 2025-10-07 Listed $175,000 REINMLS
- 2025-05-02 Sold (Public Records) $226,935 Public Records
- 2025-04-22 Listing Removed — REINMLS
- 2024-10-30 Listed $253,000 REINMLS
- 2023-08-18 Pending — REINMLS
- 2023-08-18 Relisted — REINMLS
- 2023-08-18 Listing Removed — REINMLS
- 2023-08-17 Listing Removed — REINMLS
- 2023-07-06 Contingent — REINMLS
- 2023-06-12 Price Changed $175,000 REINMLS
- 2023-05-19 Price Changed $231,005 REINMLS
- 2023-05-17 Listed $192,000 REINMLS
- 2017-09-26 Sold (Public Records) $170,000 Public Records
- 2016-03-25 Sold (Public Records) $117,800 Public Records
- 2016-01-20 Pending — REINMLS
- 2016-01-19 Listing Removed — REINMLS
- 2015-10-19 Price Changed $117,000 REINMLS
- 2015-09-25 Listed $125,000 REINMLS
- 2015-05-11 Price Changed $125,900 REINMLS
Property tax history
+3.9%/yrLatest (2025): $1,862 · +5.2% YoY. Source: county tax records.
Cash-flow waterfall
monthlySold comps — $/sqft
last 12 mo · ≤1 miLoading sold comps…