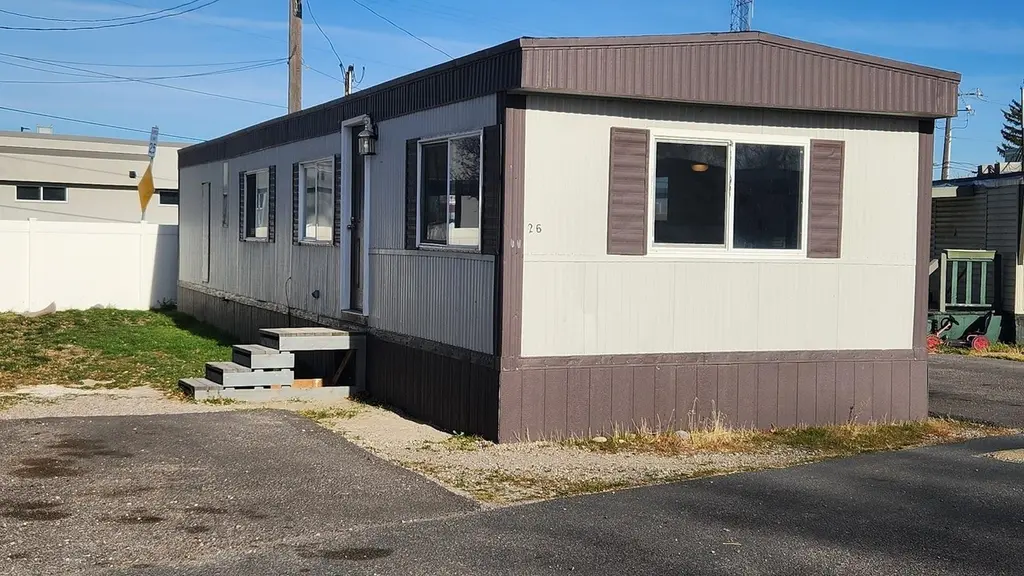
5112 Yellowstone #26 Ave · Chubbuck, ID
Flood risk 1/10 · Minimal
- FEMA flood zone
- X (unshaded)
- Chance of flooding over 30 yrs
- 0.0%
- Est. flood insurance / yr
- $473 – $860
Fire risk 2/10 · Minimal
- Est. fire insurance / yr
- $584 – $1,086
Heat risk 3/10 · Minor
- Hot days now (above 93°F)
- 7 days/yr
- Hot days in 30 yrs
- 17 days/yr
Wind risk 1/10 · Minimal
- Chance of severe wind over 30 yrs
- —
Air-quality risk 5/10 · Moderate
- Unhealthy air days now
- 6 days/yr
- Unhealthy air days in 30 yrs
- 6 days/yr
Risk factors via First Street. Map © Google.
Why this score? — see what drove the D+ grade
The composite is a weighted blend of 9 inputs, each scored 0–100. Each bar is that input's sub-score; the figure is the points it added to the 100-point composite (weight × sub-score).
- Cash flow +15.0/30.0
- ARV discount +7.5/15.0
- 1% rule +5.0/10.0
- DSCR +5.0/10.0
- Schools +4.3/10.0
- Livability +4.3/5.0
- Rent growth +3.3/5.0
- Condition / age +2.0/5.0
- Appreciation +0.0/10.0
$25,000
🖨 Deal sheet 📄 Offer letter ✓ Due diligence
Key facts
- Built 1977
- Listed 61 days
Property features AI
Finance
- Financial info: $180 annual tax
- HOA & community: Homeowners association with a $495 monthly fee
Exterior
- Parking: Asphalt parking
- Utilities: Public water; Public sewer
- Home design: Manufactured home (manufactured without land); Residential property
- Construction: Metal siding; 784 above-grade finished area
- Exterior features: Metal roof
Interior
- Kitchen: Range, Oven, Refrigerator
- Bedrooms: 2 main-level bedrooms
- Bathrooms: 1 full bathroom (main level)
- Heating & cooling: Electric forced-air heating
- Interior features: Range, Oven, Refrigerator
Neighborhood map
What this means for you Summary
Snapshot
- This is a 2-bed/1.0-bath manufactured listed at $25k. Condition is rated fair.
Deal economics
- At list price, monthly cash flow is $313 ($4k/yr) — positive.
- The deal already cash-flows at list — no discount required.
- Meets the 1% rule at list price ($1k rent vs $25k).
- Recommended offer: $24k (6.0% below list) — sets the bar for market timing.
Location & tenants
- Location reads 86/100 on livability (#4 in ID, #454 nationally) — a professional / high-income tenant draw. Strengths: commute A+, cost of living A+, housing A+; Watch: crime C-.
- Pocatello District (urban): math 45% / reading 58% proficiency, ranked #26 of 92 in ID (top 28%) — acceptable for families but not a draw, mixed tenant base, ~2y average lease.
- Zoned schools: Rulon M Ellis Elementary School (math 56% / reading 63%, grade B-, #75 of 357 statewide, top 23%, 380 students, 44% FRL); Hawthorne Middle School (math 35% / reading 54%, grade D, #52 of 109 statewide, top 51%, 674 students, 48% FRL); Highland High School (math 45% / reading 57%, grade D+, #38 of 169 statewide, top 22%, 1,589 students, 22% FRL) — zoned schools at 38% FRL track the district average.
- Market conditions: Rents rising (+3.1%/yr); 212 active listings in the ZIP; 325 units permitted in Bannock County in 2024 (6 in 5+ unit buildings).
Forward outlook
- Local home prices are declining (-3.0%/yr); year-one equity from $173 of loan paydown is wiped out by about $750 of value loss. Plan a longer hold.
- At projected returns (-3.0% appreciation + 3.1% rent growth), your $7k cash investment doubles in ~3 years — after that, you're playing with house money.
Negotiation context
- It's been on market 61 days — a 6% lower offer ($24k) is reasonable based on typical stale-listing flexibility.
- 6 sale attempts since 10y ago; this cycle's ask has dropped $5k (16%) from the opening price — seller is motivated, your offer sets the floor, not the list.
Risks & watch-outs
- Watch-outs: HOA is 40% of rent.
Questions for the listing agent
- It's been on market 61 days. Have you received any prior offers? Is the seller open to a 6% concession, seller financing, or rate buy-down credit?
- Have any recent inspections been done? Can we get a copy of the seller's disclosures and any deferred-maintenance estimates?
- Built in 1977 — when were the roof, HVAC, electrical panel, plumbing, and water heater last replaced?
- What does the HOA fee cover, when was the last increase, and are there any pending special assessments or reserve-fund shortfalls?
- Why hasn't it sold? Are there any deal-killer items the seller is aware of (foundation, flood, title, zoning, code violations)?
- Is there a deadline driving the sale (1031 exchange, divorce, estate, relocation)? That informs how much negotiation room exists.
- Schools are B-rated — typically a magnet for longer-tenancy family renters. What's the average tenant stay here, and is there a school-zone premium baked into asking?
- The area grade is low — what's the realistic commute time and amenity access for the typical tenant pool here? Any planned neighborhood developments (good or bad) we should know about?
- What's the average days-on-market for RENTAL listings here right now (not sales)? A rising rental-DOM trend means longer vacancies and softer asking-rent achievability than the comps imply.
- What's the recent tenant-quality profile in this submarket — average credit score on applications, eviction rate, late-payment / NSF rate, and stable-employment percentage? A property-management company in the area should have these aggregated.
- How much new for-sale + rental construction is in the pipeline within 1–3 miles? Heavy new supply typically softens prices + rents 12–24 months out; constrained supply supports both.
Investment metrics
- 1% rule
- 4.96% ✓
- Cap rate
- 21.30%
- Cash-on-cash
- 53.61%
- DSCR
- 3.39
- GRM
- 1.7
CMA / ARV
No comps found within radius.
Projected returns pro-forma
-3.0% appreciation · 3.14% rent growth · sell at horizon
- IRR
- 52.6%
- Equity multiple
- 3.34×
- Total profit
- $16,366
- Equity at exit
- $3,728
- IRR
- 58.2%
- Equity multiple
- 6.99×
- Total profit
- $41,932
- Equity at exit
- $2,162
Cash invested: $7,000 (down + closing). Projections, not guarantees.
Landlord ↔ Tenant lean methodology
- Overall (STATE)
- 91 Strongly Landlord-Friendly
- State Idaho
- 91 Strongly Landlord-Friendly · R+18
- County
- — inherits STATE
- City
- — inherits STATE
ZIP-level market 83202
- Rents YoY
- 3.1%
- Active inventory
- 212
- Price-to-rent
- 1.7×
Monthly cashflow live
- Estimated rent
- $1,241 medium interval (Pro) →
- Mortgage (P&I)
- −$131
- Tax est. 1.5%
- −$31 /mo · $375/yr
- Insurance
- −$10
- HOA
- −$495
- Vacancy / Maint / Mgmt
- −$261
- Net cashflow
- $313
Break-even live
UW: 25.0% down · 7.5% · 30yr · 1.5% tax · 5.0% vac · 8.0% maint · 8.0% mgmt
Financing live
Cash to close
- Down payment
- $6,250
- Closing costs
- $750
- Reserves months
- —
- Total cash needed
- —
Loan-product check · same deal, 3 products live
Conventional
25% down · 7.5% · 30yr
- Down + closing
- —
- Monthly P&I
- —
- Monthly cashflow
- —
- DSCR
- —
- Eligible?
- —
Personal DTI + credit; lowest rate.
DSCR
20% down · 8.5% · 30yr
- Down + closing
- —
- Monthly P&I
- —
- Monthly cashflow
- —
- DSCR
- —
- Eligible?
- —
No personal income docs; deal must DSCR.
Hard money
10% down · 12.0% · 12mo
- Down + closing
- —
- Monthly P&I
- —
- Monthly cashflow
- —
- DSCR
- —
- Eligible?
- —
Short-term bridge; refi at stabilization.
HOA detail
- Monthly dues
- $495 · $5,940/yr
Listing history 13 events
-
2026-06-02pricestatus $25,000 Pending 61 DOM
-
2026-06-01days on market $29,900 Active 61 DOM
-
2026-05-31days on market $29,900 Active 60 DOM
-
2026-05-30days on market $29,900 Active 59 DOM
-
2026-04-01$29,900 Active
-
2026-02-24price $39,000
-
2025-12-01$42,000 Active
-
2023-04-17soldstatus Closed
-
2023-04-04status Pending
-
2023-03-24$48,000 Active
-
2016-10-28$11,000
-
2016-10-28$11,000
-
2016-10-28$11,000
ⓘ Source: listings_history table (triggers on properties + properties_extension) + one-shot
backfill from property_details.listing_events for pre-trigger history.
Climate risk First Street
- Flood 1/10 Low FEMA zone X (unshaded) · 0% chance over 30 yrs
- Wildfire 2/10 Low
- Heat 3/10 Moderate 7 d/yr ≥93°F today · 17 d/yr by 30 yrs out
- Wind 1/10 Low
- Air quality 5/10 Major 6 unhealthy d/yr today · 6 by 30 yrs out
Nearby sold comps map
Loading sold comps map…
Walkable amenities ~0.75 mi
Loading nearby amenities…
Taxation est. · year 1
- Rental income
- $14,894
- − Mortgage interest
- −$1,400
- − Property taxes
- −$375
- − Insurance
- −$125
- − Repairs & maintenance
- −$1,192
- − Management
- −$1,192
- − HOA
- −$5,940
- − Depreciation
- −$727
- Taxable income
- $3,943
- Est. tax owed @ 24.0%
- −$946
- After-tax cash flow
- $2,807/yr
For passive investors: Depreciation is non-cash, so a rental often shows a tax loss while cash-flowing — sheltering income. Rental losses are passive: they offset passive income freely, and up to $25,000/yr can offset ordinary (W-2) income if you actively participate and your MAGI is under $100k (phasing out to $0 by $150k); unused losses carry forward. On sale, claimed depreciation is recaptured at up to 25%, and gains may owe capital-gains tax (a 1031 exchange can defer both). Figures are a year-1 estimate at your 24.0% rate — not tax advice; consult a CPA.
Condition & rehab AI · 1 photo
A mobile home with fair condition, requiring minor repairs and maintenance to improve its curb appeal and value.
Repairs flagged
- Minor Painting — Slight discoloration on exterior
- Minor Landscaping — Overgrown grass
Value-add opportunities
- Both Painting exterior — Enhances curb appeal and value
- Both Landscaping — Improves curb appeal and enhances property value
Renovation cost estimate screening
| Repair item | Severity | Est. cost |
|---|---|---|
| Painting · Slight discoloration on exterior | Minor | $500–3,000 |
| Landscaping · Overgrown grass | Minor | $500–3,000 |
| Total estimated repair cost · 2 items | $1,000–6,000 |
Value-add ROI direction
- Both Painting exterior — Enhances curb appeal and value ↑
- Both Landscaping — Improves curb appeal and enhances property value ↑
ⓘ Cost ranges are severity-bucket heuristics (US national rule-of-thumb). Get contractor quotes + a written scope before underwriting a rehab budget.
Schools (NCES district)
- District
- Pocatello District
- NCES district ID
- 1602640
- Math proficiency
- 45% ▼ -6.00%
- Reading proficiency
- 58% ▼ -1.00%
- Median HH income
- $44,478
- Composite
- 43.46/100
- National rank
- #3003
- State rank
- #26 of 92 in ID
Livability — Chubbuck
- Score
- 86/100
- State rank
- #4
- US rank
- #454
Category grades
Schools grade is shown separately in the Schools card above.
Census & demographics
- Census place
- Chubbuck, ID
- County
- Bannock County · 82,995 people
- City population
- 24,513
- Metro
- Pocatello, ID
- Population (ZIP)
- 24,513
- Household income
- $70,423
- Rent vs Own
- Severe rent burden
- 510.0
Population outlook (Bannock County) Hauer SSP2
- Today (2025)
- 86,173 people
- By 2030
- 86,575 · +0.5%
- By 2040
- 86,235 · +0.1%
- By 2050
- 86,090 · -0.1%
- By 2075
- 85,032 · -1.3%
- By 2100
- 85,103 · -1.2%
Race, ethnicity, and origin ACS 2023
- Neighborhood character
- Predominantly White (72%)
- Race & ethnicity
- White 72% Hispanic / Latino 13% Native American 9% Two or more races 6%
- Hispanic origin (detail)
- Mexican 12%
- Common ancestry
- Portuguese 3% Slovak 3% Italian 2%
- Foreign-born
- 2% · Canada
- Languages at home
- 92% English-only · Spanish 6%
Political lean MEDSL · Bannock
- 2024 margin
- Strong R (+25.1) · D 35.8% · R 60.9% · Other 3.3%
- 2008→2024 swing
- -12.1pp toward R · 2008: -13.0pp · 2024: -25.1pp
- All cycles
- 2024: R+25.1 2020: R+21.9 2016: R+20.5 2012: R+22.1 2008: R+13.0
Not yet ingested
- Civics
- —
Market trends
- HPI YoY
- ▼ -140.31%
- Current HPI
- 229.4622
- Rent YoY
- ▲ 3.14%
- Metro
- Pocatello, ID
- State GDP YoY
- ▲ 4.51%
- F500 in state
- 6
Industry mix (Fortune 500 HQ in ID)
| Industry | F500 HQs | Revenue |
|---|---|---|
| Retail | 1 | $79B |
|
||
| Technology | 1 | $25B |
|
||
| Food / Agriculture | 1 | $6B |
|
||
Price history
+171.8% since first listed9 events — show timeline
- 2026-04-01 Listed $29,900 PCTMLS
- 2026-02-24 Price Changed $39,000 PCTMLS
- 2025-12-01 Listed $42,000 PCTMLS
- 2023-04-17 Sold (MLS) — PCTMLS
- 2023-04-04 Pending — PCTMLS
- 2023-03-24 Listed $48,000 PCTMLS
- 2016-10-28 Listed $11,000 PCTMLS
- 2016-10-28 Listed $11,000 PCTMLS
- 2016-10-28 Listed $11,000 PCTMLS
Cash-flow waterfall
monthlySold comps — $/sqft
last 12 mo · ≤1 miLoading sold comps…