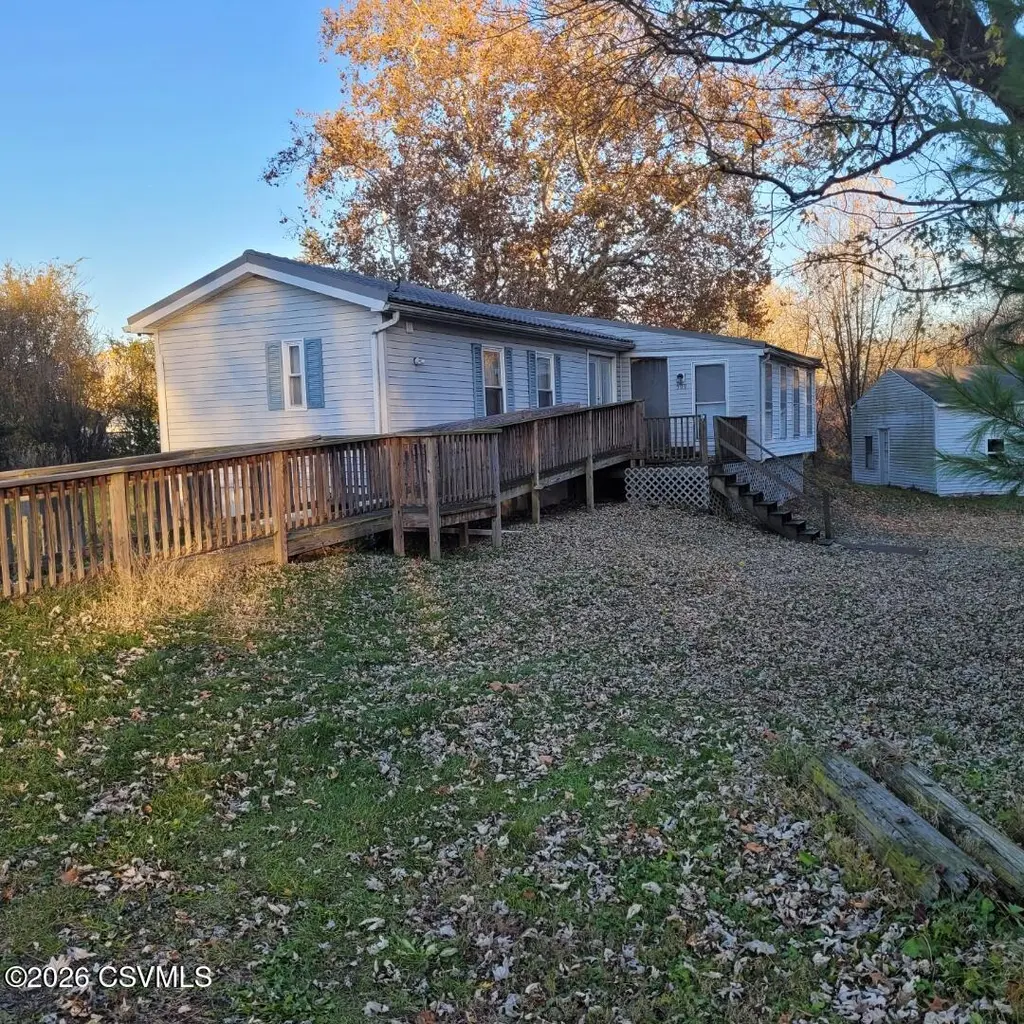
509 Mary St · Mifflinville, PA
Flood risk 8/10 · Major
- FEMA flood zone
- X (unshaded)
- Chance of flooding over 30 yrs
- 0.99%
- Est. flood insurance / yr
- $473 – $860
Fire risk 1/10 · Minimal
- Est. fire insurance / yr
- $511 – $949
Heat risk 4/10 · Minor
- Hot days now (above 98°F)
- 7 days/yr
- Hot days in 30 yrs
- 16 days/yr
Wind risk 3/10 · Minor
- Chance of severe wind over 30 yrs
- 4.0%
Air-quality risk 2/10 · Minimal
- Unhealthy air days now
- 1 days/yr
- Unhealthy air days in 30 yrs
- 1 days/yr
Risk factors via First Street. Map © Google.
Why this score? — see what drove the B+ grade
The composite is a weighted blend of 9 inputs, each scored 0–100. Each bar is that input's sub-score; the figure is the points it added to the 100-point composite (weight × sub-score).
- Cash flow +30.0/30.0
- DSCR +10.0/10.0
- 1% rule +8.6/10.0
- ARV discount +7.5/15.0
- Appreciation +6.6/10.0
- Schools +5.6/10.0
- Livability +3.5/5.0
- Rent growth +2.5/5.0
- Condition / age +1.0/5.0
$129,000
🖨 Deal sheet 📄 Offer letter ✓ Due diligence
Listing remarks
Stop paying lot rent and enjoy the freedom of making this your own! This two bedroom 14'x66' mobile home has 2 additions. It needs your sweat equity to bring it back to its full potential. There are two decks, a 2-car detached garage and a 0.88 acre parcel of land. All in Central School District.
Key facts
- Two decks
- 0.88 acre parcel
- Two additions
Tags
Property features AI
Finance
- Financial info: Annual tax information available
Exterior
- Parking: Attached garage with 2 spaces
- Utilities: Public water; Public sewer
- Home design: Mobile home (residential property)
- Construction: Vinyl siding; Wood siding; No foundation info provided
- Exterior features: Metal roof; Lot of about 0.88 acres; Residential zoning
Interior
- Bathrooms: 1 full bathroom; 1 three-quarter bathroom
- Interior features: 7 total rooms; No basement
Neighborhood map
What this means for you Summary
Snapshot
- This is a 2-bed/2.0-bath manufactured listed at $129k. Condition is rated poor.
Deal economics
- At list price, monthly cash flow is $440 ($5k/yr) — positive.
- The deal already cash-flows at list — no discount required.
- Meets the 1% rule at list price ($2k rent vs $129k).
- Recommended offer: $127k (1.5% below list) — sets the bar for market timing.
Location & tenants
- Location reads 70/100 on livability (#769 in PA) — a middle-class / working-renter tenant base. Strengths: cost of living A+, housing A+, health & safety A+; Watch: employment C-, schools F, amenities F.
- Central Columbia SD (suburban): math 58% / reading 73% proficiency, ranked #51 of 539 in PA (top 10%) — acceptable for families but not a draw, mixed tenant base, ~2y average lease.
- Market conditions: 69 active listings in the ZIP; 82 units permitted in Columbia County in 2024 (0 in 5+ unit buildings).
Forward outlook
- In year one you build about $5k of equity ($892 loan paydown + $4k appreciation (3.2% local appreciation)).
- Columbia County population projected at -12% by 2050 — secular population decline; favor cash flow + early exit over multi-decade hold.
- At projected returns (3.2% appreciation + 3.0% rent growth), your $36k cash investment doubles in ~4 years — after that, you're playing with house money.
- By year 7, paydown + projected appreciation supports a ~$32k cash-out refi (75% LTV) — recoverable capital for the next deal without selling this one.
Negotiation context
- It's been on market 30 days — a 2% lower offer ($127k) is reasonable based on typical stale-listing flexibility.
Risks & watch-outs
- Watch-outs: flood insurance adds $56/mo.
- Climate carrying-cost: severe flood risk — expect insurance premiums to compound above CPI over the hold.
Questions for the listing agent
- Have any recent inspections been done? Can we get a copy of the seller's disclosures and any deferred-maintenance estimates?
- What's the actual annual flood-insurance premium (NFIP or private), and is the property in a SFHA with mandatory coverage?
- Is there a deadline driving the sale (1031 exchange, divorce, estate, relocation)? That informs how much negotiation room exists.
- Schools are F-rated, which usually means shorter tenancies and higher turnover. Who's the typical renter profile here, and what's been the actual vacancy rate?
- What's the average days-on-market for RENTAL listings here right now (not sales)? A rising rental-DOM trend means longer vacancies and softer asking-rent achievability than the comps imply.
- What's the recent tenant-quality profile in this submarket — average credit score on applications, eviction rate, late-payment / NSF rate, and stable-employment percentage? A property-management company in the area should have these aggregated.
- How much new for-sale + rental construction is in the pipeline within 1–3 miles? Heavy new supply typically softens prices + rents 12–24 months out; constrained supply supports both.
Investment metrics
- 1% rule
- 1.36% ✓
- Cap rate
- 10.90%
- Cash-on-cash
- 16.45%
- DSCR
- 1.73
- GRM
- 6.1
CMA / ARV
No comps found within radius.
Projected returns pro-forma
3.2% appreciation · 3.0% rent growth · sell at horizon
- IRR
- 21.7%
- Equity multiple
- 2.24×
- Total profit
- $44,955
- Equity at exit
- $59,445
- IRR
- 22.6%
- Equity multiple
- 4.30×
- Total profit
- $119,232
- Equity at exit
- $92,749
Cash invested: $36,120 (down + closing). Projections, not guarantees.
Landlord ↔ Tenant lean methodology
- Overall (STATE)
- 62 Landlord-Friendly
- State Pennsylvania
- 62 Landlord-Friendly · EVEN
- County
- — inherits STATE
- City
- — inherits STATE
ZIP-level market 18635
- Home prices YoY
- 1.3%
- Active inventory
- 69
- Price-to-rent
- 6.1×
Monthly cashflow live
- Estimated rent
- $1,755 medium interval (Pro) →
- Mortgage (P&I)
- −$676
- Tax est. 1.5%
- −$161 /mo · $1,935/yr
- Insurance
- −$54
- Flood insurance flood zone
- −$56 /mo · $666/yr
- HOA
- −$0
- Vacancy / Maint / Mgmt
- −$369
- Net cashflow
- $440
Break-even live
UW: 25.0% down · 7.5% · 30yr · 1.5% tax · 5.0% vac · 8.0% maint · 8.0% mgmt
Financing live
Cash to close
- Down payment
- $32,250
- Closing costs
- $3,870
- Reserves months
- —
- Total cash needed
- —
Loan-product check · same deal, 3 products live
Conventional
25% down · 7.5% · 30yr
- Down + closing
- —
- Monthly P&I
- —
- Monthly cashflow
- —
- DSCR
- —
- Eligible?
- —
Personal DTI + credit; lowest rate.
DSCR
20% down · 8.5% · 30yr
- Down + closing
- —
- Monthly P&I
- —
- Monthly cashflow
- —
- DSCR
- —
- Eligible?
- —
No personal income docs; deal must DSCR.
Hard money
10% down · 12.0% · 12mo
- Down + closing
- —
- Monthly P&I
- —
- Monthly cashflow
- —
- DSCR
- —
- Eligible?
- —
Short-term bridge; refi at stabilization.
Listing history 17 events
-
2026-06-19days on market $129,000 Active 30 DOM
-
2026-06-18days on market $129,000 Active 29 DOM
-
2026-06-17days on market $129,000 Active 28 DOM
-
2026-06-16days on market $129,000 Active 27 DOM
-
2026-06-15days on market $129,000 Active 26 DOM
-
2026-06-14days on market $129,000 Active 24 DOM
-
2026-06-12days on market $129,000 Active 23 DOM
-
2026-06-09days on market $129,000 Active 20 DOM
-
2026-06-08days on market $129,000 Active 19 DOM
-
2026-06-07days on market $129,000 Active 18 DOM
-
2026-06-03days on market $129,000 Active 14 DOM
-
2026-06-02days on market $129,000 Active 13 DOM
-
2026-06-01days on market $129,000 Active 12 DOM
-
2026-05-31days on market $129,000 Active 11 DOM
-
2026-05-30days on market $129,000 Active 10 DOM
-
2026-05-20price $129,000
-
2026-05-20$120,000 Active
ⓘ Source: listings_history table (triggers on properties + properties_extension) + one-shot
backfill from property_details.listing_events for pre-trigger history.
Climate risk First Street
- Flood 8/10 Severe FEMA zone X (unshaded) · 99% chance over 30 yrs
- Wildfire 1/10 Low
- Heat 4/10 Moderate 7 d/yr ≥98°F today · 16 d/yr by 30 yrs out
- Wind 3/10 Moderate 4% chance of damaging wind over 30 yrs
- Air quality 2/10 Low 1 unhealthy d/yr today · 1 by 30 yrs out
Nearby sold comps map
Loading sold comps map…
Walkable amenities ~0.75 mi
Loading nearby amenities…
Taxation est. · year 1
- Rental income
- $21,063
- − Mortgage interest
- −$7,226
- − Property taxes
- −$1,935
- − Insurance
- −$1,312
- − Repairs & maintenance
- −$1,685
- − Management
- −$1,685
- − Depreciation
- −$3,753
- Taxable income
- $3,468
- Est. tax owed @ 24.0%
- −$832
- After-tax cash flow
- $4,443/yr
For passive investors: Depreciation is non-cash, so a rental often shows a tax loss while cash-flowing — sheltering income. Rental losses are passive: they offset passive income freely, and up to $25,000/yr can offset ordinary (W-2) income if you actively participate and your MAGI is under $100k (phasing out to $0 by $150k); unused losses carry forward. On sale, claimed depreciation is recaptured at up to 25%, and gains may owe capital-gains tax (a 1031 exchange can defer both). Figures are a year-1 estimate at your 24.0% rate — not tax advice; consult a CPA.
Condition & rehab AI · 9 photos
This mobile home requires extensive repairs and updates to bring it up to a livable condition. Significant work is needed on the roof, siding, flooring, interior walls, landscaping, HVAC, foundation, and windows.
Repairs flagged
- Major roof — Significant damage and potential leaks.
- Major siding — Peeling and chipping paint.
- Major flooring — Worn and damaged carpet.
- Major interior walls/paint — Damaged and discolored walls.
- Major landscaping — Overgrown and unkempt.
- Major HVAC — Old and in need of maintenance or replacement.
- Major foundation — Cracks and settling.
- Major windows — Old and in need of replacement or repair.
Value-add opportunities
- Both New roof — A new roof would significantly improve the home's appearance and functionality.
- Both New siding — New siding would improve the home's appearance and increase its value.
- Both New flooring — New flooring would improve the home's appearance and increase its value.
- Both Painting — Painting would improve the home's appearance and increase its value.
- Both Landscaping — Landscaping would improve the home's curb appeal and increase its value.
- Both HVAC replacement — A new HVAC system would improve the home's comfort and increase its value.
- Both Foundation repair — Repairing the foundation would improve the home's structural integrity and increase its value.
- Both Window replacement — New windows would improve the home's energy efficiency and increase its value.
Renovation cost estimate screening
| Repair item | Severity | Est. cost |
|---|---|---|
| roof · Significant damage and potential leaks. | Major | $15,000–50,000 |
| siding · Peeling and chipping paint. | Major | $15,000–50,000 |
| flooring · Worn and damaged carpet. | Major | $15,000–50,000 |
| interior walls/paint · Damaged and discolored walls. | Major | $15,000–50,000 |
| landscaping · Overgrown and unkempt. | Major | $15,000–50,000 |
| HVAC · Old and in need of maintenance or replacement. | Major | $15,000–50,000 |
| foundation · Cracks and settling. | Major | $15,000–50,000 |
| windows · Old and in need of replacement or repair. | Major | $15,000–50,000 |
| Total estimated repair cost · 8 items | $120,000–400,000 |
Value-add ROI direction
- Both New roof — A new roof would significantly improve the home's appearance and functionality. ↑
- Both New siding — New siding would improve the home's appearance and increase its value. ↑
- Both New flooring — New flooring would improve the home's appearance and increase its value. ↑
- Both Painting — Painting would improve the home's appearance and increase its value. ↑
- Both Landscaping — Landscaping would improve the home's curb appeal and increase its value. ↑
- Both HVAC replacement — A new HVAC system would improve the home's comfort and increase its value. ↑
- Both Foundation repair — Repairing the foundation would improve the home's structural integrity and increase its value. ↑
- Both Window replacement — New windows would improve the home's energy efficiency and increase its value. ↑
ⓘ Cost ranges are severity-bucket heuristics (US national rule-of-thumb). Get contractor quotes + a written scope before underwriting a rehab budget.
Schools (NCES district)
- District
- Central Columbia SD
- NCES district ID
- 4205370
- Math proficiency
- 58% ▼ -7.00%
- Reading proficiency
- 73% ▼ -4.00%
- Median HH income
- $54,278
- Composite
- 55.99/100
- National rank
- #1195
- State rank
- #51 of 539 in PA
Livability — Mifflinville
- Score
- 70/100
- State rank
- #769
- US rank
- #7709
Category grades
Schools grade is shown separately in the Schools card above.
Census & demographics
- Census place
- Mifflinville, PA
- City population
- 1,109
- Population (ZIP)
- 3,640
Population outlook (Columbia County) Hauer SSP2
- Today (2025)
- 65,170 people
- By 2030
- 64,054 · -1.7%
- By 2040
- 61,131 · -6.2%
- By 2050
- 57,526 · -11.7%
- By 2075
- 50,259 · -22.9%
- By 2100
- 44,756 · -31.3%
Race, ethnicity, and origin ACS 2023
- Neighborhood character
- Predominantly White (96%)
- Race & ethnicity
- White 96% Two or more races 2% Hispanic / Latino 1%
- Common ancestry
- Romanian 8% Lithuanian 4% Iranian 3%
- Foreign-born
- 0%
- Languages at home
- 96% English-only · Spanish 3% Russian/Polish/Slavic 1%
Political lean MEDSL · Columbia
- 2024 margin
- Solid R (+31.0) · D 34.0% · R 65.0%
- 2008→2024 swing
- -26.6pp toward R · 2008: -4.5pp · 2024: -31.0pp
- All cycles
- 2024: R+31.0 2020: R+30.7 2016: R+32.8 2012: R+12.4 2008: R+4.5
Not yet ingested
- Civics
- —
Market trends
- HPI YoY
- ▲ 3.20%
- Current HPI
- 245.2539
- Rent YoY
- —
- Metro
- —
- State GDP YoY
- ▲ 1.68%
- F500 in state
- 34
Industry mix (Fortune 500 HQ in PA)
| Industry | F500 HQs | Revenue |
|---|---|---|
| Healthcare | 2 | $309B |
|
||
| Insurance | 2 | $27B |
|
||
| Telecommunications / Media | 1 | $124B |
|
||
| Industrial Distribution | 1 | $22B |
|
||
| Financial Services | 1 | $20B |
|
||
| Chemicals / Materials | 1 | $18B |
|
||
Price history
+7.5% since first listed2 events — show timeline
- 2026-05-20 Price Changed $129,000 CSVBR
- 2026-05-20 Listed $120,000 CSVBR
Cash-flow waterfall
monthlySold comps — $/sqft
last 12 mo · ≤1 miLoading sold comps…