 10-Plex
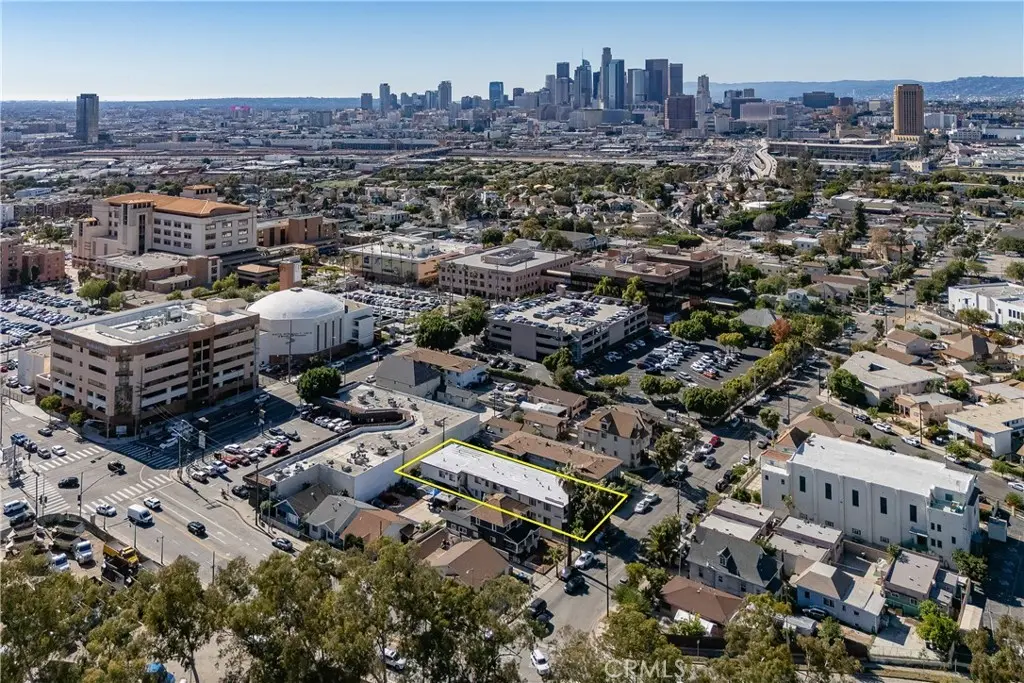
1822 Bridge · Los Angeles, CA
Flood risk 1/10 · Minimal
- FEMA flood zone
- X (unshaded)
- Chance of flooding over 30 yrs
- 0.0%
- Est. flood insurance / yr
- $507 – $1,088
Fire risk 1/10 · Minimal
- Est. fire insurance / yr
- $659 – $1,223
Heat risk 6/10 · Moderate
- Hot days now (above 94°F)
- 7 days/yr
- Hot days in 30 yrs
- 21 days/yr
Wind risk 1/10 · Minimal
- Chance of severe wind over 30 yrs
- —
Air-quality risk 6/10 · Moderate
- Unhealthy air days now
- 11 days/yr
- Unhealthy air days in 30 yrs
- 12 days/yr
Risk factors via First Street. Map © Google.
Why this score? — see what drove the B- grade
The composite is a weighted blend of 9 inputs, each scored 0–100. Each bar is that input's sub-score; the figure is the points it added to the 100-point composite (weight × sub-score).
- Cash flow +30.0/30.0
- DSCR +10.0/10.0
- 1% rule +8.2/10.0
- ARV discount +7.5/15.0
- Schools +3.6/10.0
- Livability +3.4/5.0
- Condition / age +2.5/5.0
- Rent growth +1.9/5.0
- Appreciation +0.0/10.0
$2,230,000
🖨 Deal sheet (PDF) 📄 Offer letter ✓ Due diligence
Multi-family units
County records classify this as Multi-Family (5+ Unit). Listing-text estimate: 10 units. confirmed
5+ unit building — per-unit beds/baths from public records are typically unavailable; the breakdown below (if shown) is an estimate from the listing text.
Listing remarks MLS
Discover a rare value-add opportunity in the heart of Los Angeles at 1822 Bridge Street, a well-located 10-unit multifamily asset offering immediate upside and long-term potential. Built in 1965, this 6,863 SF building sits on a 7,566 SF LARD1.5-zoned lot, giving buyers room to explore ADU expansion or future redevelopment (buyer to verify). Priced at just $2,230,000, the property pencils with a compelling 7.00% cap rate and 9.75x GRM, making it an attractive option for both seasoned operators and new investors looking for cash flow and growth. Major capital improvements have already been made such as new roof, new copper plumbing lines, new retrofit for tuck-under parking, as well as two(2) of the three vacant units having already been completely renovated. The unit mix delivers strong fundamentals: 5 two-bedroom units, 4 one-bedroom units, and 1 studio, with several units to be delivered vacant at close of escrow. This setup is ideal for repositioning, renovation, or capturing market rents right away. Utilities are separately metered for gas and electricity, helping streamline expenses. At $223,000 per unit and $325 per square foot, this property stands out as one of the more efficient multifamily plays in the area.
Key facts
- Well located
- New roof
- 7,554 sq ft lot
Tags
Neighborhood map
What this means for you Summary
Snapshot
- This is a 10 × 15-bed/10.0-bath units multifamily listed at $2.23M.
Deal economics
- At list price, monthly cash flow is $10k ($118k/yr) — positive. Per door: $985/mo.
- The deal already cash-flows at list — no discount required.
- Meets the 1% rule at list price ($29k rent vs $2.23M).
- Recommended offer: $1.96M (12.0% below list) — sets the bar for market timing.
- Cap rate 11.6% vs local median 2.1% in Los Angeles — top-decile yield for the area; either an underpriced asset or a hidden risk that comps aren't pricing in. Stress-test before assuming the spread holds.
Location & tenants
- Location reads 68/100 on livability (#273 in CA) — a middle-class / working-renter tenant base. Strengths: amenities A+, commute A+, employment B; Watch: health & safety C-, crime F, cost of living F.
- Los Angeles Unified (urban): math 29% / reading 54% proficiency, ranked #223 of 517 in CA (top 43%) — families likely to look elsewhere, expect single-tenant / working-renter base with shorter leases; 67% free/reduced lunch — lower-income household profile, screen leases tightly.
- Zoned schools: Bridge Street Elementary (188 students, 97% FRL); Hollenbeck Middle (1,007 students, 95% FRL); Theodore Roosevelt Senior High (math 17% / reading 37%, grade F, #788 of 1,170 statewide, top 69%, 1,528 students, 97% FRL) — zoned schools average 96% FRL vs 67% district-wide (29 pts higher); higher-poverty schools than district average — tighter screening recommended.
- Zoned-school proficiency averages 27% at this address vs 42% district-wide (-14 pts) — the specific schools serving this property underperform the Los Angeles Unified average; the district grade overstates school quality for this exact location.
- Market conditions: Rents soft (-2.3%/yr); 108 active listings in the ZIP; 19,697 units permitted in Los Angeles County in 2024 (9,426 in 5+ unit buildings).
Forward outlook
- Local home prices are declining (-3.0%/yr); year-one equity from $15k of loan paydown is wiped out by about $67k of value loss. Plan a longer hold.
- Los Angeles County population projected at +9% by 2050 — modest demand growth; plan on rents tracking national, not racing it.
- At projected returns (-3.0% appreciation + 0.0% rent growth), your $624k cash investment doubles in ~9 years — after that, you're playing with house money.
Negotiation context
- It's been on market 146 days — a 12% lower offer ($1.96M) is reasonable based on typical stale-listing flexibility.
- 9 sale attempts since 24y ago with the ask held roughly flat each time — persistent listings suggest the price (not the market) is what's stuck; bring a comps-based counter.
- Current owner paid $423k; list at $2.23M implies a 427% gain — meaningful room to come down on a strong offer.
Risks & watch-outs
- Climate carrying-cost: extreme-heat days projected 7→21/yr by 2055 (HVAC capex compounding) — expect insurance premiums to compound above CPI over the hold.
Questions for the listing agent
- It's been on market 146 days. Have you received any prior offers? Is the seller open to a 12% concession, seller financing, or rate buy-down credit?
- Can we see the unit-by-unit rent roll, current vacancy, and any below-market leases? What's the average tenancy length?
- What capital expenditures (roof, boiler, parking lot, exteriors) have been made in the last 5 years, and what's planned in the next 2?
- Built in 1965 — when were the roof, HVAC, electrical panel, plumbing, and water heater last replaced?
- Why hasn't it sold? Are there any deal-killer items the seller is aware of (foundation, flood, title, zoning, code violations)?
- Is there a deadline driving the sale (1031 exchange, divorce, estate, relocation)? That informs how much negotiation room exists.
- Schools are D-rated, which usually means shorter tenancies and higher turnover. Who's the typical renter profile here, and what's been the actual vacancy rate?
- Crime grade is F in this area — have there been break-ins, vandalism, or insurance claims at this property in the last 3 years? What carrier currently insures it and at what premium?
- What's the average days-on-market for RENTAL listings here right now (not sales)? A rising rental-DOM trend means longer vacancies and softer asking-rent achievability than the comps imply.
- What's the recent tenant-quality profile in this submarket — average credit score on applications, eviction rate, late-payment / NSF rate, and stable-employment percentage? A property-management company in the area should have these aggregated.
- How much new apartment / multifamily construction is in the pipeline within 1–3 miles? Heavy new supply (>2% of stock underway) typically softens rents 12–24 months out; light construction supports rent growth.
Investment metrics
- 1% rule
- 1.32% ✓
- Cap rate
- 11.59%
- Cash-on-cash
- 18.93%
- DSCR
- 1.84
- GRM
- 6.3
CMA / ARV
- ARV (median comp)
- $1,273,301
- List price
- $2,230,000
- Delta
- 75.14%
- Verdict
- OVERPRICED
- Comps
- 20 within 1.0 mi
Projected returns pro-forma
-3.0% appreciation · 0.0% rent growth · sell at horizon
- IRR
- 7.6%
- Equity multiple
- 1.29×
- Total profit
- $179,002
- Equity at exit
- $332,500
- IRR
- 14.3%
- Equity multiple
- 2.01×
- Total profit
- $627,663
- Equity at exit
- $192,810
Cash invested: $624,400 (down + closing). Projections, not guarantees.
Landlord ↔ Tenant lean methodology
- Overall (CITY)
- 0 Strongly Tenant-Friendly
- State California
- 18 Strongly Tenant-Friendly · D+13
- County
- — inherits STATE
- City Los Angeles
- 0 Strongly Tenant-Friendly · D+22
ZIP-level market 90033
- Home prices YoY
- -29.9%
- Rents YoY
- -2.3%
- Active inventory
- 108
- Price-to-rent
- 63.3×
Monthly cashflow live
- Estimated rent
- $29,358 medium interval (Pro) →
- Mortgage (P&I)
- −$11,694
- Tax from tax record
- −$721 /mo · $8,656/yr
- Insurance
- −$929
- HOA
- −$0
- Vacancy / Maint / Mgmt
- −$6,165
- Net cashflow
- $9,848
Break-even live
Sensitivity live
| Price | -10% $11,110 | -5% $10,479 | +0% $9,848 | +5% $9,217 | +10% $8,586 |
|---|---|---|---|---|---|
| Rent | -10% $7,529 | -5% $8,688 | +0% $9,848 | +5% $11,008 | +10% $12,167 |
| Rate | -1.0pp $10,971 | -0.5pp $10,415 | base $9,848 | +0.5pp $9,270 | +1.0pp $8,682 |
10-unit breakdown (identical units grouped — click to expand)
| Units | Beds | Baths | Est. rent |
|---|---|---|---|
| 10× units | 15 | 10 | $29,360 |
| #1 | 15 | 10 | $2,936 |
| #2 | 15 | 10 | $2,936 |
| #3 | 15 | 10 | $2,936 |
| #4 | 15 | 10 | $2,936 |
| #5 | 15 | 10 | $2,936 |
| #6 | 15 | 10 | $2,936 |
| #7 | 15 | 10 | $2,936 |
| #8 | 15 | 10 | $2,936 |
| #9 | 15 | 10 | $2,936 |
| #10 | 15 | 10 | $2,936 |
| Total (10 units) | $29,358 | ||
UW: 25.0% down · 7.5% · 30yr · 1.5% tax · 5.0% vac · 8.0% maint · 8.0% mgmt
Financing live
Cash to close
- Down payment
- $557,500
- Closing costs
- $66,900
- Reserves months
- —
- Total cash needed
- —
Loan-product check · same deal, 3 products live
Conventional
25% down · 7.5% · 30yr
- Down + closing
- —
- Monthly P&I
- —
- Monthly cashflow
- —
- DSCR
- —
- Eligible?
- —
Personal DTI + credit; lowest rate.
DSCR
20% down · 8.5% · 30yr
- Down + closing
- —
- Monthly P&I
- —
- Monthly cashflow
- —
- DSCR
- —
- Eligible?
- —
No personal income docs; deal must DSCR.
Hard money
10% down · 12.0% · 12mo
- Down + closing
- —
- Monthly P&I
- —
- Monthly cashflow
- —
- DSCR
- —
- Eligible?
- —
Short-term bridge; refi at stabilization.
Listing history 24 events
-
2026-05-31days on market $2,230,000 Active 146 DOM
-
2026-01-05$2,230,000 Active 1237-char remark
Show marketing remark (1237 chars)
Discover a rare value-add opportunity in the heart of Los Angeles at 1822 Bridge Street, a well-located 10-unit multifamily asset offering immediate upside and long-term potential. Built in 1965, this 6,863 SF building sits on a 7,566 SF LARD1.5-zoned lot, giving buyers room to explore ADU expansion or future redevelopment (buyer to verify). Priced at just $2,230,000, the property pencils with a compelling 7.00% cap rate and 9.75x GRM, making it an attractive option for both seasoned operators and new investors looking for cash flow and growth. Major capital improvements have already been made such as new roof, new copper plumbing lines, new retrofit for tuck-under parking, as well as two(2) of the three vacant units having already been completely renovated. The unit mix delivers strong fundamentals: 5 two-bedroom units, 4 one-bedroom units, and 1 studio, with several units to be delivered vacant at close of escrow. This setup is ideal for repositioning, renovation, or capturing market rents right away. Utilities are separately metered for gas and electricity, helping streamline expenses. At $223,000 per unit and $325 per square foot, this property stands out as one of the more efficient multifamily plays in the area.
-
2024-09-12historical $1,800
-
2024-09-11$1,800
-
2024-06-22historical $1,800
-
2024-06-12$1,800
-
2024-05-30historical $1,800
-
2024-05-23price $1,800
-
2024-05-08$1,850
-
2024-04-10historical $1,850
-
2024-04-02$1,850
-
2024-03-07historical $1,550
-
2024-03-06$1,600
-
2023-09-21historical $1,900
-
2023-08-30$1,900
-
2023-08-24historical $1,900
-
2023-07-28$2,100
-
2002-11-14soldstatus $422,750 237-char remark
Show marketing remark (237 chars)
REMARKABLE INVESTMENT PROPERTY WITH POSITIVE CASH FLOW CONVENIENT LOCATION READY ACCESS TO FWYS 105, 60 & 101. WALKING DISTANCE TO WHITE MEMORIAL HOSPITAL TO SHOW. DRIVE BY ONLY. DO NOT DISTURB TENANTS. OFFER SUBJECT TO INSPECTION.
-
2002-11-13soldstatus $423,000
-
2002-08-28historical 237-char remark
Show marketing remark (237 chars)
REMARKABLE INVESTMENT PROPERTY WITH POSITIVE CASH FLOW CONVENIENT LOCATION READY ACCESS TO FWYS 105, 60 & 101. WALKING DISTANCE TO WHITE MEMORIAL HOSPITAL TO SHOW. DRIVE BY ONLY. DO NOT DISTURB TENANTS. OFFER SUBJECT TO INSPECTION.
-
2002-07-10$465,000 237-char remark
Show marketing remark (237 chars)
REMARKABLE INVESTMENT PROPERTY WITH POSITIVE CASH FLOW CONVENIENT LOCATION READY ACCESS TO FWYS 105, 60 & 101. WALKING DISTANCE TO WHITE MEMORIAL HOSPITAL TO SHOW. DRIVE BY ONLY. DO NOT DISTURB TENANTS. OFFER SUBJECT TO INSPECTION.
-
1998-08-31soldstatus $400,000
-
1986-07-22soldstatus $296,000
-
1986-07-22soldstatus $296,000
ⓘ Source: listings_history table (triggers on properties + properties_extension) + one-shot
backfill from property_details.listing_events for pre-trigger history.
Tax reassessment forecast CA · Resets to sale price
- Current annual tax
- $8,656 · $721/mo
- Projected year-2 tax
- $16,948 · $1,412/mo
- Expected delta
- +$8,292/yr (+$691/mo · 95.8%)
ⓘ Screening estimate from a state-policy table — verify with the county assessor before closing.
Climate risk First Street
- Flood 1/10 Low FEMA zone X (unshaded) · 0% chance over 30 yrs
- Wildfire 1/10 Low
- Heat 6/10 Major 7 d/yr ≥94°F today · 21 d/yr by 30 yrs out
- Wind 1/10 Low
- Air quality 6/10 Major 11 unhealthy d/yr today · 12 by 30 yrs out
Nearby sold comps map
Loading sold comps map…
Walkable amenities ~0.75 mi
Loading nearby amenities…
Taxation est. · year 1
- Rental income
- $352,296
- − Mortgage interest
- −$124,915
- − Property taxes
- −$8,656
- − Insurance
- −$11,150
- − Repairs & maintenance
- −$28,184
- − Management
- −$28,184
- − Depreciation
- −$64,873
- Taxable income
- $86,335
- Est. tax owed @ 24.0%
- −$20,720
- After-tax cash flow
- $97,455/yr
For passive investors: Depreciation is non-cash, so a rental often shows a tax loss while cash-flowing — sheltering income. Rental losses are passive: they offset passive income freely, and up to $25,000/yr can offset ordinary (W-2) income if you actively participate and your MAGI is under $100k (phasing out to $0 by $150k); unused losses carry forward. On sale, claimed depreciation is recaptured at up to 25%, and gains may owe capital-gains tax (a 1031 exchange can defer both). Figures are a year-1 estimate at your 24.0% rate — not tax advice; consult a CPA.
Schools (NCES district)
- District
- Los Angeles Unified
- NCES district ID
- 0622710
- Math proficiency
- 29% ▼ -4.00%
- Reading proficiency
- 54% ▲ 10.00%
- Median HH income
- $50,403
- Composite
- 35.67/100
- National rank
- #4875
- State rank
- #223 of 517 in CA
Livability — Los Angeles
- Score
- 68/100
- State rank
- #273
- US rank
- #9237
Category grades
Schools grade is shown separately in the Schools card above.
Census & demographics
- Census place
- Los Angeles, CA
- County
- Los Angeles County · 9,444,647 people
- City population
- 3,838,149
- Metro
- Los Angeles-Long Beach-Anaheim, CA
- Population (ZIP)
- 45,647
- Household income
- $59,652
- Rent vs Own
- Severe rent burden
- 3159.0
Population outlook (Los Angeles County) Hauer SSP2
- Today (2025)
- 10,940,515 people
- By 2030
- 11,256,481 · +2.9%
- By 2040
- 11,729,929 · +7.2%
- By 2050
- 11,948,407 · +9.2%
- By 2075
- 11,818,114 · +8.0%
- By 2100
- 10,842,928 · -0.9%
Race, ethnicity, and origin ACS 2023
- Neighborhood character
- Predominantly Hispanic (90%)
- Race & ethnicity
- Hispanic / Latino 90% Two or more races 13% Asian 4% White 3% Native American 3% Black 1%
- Hispanic origin (detail)
- Mexican 75%
- Foreign-born
- 43% · Canada, South Korea, China
- Languages at home
- 16% English-only · Spanish 80% Other Asian/Pacific 1% Korean 1%
Political lean MEDSL · Los Angeles
- 2024 margin
- Solid D (+32.9) · D 64.8% · R 31.9% · Other 3.3%
- 2008→2024 swing
- -7.4pp toward R · 2008: 40.4pp · 2024: 32.9pp
- All cycles
- 2024: D+32.9 2020: D+44.2 2016: D+48.0 2012: D+40.0 2008: D+40.4
Not yet ingested
- Civics
- —
Market trends
- HPI YoY
- ▼ -201.59%
- Current HPI
- 472.4588
- Rent YoY
- ▼ -2.34%
- Metro
- Los Angeles-Long Beach-Anaheim, CA
- State GDP YoY
- ▲ 3.21%
- F500 in state
- 116
Industry mix (Fortune 500 HQ in CA)
| Industry | F500 HQs | Revenue |
|---|---|---|
| Technology | 27 | $1,492B |
|
||
| Financial Services | 3 | $174B |
|
||
| Retail | 3 | $44B |
|
||
| Insurance | 3 | $26B |
|
||
| Media / Entertainment | 2 | $115B |
|
||
| Pharmaceuticals / Biotech | 2 | $62B |
|
||
Price history
+653.4% since first listed23 events — show timeline
- 2026-01-05 Listed $2,230,000 CRMLS
- 2024-09-12 Rental Removed $1,800 LEASESTAR
- 2024-09-11 Listed for Rent $1,800 LEASESTAR
- 2024-06-22 Rental Removed $1,800 LEASESTAR
- 2024-06-12 Listed for Rent $1,800 LEASESTAR
- 2024-05-30 Rental Removed $1,800 LEASESTAR
- 2024-05-23 Price Changed $1,800 LEASESTAR
- 2024-05-08 Listed for Rent $1,850 LEASESTAR
- 2024-04-10 Rental Removed $1,850 LEASESTAR
- 2024-04-02 Listed for Rent $1,850 LEASESTAR
- 2024-03-07 Rental Removed $1,550 LEASESTAR
- 2024-03-06 Listed for Rent $1,600 LEASESTAR
- 2023-09-21 Rental Removed $1,900 LEASESTAR
- 2023-08-30 Listed for Rent $1,900 LEASESTAR
- 2023-08-24 Rental Removed $1,900 LEASESTAR
- 2023-07-28 Listed for Rent $2,100 LEASESTAR
- 2002-11-14 Sold (MLS) $422,750 TheMLS
- 2002-11-13 Sold (Public Records) $423,000 Public Records
- 2002-08-28 Delisted — TheMLS
- 2002-07-10 Listed $465,000 TheMLS
- 1998-08-31 Sold (Public Records) $400,000 Public Records
- 1986-07-22 Sold (Public Records) $296,000 Public Records
- 1986-07-22 Sold (Public Records) $296,000 Public Records
Property tax history
+1.7%/yrLatest (2025): $8,656 · +2.1% YoY. Source: county tax records.
Cash-flow waterfall
monthlySold comps — $/sqft
last 12 mo · ≤1 miLoading sold comps…