 Triplex
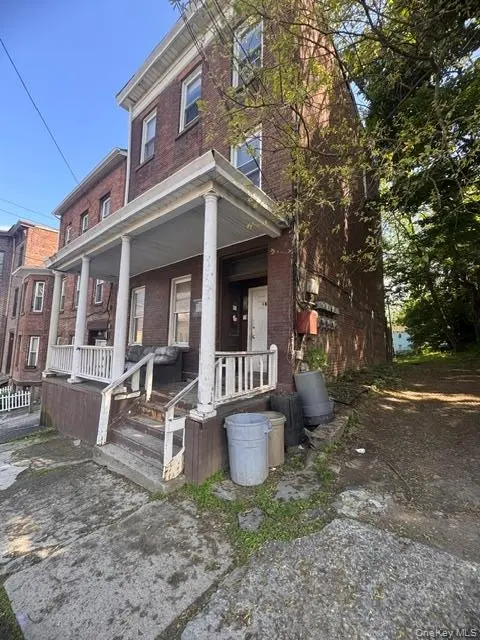
167 Ann St · Newburgh, NY
Flood risk 1/10 · Minimal
- FEMA flood zone
- X (unshaded)
- Chance of flooding over 30 yrs
- 0.0%
- Est. flood insurance / yr
- $473 – $860
Fire risk 1/10 · Minimal
- Est. fire insurance / yr
- $691 – $1,283
Heat risk 5/10 · Moderate
- Hot days now (above 100°F)
- 7 days/yr
- Hot days in 30 yrs
- 16 days/yr
Wind risk 4/10 · Minor
- Chance of severe wind over 30 yrs
- 12.0%
Air-quality risk 3/10 · Minor
- Unhealthy air days now
- 2 days/yr
- Unhealthy air days in 30 yrs
- 3 days/yr
Risk factors via First Street. Map © Google.
Why this score? — see what drove the B+ grade
The composite is a weighted blend of 9 inputs, each scored 0–100. Each bar is that input's sub-score; the figure is the points it added to the 100-point composite (weight × sub-score).
- Cash flow +30.0/30.0
- ARV discount +15.0/15.0
- DSCR +10.0/10.0
- 1% rule +9.5/10.0
- Schools +3.5/10.0
- Livability +3.1/5.0
- Rent growth +2.7/5.0
- Condition / age +2.5/5.0
- Appreciation +0.0/10.0
$375,000
🖨 Deal sheet 📄 Offer letter ✓ Due diligence
Multi-family units
County records classify this as Multi-Family (2-4 Unit). Listing-text estimate: 3 units. confirmed
Listing remarks MLS
Hurry!!!3 Unit Brick Occupied Investment Opportunity Located Near shops, cafes, restaurants and more!!! This property wont last!!!
Key facts
- Downtown newburgh
- Newburgh waterfront
- Brick 3-family home
Tags
Property features AI
Exterior
- Parking: On-street parking
- Utilities: Electricity connected (Central Hudson); Natural gas connected; Public sewer; Water connected
- Home design: Townhouse structure; Triplex property
- Construction: Brick construction
- Exterior features: Brick construction; Not waterfront; No additional parcels
Interior
- Bedrooms: One 1-bedroom unit; Two 2-bedroom units
- Bathrooms: Three full bathrooms
- Heating & cooling: Baseboard heating; No central cooling
- Interior features: Original details; Unfinished basement
Neighborhood map
What this means for you Summary
Snapshot
- This is a 2×2bd/1ba + 1×1bd/1ba units multifamily listed at $375k.
Deal economics
- At list price, monthly cash flow is $1k ($17k/yr) — positive. Per door: $468/mo.
- The deal already cash-flows at list — no discount required.
- Meets the 1% rule at list price ($5k rent vs $375k).
- Recommended offer: $364k (3.0% below list) — sets the bar for market timing.
- Cap rate 10.8% vs local median 4.4% in Newburgh — top-decile yield for the area; either an underpriced asset or a hidden risk that comps aren't pricing in. Stress-test before assuming the spread holds.
Location & tenants
- Location reads 62/100 on livability (#878 in NY) — a middle-class / working-renter tenant base. Strengths: health & safety A+, housing B+, cost of living B; Watch: employment D+, crime F, amenities F.
- Newburgh City School District (suburban): math 33% / reading 48% proficiency, ranked #500 of 590 in NY (top 85%) — families likely to look elsewhere, expect single-tenant / working-renter base with shorter leases; 61% free/reduced lunch — lower-income household profile, screen leases tightly.
- Zoned schools: Newburgh Free Academy (math 76% / reading 85%, grade A, #506 of 1,100 statewide, top 46%, 3,433 students, 56% FRL).
- Zoned-school proficiency averages 80% at this address vs 40% district-wide (+40 pts) — the actual schools serving this property are materially stronger than the Newburgh City School District average implies; a family-tenant draw the district grade alone would hide.
- Market conditions: Rents flat; 383 active listings in the ZIP; solid renter incomes; 1,746 units permitted in Orange County in 2024 (1,265 in 5+ unit buildings).
Forward outlook
- Local home prices are declining (-3.0%/yr); year-one equity from $3k of loan paydown is wiped out by about $11k of value loss. Plan a longer hold.
- At projected returns (-3.0% appreciation + 0.6% rent growth), your $105k cash investment doubles in ~10 years — after that, you're playing with house money.
Negotiation context
- It's been on market 34 days — a 3% lower offer ($364k) is reasonable based on typical stale-listing flexibility.
- 2 sale attempts since 7y ago with the ask held roughly flat each time — persistent listings suggest the price (not the market) is what's stuck; bring a comps-based counter.
- Current owner paid $260k; 44% above their basis — modest negotiation headroom, anchor on the comps not their cost.
Risks & watch-outs
- Watch-outs: built in 1910 — expect roof / HVAC / electrical / plumbing capex.
- Climate carrying-cost: extreme-heat days projected 7→16/yr by 2055 (HVAC capex compounding) — expect insurance premiums to compound above CPI over the hold.
Questions for the listing agent
- It's been on market 34 days. Have you received any prior offers? Is the seller open to a 3% concession, seller financing, or rate buy-down credit?
- Can we see the unit-by-unit rent roll, current vacancy, and any below-market leases? What's the average tenancy length?
- What capital expenditures (roof, boiler, parking lot, exteriors) have been made in the last 5 years, and what's planned in the next 2?
- Built in 1910 — when were the roof, HVAC, electrical panel, plumbing, and water heater last replaced?
- Is there a deadline driving the sale (1031 exchange, divorce, estate, relocation)? That informs how much negotiation room exists.
- Schools are D-rated, which usually means shorter tenancies and higher turnover. Who's the typical renter profile here, and what's been the actual vacancy rate?
- Crime grade is F in this area — have there been break-ins, vandalism, or insurance claims at this property in the last 3 years? What carrier currently insures it and at what premium?
- What's the average days-on-market for RENTAL listings here right now (not sales)? A rising rental-DOM trend means longer vacancies and softer asking-rent achievability than the comps imply.
- What's the recent tenant-quality profile in this submarket — average credit score on applications, eviction rate, late-payment / NSF rate, and stable-employment percentage? A property-management company in the area should have these aggregated.
- How much new apartment / multifamily construction is in the pipeline within 1–3 miles? Heavy new supply (>2% of stock underway) typically softens rents 12–24 months out; light construction supports rent growth.
Investment metrics
- 1% rule
- 1.45% ✓
- Cap rate
- 10.78%
- Cash-on-cash
- 16.04%
- DSCR
- 1.71
- GRM
- 5.8
CMA / ARV
- ARV (median comp)
- $616,473
- List price
- $375,000
- Delta
- -39.17%
- Verdict
- UNDERPRICED
- Comps
- 20 within 1.0 mi
Show comp detail 7 sales within ~0.75 mi
| Address | Dist | Beds/Ba | Sqft | Sold | Price | $/sf | Match |
|---|---|---|---|---|---|---|---|
| 52 Benkard Ave | 0.26mi | 6/3.0 (-1) | 2,400 (+5%) | 5mo | $375,000 | $156 | 71 |
| 76 Johnston St #74 | 0.26mi | 8/2.0 (+1) | 2,315 (+1%) | 15mo | $260,000 | $112 | 65 |
| 16 Lutheran St | 0.19mi | 6/2.0 (-1) | 2,508 (+9%) | 13mo | $380,000 | $152 | 56 |
| 60 Johnston St | 0.21mi | 6/2.0 (-1) | 2,625 (+14%) | 18mo | $298,000 | $114 | 42 |
| 48 Overlook Pl | 0.43mi | 6/4.0 (-1) | 2,060 (-10%) | 22mo | $300,000 | $146 | 36 |
| 298 Liberty St | 0.54mi | 6/3.0 (-1) | 2,573 (+12%) | 20mo | $370,000 | $144 | 33 |
| 121 Gidney Ave | 0.68mi | 6/2.0 (-1) | 1,992 (-13%) | 22mo | $456,000 | $229 | 19 |
Match score weights: distance 35% · size 25% · config 20% · recency 20%. Top-matched comps best support the ARV.
Projected returns pro-forma
-3.0% appreciation · 0.63% rent growth · sell at horizon
- IRR
- 4.1%
- Equity multiple
- 1.15×
- Total profit
- $16,246
- Equity at exit
- $55,914
- IRR
- 11.1%
- Equity multiple
- 1.77×
- Total profit
- $80,827
- Equity at exit
- $32,423
Cash invested: $105,000 (down + closing). Projections, not guarantees.
Landlord ↔ Tenant lean methodology
- Overall (STATE)
- 15 Strongly Tenant-Friendly
- State New York
- 15 Strongly Tenant-Friendly · D+10
- County
- — inherits STATE
- City
- — inherits STATE
ZIP-level market 12550
- Home prices YoY
- -33.3%
- Rents YoY
- 0.6%
- Active inventory
- 383
- Price-to-rent
- 16.9×
Monthly cashflow live
- Estimated rent
- $5,431 high interval (Pro) →
- Mortgage (P&I)
- −$1,967
- Tax from tax record
- −$764 /mo · $9,168/yr
- Insurance
- −$156
- HOA
- −$0
- Vacancy / Maint / Mgmt
- −$1,141
- Net cashflow
- $1,404
Break-even live
3-unit breakdown (identical units grouped — click to expand)
| Units | Beds | Baths | Est. rent |
|---|---|---|---|
| 2× units | 2 | 1 | $3,704 |
| #1 | 2 | 1 | $1,852 |
| #2 | 2 | 1 | $1,852 |
| 1× unit | 1 | 1 | $1,727 |
| Total (3 units) | $5,431 | ||
UW: 25.0% down · 7.5% · 30yr · 1.5% tax · 5.0% vac · 8.0% maint · 8.0% mgmt
Financing live
Cash to close
- Down payment
- $93,750
- Closing costs
- $11,250
- Reserves months
- —
- Total cash needed
- —
Loan-product check · same deal, 3 products live
Conventional
25% down · 7.5% · 30yr
- Down + closing
- —
- Monthly P&I
- —
- Monthly cashflow
- —
- DSCR
- —
- Eligible?
- —
Personal DTI + credit; lowest rate.
DSCR
20% down · 8.5% · 30yr
- Down + closing
- —
- Monthly P&I
- —
- Monthly cashflow
- —
- DSCR
- —
- Eligible?
- —
No personal income docs; deal must DSCR.
Hard money
10% down · 12.0% · 12mo
- Down + closing
- —
- Monthly P&I
- —
- Monthly cashflow
- —
- DSCR
- —
- Eligible?
- —
Short-term bridge; refi at stabilization.
Listing history 21 events
-
2026-06-18days on market $375,000 Active 34 DOM
-
2026-06-17days on market $375,000 Active 33 DOM
-
2026-06-16days on market $375,000 Active 32 DOM
-
2026-06-15days on market $375,000 Active 31 DOM
-
2026-06-14days on market $375,000 Active 29 DOM
-
2026-06-13days on market $375,000 Active 28 DOM
-
2026-06-10days on market $375,000 Active 26 DOM
-
2026-06-09days on market $375,000 Active 25 DOM
-
2026-06-08days on market $375,000 Active 24 DOM
-
2026-06-07days on market $375,000 Active 23 DOM
-
2026-06-03days on market $375,000 Active 19 DOM
-
2026-06-02days on market $375,000 Active 18 DOM
-
2026-06-01days on market $375,000 Active 17 DOM
-
2026-05-31days on market $375,000 Active 16 DOM
-
2026-05-30days on market $375,000 Active 15 DOM
-
2026-05-13$375,000 Active 1165-char remark
-
2020-03-13soldstatus $260,000
-
2019-11-06soldstatus $260,000 Sold 130-char remark
Show marketing remark (130 chars)
Hurry!!!3 Unit Brick Occupied Investment Opportunity Located Near shops, cafes, restaurants and more!!! This property wont last!!!
-
2019-08-06status Pending 130-char remark
Show marketing remark (130 chars)
Hurry!!!3 Unit Brick Occupied Investment Opportunity Located Near shops, cafes, restaurants and more!!! This property wont last!!!
-
2019-07-10$267,000 Active 130-char remark
Show marketing remark (130 chars)
Hurry!!!3 Unit Brick Occupied Investment Opportunity Located Near shops, cafes, restaurants and more!!! This property wont last!!!
-
2018-12-28soldstatus $115,000
ⓘ Source: listings_history table (triggers on properties + properties_extension) + one-shot
backfill from property_details.listing_events for pre-trigger history.
Tax reassessment forecast NY · Partial reset (capped growth)
- Current annual tax
- $9,168 · $764/mo
- Projected year-2 tax
- $9,168 · $764/mo
- Expected delta
- $0/yr ($0/mo · 0.0%)
ⓘ Screening estimate from a state-policy table — verify with the county assessor before closing.
Climate risk First Street
- Flood 1/10 Low FEMA zone X (unshaded) · 0% chance over 30 yrs
- Wildfire 1/10 Low
- Heat 5/10 Major 7 d/yr ≥100°F today · 16 d/yr by 30 yrs out
- Wind 4/10 Moderate 12% chance of damaging wind over 30 yrs
- Air quality 3/10 Moderate 2 unhealthy d/yr today · 3 by 30 yrs out
Nearby sold comps map
Loading sold comps map…
Walkable amenities ~0.75 mi
Loading nearby amenities…
Taxation est. · year 1
- Rental income
- $65,172
- − Mortgage interest
- −$21,006
- − Property taxes
- −$9,168
- − Insurance
- −$1,875
- − Repairs & maintenance
- −$5,214
- − Management
- −$5,214
- − Depreciation
- −$10,909
- Taxable income
- $11,786
- Est. tax owed @ 24.0%
- −$2,829
- After-tax cash flow
- $14,015/yr
For passive investors: Depreciation is non-cash, so a rental often shows a tax loss while cash-flowing — sheltering income. Rental losses are passive: they offset passive income freely, and up to $25,000/yr can offset ordinary (W-2) income if you actively participate and your MAGI is under $100k (phasing out to $0 by $150k); unused losses carry forward. On sale, claimed depreciation is recaptured at up to 25%, and gains may owe capital-gains tax (a 1031 exchange can defer both). Figures are a year-1 estimate at your 24.0% rate — not tax advice; consult a CPA.
Schools (NCES district)
- District
- Newburgh City School District
- NCES district ID
- 3620700
- Math proficiency
- 33% ▼ -8.00%
- Reading proficiency
- 48% ▲ 10.00%
- Median HH income
- $56,387
- Composite
- 35.46/100
- National rank
- #4927
- State rank
- #500 of 590 in NY
Livability — Newburgh
- Score
- 62/100
- State rank
- #878
- US rank
- #17021
Category grades
Schools grade is shown separately in the Schools card above.
Census & demographics
- Census place
- Newburgh, NY
- County
- Orange County · 267,004 people
- City population
- 55,152
- Metro
- Poughkeepsie-Newburgh-Middletown, NY
- Population (ZIP)
- 55,152
- Household income
- $85,697
- Rent vs Own
- Severe rent burden
- 2412.0
Population outlook (Orange County) Hauer SSP2
- Today (2025)
- 379,830 people
- By 2030
- 378,955 · -0.2%
- By 2040
- 375,444 · -1.2%
- By 2050
- 369,311 · -2.8%
- By 2075
- 354,233 · -6.7%
- By 2100
- 318,150 · -16.2%
Race, ethnicity, and origin ACS 2023
- Neighborhood character
- Diverse neighborhood (Simpson 0.68)
- Race & ethnicity
- Hispanic / Latino 39% White 36% Black 20% Two or more races 12% Asian 2%
- Hispanic origin (detail)
- Mexican 14% Puerto Rican 10% Dominican 2%
- Common ancestry
- Romanian 2% Hispanic 1% Lithuanian 1%
- Foreign-born
- 18% · Canada, Dominican Republic
- Languages at home
- 64% English-only · Spanish 30% French/Haitian/Cajun 1% Other Indo-European 1%
Political lean MEDSL · Orange
- 2024 margin
- Lean R (+8.4) · D 45.8% · R 54.2%
- 2008→2024 swing
- -12.5pp toward R · 2008: 4.1pp · 2024: -8.4pp
- All cycles
- 2024: R+8.4 2020: R+0.2 2016: R+6.5 2012: D+5.2 2008: D+4.1
Not yet ingested
- Civics
- —
Market trends
- HPI YoY
- ▼ -151.93%
- Current HPI
- 304.1046
- Rent YoY
- ▲ 0.63%
- Metro
- Poughkeepsie-Newburgh-Middletown, NY
- State GDP YoY
- ▲ 2.60%
- F500 in state
- 92
Industry mix (Fortune 500 HQ in NY)
| Industry | F500 HQs | Revenue |
|---|---|---|
| Financial Services | 10 | $950B |
|
||
| Consumer Goods | 9 | $162B |
|
||
| Insurance | 4 | $225B |
|
||
| Telecommunications | 2 | $144B |
|
||
| Pharmaceuticals | 2 | $112B |
|
||
| Media / Entertainment | 2 | $69B |
|
||
Price history
+226.1% since first listed6 events — show timeline
- 2026-05-13 Listed $375,000 OneKey® MLS as Distributed by MLS Grid
- 2020-03-13 Sold (Public Records) $260,000 Public Records
- 2019-11-06 Sold (MLS) $260,000 OneKey® MLS as Distributed by MLS Grid
- 2019-08-06 Pending — OneKey® MLS as Distributed by MLS Grid
- 2019-07-10 Listed $267,000 OneKey® MLS as Distributed by MLS Grid
- 2018-12-28 Sold (Public Records) $115,000 Public Records
Property tax history
+4.5%/yrLatest (2025): $9,168 · -4.2% YoY. Source: county tax records.
Cash-flow waterfall
monthlySold comps — $/sqft
last 12 mo · ≤1 miLoading sold comps…