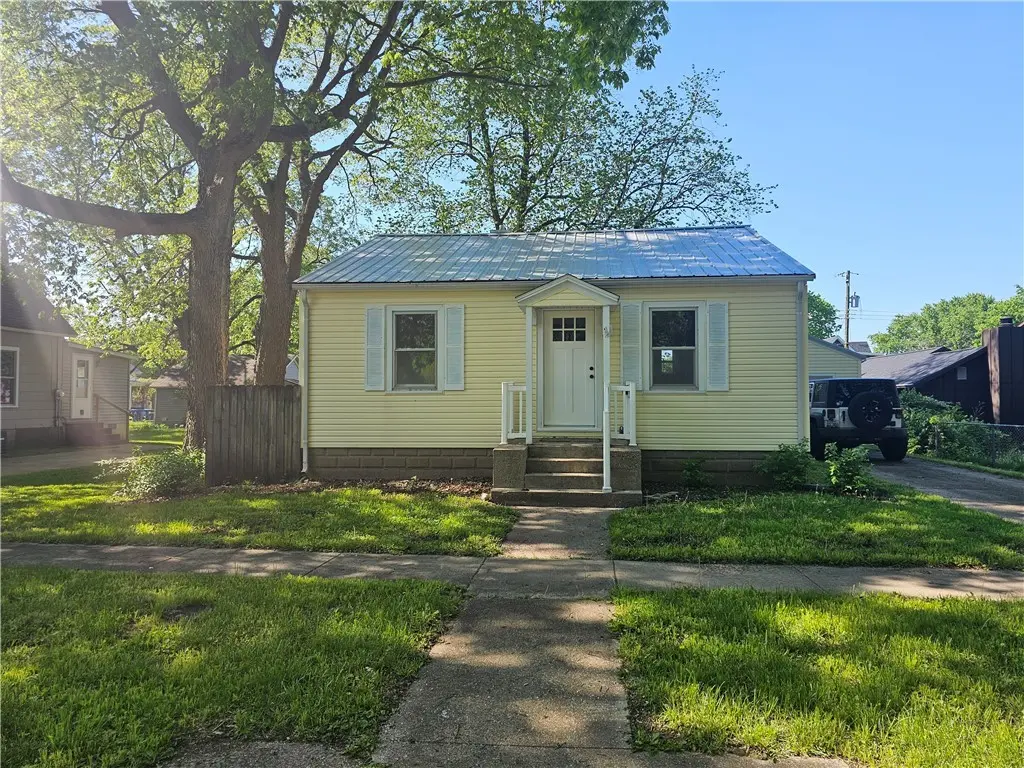
411 E Lincoln St · Monticello, IL
Flood risk 1/10 · Minimal
- FEMA flood zone
- X (unshaded)
- Chance of flooding over 30 yrs
- 0.0%
- Est. flood insurance / yr
- $507 – $1,088
Fire risk 1/10 · Minimal
- Est. fire insurance / yr
- $804 – $1,492
Heat risk 3/10 · Minor
- Hot days now (above 104°F)
- 7 days/yr
- Hot days in 30 yrs
- 19 days/yr
Wind risk 2/10 · Minimal
- Chance of severe wind over 30 yrs
- 1.0%
Air-quality risk 2/10 · Minimal
- Unhealthy air days now
- 1 days/yr
- Unhealthy air days in 30 yrs
- 1 days/yr
Risk factors via First Street. Map © Google.
Why this score? — see what drove the C grade
The composite is a weighted blend of 9 inputs, each scored 0–100. Each bar is that input's sub-score; the figure is the points it added to the 100-point composite (weight × sub-score).
- Cash flow +23.0/30.0
- ARV discount +8.9/15.0
- DSCR +7.4/10.0
- 1% rule +5.7/10.0
- Livability +4.1/5.0
- Schools +3.7/10.0
- Rent growth +2.5/5.0
- Condition / age +2.5/5.0
- Appreciation +0.0/10.0
$139,950
🖨 Deal sheet 📄 Offer letter ✓ Due diligence
Listing remarks MLS
Handyman special! This 2 bedroom home in Monticello is perfect for an investment or someone wanting to make a home theirs. Hardwood floors and beautiful trim are inside the home and could easily be brought back to life. Note the home contents will NOT be emptied prior to closing and will be buyers responsibility to clear out. AS-IS sale. Call your realtor today for this cute home with so much potential. Year of home build is unknown.
Key facts
- New stove
- New flooring
- New paint
Tags
Property features AI
Exterior
- Parking: Detached garage (1 car)
- Utilities: Public water; Public sewer
- Home design: Single-family residence; One story
- Construction: Vinyl siding
- Exterior features: Concrete road access; Metal roof
Interior
- Kitchen: Oven
- Bedrooms: 4 total rooms (bedrooms and living areas included)
- Bathrooms: 1 full bathroom
- Heating & cooling: Natural gas forced air heating; Central air conditioning
- Interior features: Gas water heater; Oven; Unfinished full basement
- Laundry & utility: Gas water heater
Neighborhood map
What this means for you Summary
Snapshot
- This is a 2-bed/1.0-bath single-family listed at $140k.
Deal economics
- At list price, monthly cash flow is $249 ($3k/yr) — positive.
- The deal already cash-flows at list — no discount required.
- Meets the 1% rule at list price ($1k rent vs $140k).
- Cap rate 8.4% vs local median 3.5% in Monticello — top-decile yield for the area; either an underpriced asset or a hidden risk that comps aren't pricing in. Stress-test before assuming the spread holds.
Location & tenants
- Location reads 82/100 on livability (#69 in IL, #1,132 nationally) — a professional / high-income tenant draw. Strengths: crime A+, employment A+, cost of living A+; Watch: amenities F, commute F.
- Monticello CUSD 25 (town): math 30% / reading 51% proficiency, ranked #123 of 620 in IL (top 20%) — families likely to look elsewhere, expect single-tenant / working-renter base with shorter leases; only 15% free/reduced lunch — higher-income household profile.
- Market conditions: 47 active listings in the ZIP; 34 units permitted in Piatt County in 2024 (0 in 5+ unit buildings).
Forward outlook
- Local home prices are declining (-3.0%/yr); year-one equity from $968 of loan paydown is wiped out by about $4k of value loss. Plan a longer hold.
- Piatt County population projected at -19% by 2050 — secular population decline; favor cash flow + early exit over multi-decade hold.
Negotiation context
- Only 1 days on market — expect competitive offers; lowballing is unlikely to land.
- 5 sale attempts since 15y ago with the ask held roughly flat each time — persistent listings suggest the price (not the market) is what's stuck; bring a comps-based counter.
- Current owner paid $103k; 36% above their basis — modest negotiation headroom, anchor on the comps not their cost.
Risks & watch-outs
- Watch-outs: built in 1900 — expect roof / HVAC / electrical / plumbing capex.
Questions for the listing agent
- Built in 1900 — when were the roof, HVAC, electrical panel, plumbing, and water heater last replaced?
- Is there a deadline driving the sale (1031 exchange, divorce, estate, relocation)? That informs how much negotiation room exists.
- Schools are B-rated — typically a magnet for longer-tenancy family renters. What's the average tenant stay here, and is there a school-zone premium baked into asking?
- What's the average days-on-market for RENTAL listings here right now (not sales)? A rising rental-DOM trend means longer vacancies and softer asking-rent achievability than the comps imply.
- What's the recent tenant-quality profile in this submarket — average credit score on applications, eviction rate, late-payment / NSF rate, and stable-employment percentage? A property-management company in the area should have these aggregated.
- How much new for-sale + rental construction is in the pipeline within 1–3 miles? Heavy new supply typically softens prices + rents 12–24 months out; constrained supply supports both.
Investment metrics
- 1% rule
- 1.07% ✓
- Cap rate
- 8.43%
- Cash-on-cash
- 7.62%
- DSCR
- 1.34
- GRM
- 7.8
CMA / ARV
- ARV (on-the-fly)
- $144,480
- Comps found
- 12
Show comp detail 12 sales within ~0.75 mi
| Address | Dist | Beds/Ba | Sqft | Sold | Price | $/sf | Match |
|---|---|---|---|---|---|---|---|
| 411 E Lincoln St | 0.00mi | 2/1.0 | 840 (0%) | 1mo | $139,950 | $167 | 99 |
| 708 E Center St | 0.13mi | 1/1.0 (-1) | 845 (+1%) | 0mo | $145,000 | $172 | 88 |
| 413 E Lincoln St | 0.02mi | 2/1.0 | 902 (+7%) | 3mo | $160,000 | $177 | 84 |
| 216 E High St | 0.10mi | 2/1.0 | 869 (+4%) | 18mo | $160,500 | $185 | 74 |
| 3 Morfey Ct | 0.46mi | 2/1.0 | 826 (-2%) | 5mo | $123,000 | $149 | 71 |
| 517 N Buchanan St | 0.01mi | 2/1.0 | 919 (+9%) | 15mo | $176,000 | $192 | 71 |
| 442 S Hamilton St | 0.50mi | 2/1.0 | 873 (+4%) | 0mo | $145,000 | $166 | 70 |
| 309 E Lincoln St | 0.04mi | 2/1.0 | 953 (+14%) | 14mo | $135,000 | $142 | 64 |
| 707 Emerson St | 0.58mi | 3/1.0 (+1) | 864 (+3%) | 8mo | $128,000 | $148 | 56 |
| 708 S Emerson St | 0.58mi | 3/1.0 (+1) | 880 (+5%) | 6mo | $179,000 | $203 | 55 |
| 713 E High St | 0.12mi | 1/1.0 (-1) | 717 (-15%) | 15mo | $132,000 | $184 | 52 |
| 419 S Hamilton St | 0.45mi | 2/1.0 | 956 (+14%) | 6mo | $85,000 | $89 | 51 |
Match score weights: distance 35% · size 25% · config 20% · recency 20%. Top-matched comps best support the ARV.
Projected returns pro-forma
-3.0% appreciation · 3.0% rent growth · sell at horizon
- IRR
- -4.7%
- Equity multiple
- 0.83×
- Total profit
- $-6,822
- Equity at exit
- $20,867
- IRR
- 5.0%
- Equity multiple
- 1.37×
- Total profit
- $14,472
- Equity at exit
- $12,100
Cash invested: $39,186 (down + closing). Projections, not guarantees.
Landlord ↔ Tenant lean methodology
- Overall (STATE)
- 43 Moderately Tenant-Leaning
- State Illinois
- 43 Moderately Tenant-Leaning · D+7
- County
- — inherits STATE
- City
- — inherits STATE
ZIP-level market 61856
- Active inventory
- 47
- Price-to-rent
- 7.8×
Monthly cashflow live
- Estimated rent
- $1,491 medium interval (Pro) →
- Mortgage (P&I)
- −$734
- Tax from tax record
- −$136 /mo · $1,638/yr
- Insurance
- −$58
- HOA
- −$0
- Vacancy / Maint / Mgmt
- −$313
- Net cashflow
- $249
Break-even live
UW: 25.0% down · 7.5% · 30yr · 1.5% tax · 5.0% vac · 8.0% maint · 8.0% mgmt
Financing live
Cash to close
- Down payment
- $34,988
- Closing costs
- $4,198
- Reserves months
- —
- Total cash needed
- —
Loan-product check · same deal, 3 products live
Conventional
25% down · 7.5% · 30yr
- Down + closing
- —
- Monthly P&I
- —
- Monthly cashflow
- —
- DSCR
- —
- Eligible?
- —
Personal DTI + credit; lowest rate.
DSCR
20% down · 8.5% · 30yr
- Down + closing
- —
- Monthly P&I
- —
- Monthly cashflow
- —
- DSCR
- —
- Eligible?
- —
No personal income docs; deal must DSCR.
Hard money
10% down · 12.0% · 12mo
- Down + closing
- —
- Monthly P&I
- —
- Monthly cashflow
- —
- DSCR
- —
- Eligible?
- —
Short-term bridge; refi at stabilization.
Listing history 15 events
-
2026-05-01status Pending
-
2026-04-29$139,950 Active
-
2025-05-16soldstatus $103,250 Closed 437-char remark
Show marketing remark (437 chars)
Handyman special! This 2 bedroom home in Monticello is perfect for an investment or someone wanting to make a home theirs. Hardwood floors and beautiful trim are inside the home and could easily be brought back to life. Note the home contents will NOT be emptied prior to closing and will be buyers responsibility to clear out. AS-IS sale. Call your realtor today for this cute home with so much potential. Year of home build is unknown.
-
2025-05-16soldstatus $103,250
Show marketing remark (437 chars)
Handyman special! This 2 bedroom home in Monticello is perfect for an investment or someone wanting to make a home theirs. Hardwood floors and beautiful trim are inside the home and could easily be brought back to life. Note the home contents will NOT be emptied prior to closing and will be buyers responsibility to clear out. AS-IS sale. Call your realtor today for this cute home with so much potential. Year of home build is unknown.
-
2025-03-29status Pending 437-char remark
Show marketing remark (437 chars)
Handyman special! This 2 bedroom home in Monticello is perfect for an investment or someone wanting to make a home theirs. Hardwood floors and beautiful trim are inside the home and could easily be brought back to life. Note the home contents will NOT be emptied prior to closing and will be buyers responsibility to clear out. AS-IS sale. Call your realtor today for this cute home with so much potential. Year of home build is unknown.
-
2025-03-26$89,900 Active 437-char remark
Show marketing remark (437 chars)
Handyman special! This 2 bedroom home in Monticello is perfect for an investment or someone wanting to make a home theirs. Hardwood floors and beautiful trim are inside the home and could easily be brought back to life. Note the home contents will NOT be emptied prior to closing and will be buyers responsibility to clear out. AS-IS sale. Call your realtor today for this cute home with so much potential. Year of home build is unknown.
-
2021-10-22historical
-
2021-09-14price
-
2021-08-31Active
-
2013-09-11soldstatus $81,000
-
2013-09-11soldstatus $81,000
-
2013-02-15$87,900
-
2011-11-01soldstatus $78,500
-
2011-10-24soldstatus $78,500
-
2011-05-10$82,000
ⓘ Source: listings_history table (triggers on properties + properties_extension) + one-shot
backfill from property_details.listing_events for pre-trigger history.
Tax reassessment forecast IL · Partial reset (capped growth)
- Current annual tax
- $1,638 · $136/mo
- Projected year-2 tax
- $2,407 · $201/mo
- Expected delta
- +$769/yr (+$64/mo · 47.0%)
ⓘ Screening estimate from a state-policy table — verify with the county assessor before closing.
Climate risk First Street
- Flood 1/10 Low FEMA zone X (unshaded) · 0% chance over 30 yrs
- Wildfire 1/10 Low
- Heat 3/10 Moderate 7 d/yr ≥104°F today · 19 d/yr by 30 yrs out
- Wind 2/10 Low 100% chance of damaging wind over 30 yrs
- Air quality 2/10 Low 1 unhealthy d/yr today · 1 by 30 yrs out
Nearby sold comps map
Loading sold comps map…
Walkable amenities ~0.75 mi
Loading nearby amenities…
Taxation est. · year 1
- Rental income
- $17,889
- − Mortgage interest
- −$7,839
- − Property taxes
- −$1,638
- − Insurance
- −$700
- − Repairs & maintenance
- −$1,431
- − Management
- −$1,431
- − Depreciation
- −$4,071
- Taxable income
- $778
- Est. tax owed @ 24.0%
- −$187
- After-tax cash flow
- $2,801/yr
For passive investors: Depreciation is non-cash, so a rental often shows a tax loss while cash-flowing — sheltering income. Rental losses are passive: they offset passive income freely, and up to $25,000/yr can offset ordinary (W-2) income if you actively participate and your MAGI is under $100k (phasing out to $0 by $150k); unused losses carry forward. On sale, claimed depreciation is recaptured at up to 25%, and gains may owe capital-gains tax (a 1031 exchange can defer both). Figures are a year-1 estimate at your 24.0% rate — not tax advice; consult a CPA.
Schools (NCES district)
- District
- Monticello CUSD 25
- NCES district ID
- 1726550
- Math proficiency
- 30% ▼ -10.00%
- Reading proficiency
- 51% ▼ -5.00%
- Median HH income
- $69,919
- Composite
- 36.73/100
- National rank
- #4590
- State rank
- #123 of 620 in IL
Livability — Monticello
- Score
- 82/100
- State rank
- #69
- US rank
- #1132
Category grades
Schools grade is shown separately in the Schools card above.
Census & demographics
- Census place
- Monticello, IL
- City population
- 8,110
- Population (ZIP)
- 8,110
Population outlook (Piatt County) Hauer SSP2
- Today (2025)
- 15,501 people
- By 2030
- 14,978 · -3.4%
- By 2040
- 13,805 · -10.9%
- By 2050
- 12,563 · -19.0%
- By 2075
- 9,916 · -36.0%
- By 2100
- 7,295 · -52.9%
Race, ethnicity, and origin ACS 2023
- Neighborhood character
- Predominantly White (95%)
- Race & ethnicity
- White 95% Black 3% Two or more races 2% Hispanic / Latino 1%
- Common ancestry
- Slovak 3% Italian 3% Iranian 1%
- Foreign-born
- 1% · Canada
- Languages at home
- 99% English-only · Spanish 1%
Political lean MEDSL · Piatt
- 2024 margin
- Solid R (+30.5) · D 33.7% · R 64.3% · Other 2.0%
- 2008→2024 swing
- -18.0pp toward R · 2008: -12.6pp · 2024: -30.5pp
- All cycles
- 2024: R+30.5 2020: R+29.6 2016: R+33.6 2012: R+26.8 2008: R+12.6
Not yet ingested
- Civics
- —
Market trends
- HPI YoY
- ▼ -100.96%
- Current HPI
- 160.6145
- Rent YoY
- —
- Metro
- —
- State GDP YoY
- ▲ 1.59%
- F500 in state
- 60
Industry mix (Fortune 500 HQ in IL)
| Industry | F500 HQs | Revenue |
|---|---|---|
| Insurance | 4 | $201B |
|
||
| Consumer Goods | 4 | $87B |
|
||
| Industrial Machinery | 3 | $64B |
|
||
| Healthcare | 2 | $55B |
|
||
| Retail / Pharmacy | 1 | $148B |
|
||
| Agriculture / Food | 1 | $86B |
|
||
Price history
+70.7% since first listed15 events — show timeline
- 2026-05-01 Pending — CIBR
- 2026-04-29 Listed $139,950 CIBR
- 2025-05-16 Sold (Public Records) $103,250 Public Records
- 2025-05-16 Sold (MLS) $103,250 CIBR
- 2025-03-29 Pending — CIBR
- 2025-03-26 Listed $89,900 CIBR
- 2021-10-22 Listing Removed — MRED as Distributed by MLS Grid
- 2021-09-14 Price Changed — MRED as Distributed by MLS Grid
- 2021-08-31 Listed — MRED as Distributed by MLS Grid
- 2013-09-11 Sold (Public Records) $81,000 Public Records
- 2013-09-11 Sold (MLS) $81,000 MRED as Distributed by MLS Grid
- 2013-02-15 Listed $87,900 MRED as Distributed by MLS Grid
- 2011-11-01 Sold (MLS) $78,500 MRED as Distributed by MLS Grid
- 2011-10-24 Sold (Public Records) $78,500 Public Records
- 2011-05-10 Listed $82,000 MRED as Distributed by MLS Grid
Property tax history
+7.1%/yrLatest (2024): $1,638 · +86.4% YoY. Source: county tax records.
Cash-flow waterfall
monthlySold comps — $/sqft
last 12 mo · ≤1 miLoading sold comps…