106 Kavanaugh St · Trenton, MO
Flood risk 1/10 · Minimal
- FEMA flood zone
- X (unshaded)
- Chance of flooding over 30 yrs
- 0.0%
- Est. flood insurance / yr
- $473 – $860
Fire risk 1/10 · Minimal
- Est. fire insurance / yr
- $1,054 – $1,958
Heat risk 3/10 · Minor
- Hot days now (above 106°F)
- 7 days/yr
- Hot days in 30 yrs
- 15 days/yr
Wind risk 2/10 · Minimal
- Chance of severe wind over 30 yrs
- —
Air-quality risk 2/10 · Minimal
- Unhealthy air days now
- 0 days/yr
- Unhealthy air days in 30 yrs
- 2 days/yr
Risk factors via First Street. Map © Google.
Why this score? — see what drove the D- grade
The composite is a weighted blend of 9 inputs, each scored 0–100. Each bar is that input's sub-score; the figure is the points it added to the 100-point composite (weight × sub-score).
- Cash flow +15.3/30.0
- DSCR +4.7/10.0
- ARV discount +4.3/15.0
- Livability +3.8/5.0
- 1% rule +3.2/10.0
- Schools +3.0/10.0
- Rent growth +2.5/5.0
- Condition / age +2.5/5.0
- Appreciation +0.0/10.0
$124,900
🖨 Deal sheet (PDF) 📄 Offer letter ✓ Due diligence
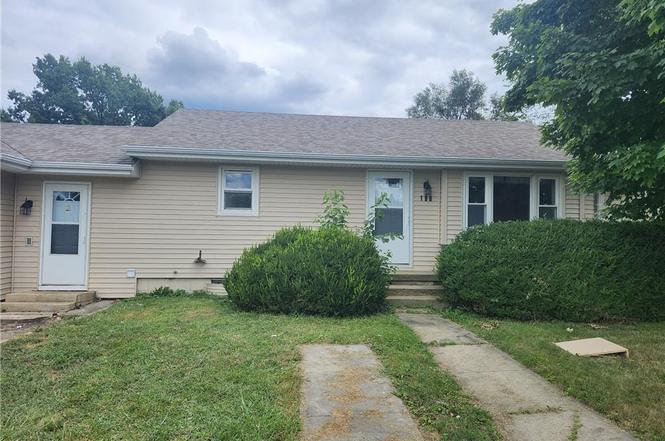
Listing remarks
Located in a nice neighborhood in Trenton, this 3 bedroom home is move in ready. New flooring is found throughout the home. The kitchen cabinets and countertops have been refurbished and have lots of storage space. Adjacent to the kitchen is a nice dining room. The home also has a separate family room as well as the living room. The family room could easily be converted to a 4th bedroom if needed or a large office space/work area. The home has 1 ½ baths. Nice homes that are affordable are hard to find right now. This one won’t last long.
Key facts
- New flooring
- Dining room
- Separate family room
Tags
Neighborhood map
What this means for you Summary
Snapshot
- This is a 2-bed/1.5-bath single-family listed at $125k.
Deal economics
- At list price, monthly cash flow is $45 ($542/yr) — positive.
- The deal already cash-flows at list — no discount required.
- To meet the 1% rule (rent ≥ 1% of price), the offer needs to be $103k (17.6% below list).
- Recommended offer: $103k (17.6% below list) — sets the bar for 1% rule.
Location & tenants
- Location reads 76/100 on livability (#49 in MO, #3,686 nationally) — a middle-class / working-renter tenant base. Strengths: cost of living A+, housing A+, health & safety A+; Watch: employment C-, amenities F, commute F.
- Trenton R-IX (town): math 28% / reading 43% proficiency, ranked #223 of 324 in MO (top 69%) — families likely to look elsewhere, expect single-tenant / working-renter base with shorter leases.
- Zoned schools: Rissler Elem. (math 37% / reading 42%, grade F, #537 of 1,115 statewide, top 53%, 480 students, 54% FRL); Trenton Middle (math 29% / reading 38%, grade F, #260 of 391 statewide, top 67%, 299 students, 50% FRL); Trenton Sr. High (math 8% / reading 57%, grade F, #354 of 521 statewide, top 68%, 326 students, 43% FRL) — zoned schools at 49% FRL track the district average.
- Market conditions: 51 active listings in the ZIP; 2 units permitted in Grundy County in 2024 (0 in 5+ unit buildings).
Forward outlook
- Local home prices are declining (-3.0%/yr); year-one equity from $864 of loan paydown is wiped out by about $4k of value loss. Plan a longer hold.
- Grundy County population projected at -14% by 2050 — secular population decline; favor cash flow + early exit over multi-decade hold.
Negotiation context
- It's been on market 209 days — a 12% lower offer ($110k) is reasonable based on typical stale-listing flexibility.
- 2 sale attempts; this cycle's ask has dropped $15k (11%) from the opening price — seller is motivated, your offer sets the floor, not the list.
Risks & watch-outs
- Watch-outs: built in 1950 — expect roof / HVAC / electrical / plumbing capex.
Questions for the listing agent
- It's been on market 209 days. Have you received any prior offers? Is the seller open to a 18% concession, seller financing, or rate buy-down credit?
- Built in 1950 — when were the roof, HVAC, electrical panel, plumbing, and water heater last replaced?
- Why hasn't it sold? Are there any deal-killer items the seller is aware of (foundation, flood, title, zoning, code violations)?
- Is there a deadline driving the sale (1031 exchange, divorce, estate, relocation)? That informs how much negotiation room exists.
- The area grade is low — what's the realistic commute time and amenity access for the typical tenant pool here? Any planned neighborhood developments (good or bad) we should know about?
- What's the average days-on-market for RENTAL listings here right now (not sales)? A rising rental-DOM trend means longer vacancies and softer asking-rent achievability than the comps imply.
- What's the recent tenant-quality profile in this submarket — average credit score on applications, eviction rate, late-payment / NSF rate, and stable-employment percentage? A property-management company in the area should have these aggregated.
- How much new for-sale + rental construction is in the pipeline within 1–3 miles? Heavy new supply typically softens prices + rents 12–24 months out; constrained supply supports both.
Investment metrics
- 1% rule
- 0.82% ✗
- Cap rate
- 6.73%
- Cash-on-cash
- 1.55%
- DSCR
- 1.07
- GRM
- 10.1
CMA / ARV
- ARV (on-the-fly)
- $116,660
- Comps found
- 12
Show comp detail 12 sales within ~0.75 mi
| Address | Dist | Beds/Ba | Sqft | Sold | Price | $/sf | Match |
|---|---|---|---|---|---|---|---|
| 106 Kavanaugh St | 0.00mi | 3/1.5 (+1) | 1,228 (0%) | 0mo | $124,900 | $102 | 95 |
| 118 Kavanaugh St | 0.09mi | 2/1.0 | 1,216 (-1%) | 8mo | $29,900 | $25 | 86 |
| 414 Town And Country Ln | 0.28mi | 3/2.0 (+1) | 1,200 (-2%) | 2mo | $199,900 | $167 | 75 |
| 206 Debolt St | 0.20mi | 2/1.0 | 1,054 (-14%) | 1mo | $105,000 | $100 | 65 |
| 141 E 7th St | 0.55mi | 2/1.0 | 1,152 (-6%) | 1mo | $109,900 | $95 | 61 |
| 708 Kitty St | 0.70mi | 3/1.0 (+1) | 1,232 (+0%) | 4mo | $144,900 | $118 | 57 |
| 605 Monroe St | 0.57mi | 3/2.0 (+1) | 1,200 (-2%) | 10mo | $39,900 | $33 | 55 |
| 710 Kitty St | 0.70mi | 3/1.0 (+1) | 1,210 (-2%) | 4mo | $159,900 | $132 | 54 |
| 707 E 8th St | 0.40mi | 2/1.0 | 1,067 (-13%) | 10mo | $59,900 | $56 | 49 |
| 140 E 7th St | 0.55mi | 2/1.5 | 1,056 (-14%) | 9mo | $65,000 | $62 | 44 |
| 1704 E 8th St | 0.65mi | 3/2.0 (+1) | 1,364 (+11%) | 6mo | $69,900 | $51 | 39 |
| 1720 E 7th St | 0.63mi | 3/1.0 (+1) | 1,402 (+14%) | 4mo | $129,900 | $93 | 36 |
Match score weights: distance 35% · size 25% · config 20% · recency 20%. Top-matched comps best support the ARV.
Projected returns pro-forma
-3.0% appreciation · 3.0% rent growth · sell at horizon
- IRR
- -13.9%
- Equity multiple
- 0.50×
- Total profit
- $-17,405
- Equity at exit
- $18,623
- IRR
- -5.1%
- Equity multiple
- 0.67×
- Total profit
- $-11,626
- Equity at exit
- $10,799
Cash invested: $34,972 (down + closing). Projections, not guarantees.
Landlord ↔ Tenant lean methodology
- Overall (STATE)
- 81 Strongly Landlord-Friendly
- State Missouri
- 81 Strongly Landlord-Friendly · R+10
- County
- — inherits STATE
- City
- — inherits STATE
ZIP-level market 64683
- Home prices YoY
- -14.6%
- Active inventory
- 51
- Price-to-rent
- 10.1×
Monthly cashflow live
- Estimated rent
- $1,029 medium interval (Pro) →
- Mortgage (P&I)
- −$655
- Tax from tax record
- −$60 /mo · $726/yr
- Insurance
- −$52
- HOA
- −$0
- Vacancy / Maint / Mgmt
- −$216
- Net cashflow
- $45
Break-even live
Sensitivity live
| Price | -10% $116 | -5% $81 | +0% $45 | +5% $10 | +10% $-26 |
|---|---|---|---|---|---|
| Rent | -10% $-36 | -5% $5 | +0% $45 | +5% $86 | +10% $126 |
| Rate | -1.0pp $108 | -0.5pp $77 | base $45 | +0.5pp $13 | +1.0pp $-20 |
UW: 25.0% down · 7.5% · 30yr · 1.5% tax · 5.0% vac · 8.0% maint · 8.0% mgmt
Financing live
Cash to close
- Down payment
- $31,225
- Closing costs
- $3,747
- Reserves months
- —
- Total cash needed
- —
Loan-product check · same deal, 3 products live
Conventional
25% down · 7.5% · 30yr
- Down + closing
- —
- Monthly P&I
- —
- Monthly cashflow
- —
- DSCR
- —
- Eligible?
- —
Personal DTI + credit; lowest rate.
DSCR
20% down · 8.5% · 30yr
- Down + closing
- —
- Monthly P&I
- —
- Monthly cashflow
- —
- DSCR
- —
- Eligible?
- —
No personal income docs; deal must DSCR.
Hard money
10% down · 12.0% · 12mo
- Down + closing
- —
- Monthly P&I
- —
- Monthly cashflow
- —
- DSCR
- —
- Eligible?
- —
Short-term bridge; refi at stabilization.
Listing history 8 events
-
2026-04-22status Pending
-
2026-04-17price $124,900
-
2026-03-25status Active
-
2026-03-25price $129,900
-
2026-03-02historical
-
2025-12-15price $124,900
-
2025-10-01price $129,900
-
2025-09-02$139,900 Active
ⓘ Source: listings_history table (triggers on properties + properties_extension) + one-shot
backfill from property_details.listing_events for pre-trigger history.
Tax reassessment forecast MO · Resets to sale price
- Current annual tax
- $726 · $60/mo
- Projected year-2 tax
- $1,212 · $101/mo
- Expected delta
- +$486/yr (+$40/mo · 66.9%)
ⓘ Screening estimate from a state-policy table — verify with the county assessor before closing.
Climate risk First Street
- Flood 1/10 Low FEMA zone X (unshaded) · 0% chance over 30 yrs
- Wildfire 1/10 Low
- Heat 3/10 Moderate 7 d/yr ≥106°F today · 15 d/yr by 30 yrs out
- Wind 2/10 Low
- Air quality 2/10 Low 0 unhealthy d/yr today · 2 by 30 yrs out
Nearby sold comps map
Loading sold comps map…
Walkable amenities ~0.75 mi
Loading nearby amenities…
Taxation est. · year 1
- Rental income
- $12,345
- − Mortgage interest
- −$6,996
- − Property taxes
- −$726
- − Insurance
- −$624
- − Repairs & maintenance
- −$988
- − Management
- −$988
- − Depreciation
- −$3,633
- Taxable loss
- −$1,610
- Est. tax savings @ 24.0%
- +$387
- After-tax cash flow
- $929/yr
For passive investors: Depreciation is non-cash, so a rental often shows a tax loss while cash-flowing — sheltering income. Rental losses are passive: they offset passive income freely, and up to $25,000/yr can offset ordinary (W-2) income if you actively participate and your MAGI is under $100k (phasing out to $0 by $150k); unused losses carry forward. On sale, claimed depreciation is recaptured at up to 25%, and gains may owe capital-gains tax (a 1031 exchange can defer both). Figures are a year-1 estimate at your 24.0% rate — not tax advice; consult a CPA.
Schools (NCES district)
- District
- Trenton R-IX
- NCES district ID
- 2930360
- Math proficiency
- 28% ▼ -7.00%
- Reading proficiency
- 43% ▼ -4.00%
- Median HH income
- $37,586
- Composite
- 29.52/100
- National rank
- #6499
- State rank
- #223 of 324 in MO
Livability — Trenton
- Score
- 76/100
- State rank
- #49
- US rank
- #3686
Category grades
Schools grade is shown separately in the Schools card above.
Census & demographics
- Census place
- Trenton, MO
- City population
- 7,648
- Population (ZIP)
- 7,648
Population outlook (Grundy County) Hauer SSP2
- Today (2025)
- 9,586 people
- By 2030
- 9,298 · -3.0%
- By 2040
- 8,783 · -8.4%
- By 2050
- 8,262 · -13.8%
- By 2075
- 7,011 · -26.9%
- By 2100
- 5,650 · -41.1%
Race, ethnicity, and origin ACS 2023
- Neighborhood character
- Predominantly White (91%)
- Race & ethnicity
- White 91% Two or more races 5% Hispanic / Latino 3% Asian 1%
- Common ancestry
- Serbian 2% Portuguese 1% Slovak 1%
- Foreign-born
- 1% · China
- Languages at home
- 98% English-only · German/W. Germanic 1% Chinese 1% Spanish 1%
Political lean MEDSL · Grundy
- 2024 margin
- Solid R (+63.6) · D 17.8% · R 81.4%
- 2008→2024 swing
- -33.5pp toward R · 2008: -30.1pp · 2024: -63.6pp
- All cycles
- 2024: R+63.6 2020: R+62.8 2016: R+60.8 2012: R+41.6 2008: R+30.1
Not yet ingested
- Civics
- —
Market trends
- HPI YoY
- ▼ -32.24%
- Current HPI
- 188.2901
- Rent YoY
- —
- Metro
- —
- State GDP YoY
- ▲ 1.84%
- F500 in state
- 20
Industry mix (Fortune 500 HQ in MO)
| Industry | F500 HQs | Revenue |
|---|---|---|
| Healthcare | 1 | $163B |
|
||
| Insurance | 1 | $21B |
|
||
| Industrial Technology | 1 | $17B |
|
||
| Retail | 1 | $16B |
|
||
| Industrial Distribution | 1 | $10B |
|
||
| Utilities | 1 | $9B |
|
||
Price history
-10.7% since first listed8 events — show timeline
- 2026-04-22 Pending — Heartland MLS as Distributed by MLS Grid
- 2026-04-17 Price Changed $124,900 Heartland MLS as Distributed by MLS Grid
- 2026-03-25 Relisted — Heartland MLS as Distributed by MLS Grid
- 2026-03-25 Price Changed $129,900 Heartland MLS as Distributed by MLS Grid
- 2026-03-02 Listing Removed — Heartland MLS as Distributed by MLS Grid
- 2025-12-15 Price Changed $124,900 Heartland MLS as Distributed by MLS Grid
- 2025-10-01 Price Changed $129,900 Heartland MLS as Distributed by MLS Grid
- 2025-09-02 Listed $139,900 Heartland MLS as Distributed by MLS Grid
Property tax history
+3.5%/yrLatest (2025): $726 · +15.0% YoY. Source: county tax records.
Cash-flow waterfall
monthlySold comps — $/sqft
last 12 mo · ≤1 miLoading sold comps…