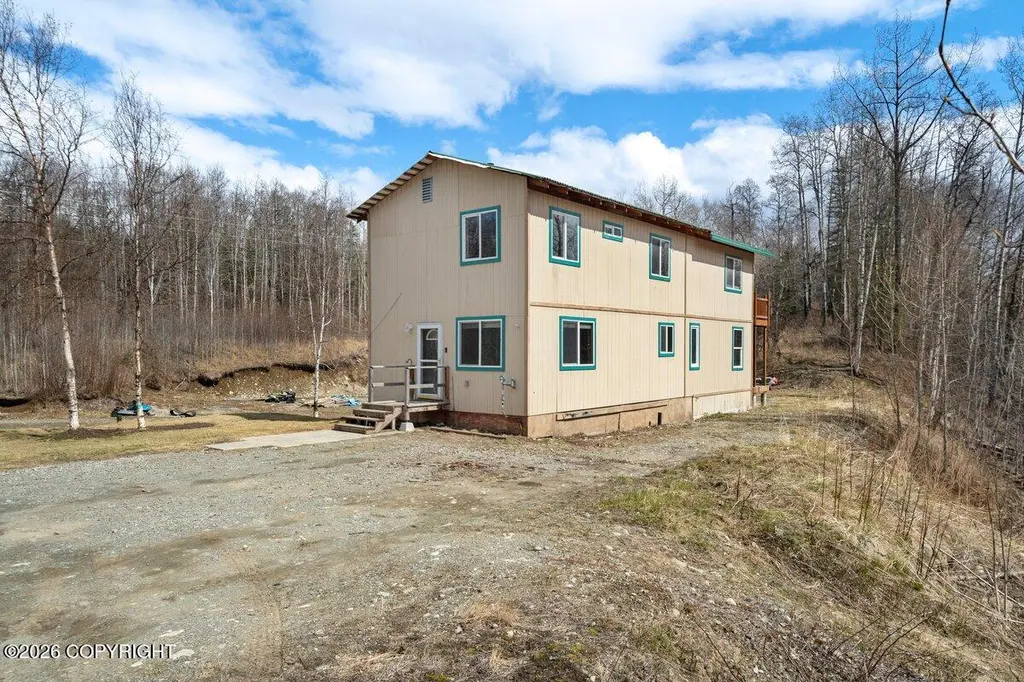
11701 E Norman Ave · Buffalo Soapstone, AK
Flood risk 1/10 · Minimal
- FEMA flood zone
- X (unshaded)
- Chance of flooding over 30 yrs
- 0.0%
- Est. flood insurance / yr
- $507 – $1,088
Fire risk No data
- Est. fire insurance / yr
- —
Heat risk No data
- Hot days now (above threshold)
- —
- Hot days in 30 yrs
- —
Wind risk No data
- Chance of severe wind over 30 yrs
- —
Air-quality risk 1/10 · Minimal
- Unhealthy air days now
- —
- Unhealthy air days in 30 yrs
- —
Risk factors via First Street. Map © Google.
Why this score? — see what drove the D grade
The composite is a weighted blend of 9 inputs, each scored 0–100. Each bar is that input's sub-score; the figure is the points it added to the 100-point composite (weight × sub-score).
- ARV discount +15.0/15.0
- Cash flow +9.6/30.0
- Schools +4.1/10.0
- 1% rule +2.9/10.0
- DSCR +2.7/10.0
- Livability +2.7/5.0
- Rent growth +2.5/5.0
- Condition / age +2.5/5.0
- Appreciation +0.0/10.0
$279,500
🖨 Deal sheet (PDF) 📄 Offer letter ✓ Due diligence
Listing remarks
Access trails right from your backyard, property backs to section line easement! Built in 2005, this 3 bed, 2 bath home offers 1,872 SF with great potential. Some updates completed while others remain. Sold AS-IS. No stove included. Enstar meter installed however natural gas has not been run into the house. Great fixer opportunity
Key facts
- 1.8 acre lot
- Built 2005
- Listed 38 days
Property features AI
Exterior
- Parking: No garage; No carport
- Utilities: Septic tank sewer
- Home design: Residential property; Detached; Built in 2005
- Construction: Wood frame construction; Other foundation; Metal roof
- Exterior features: Private yard; Gravel road access
Interior
- Bedrooms: 3 bedrooms
- Bathrooms: 2 full bathrooms
- Interior features: Garbage disposal
Neighborhood map
What this means for you Summary
Snapshot
- This is a 3-bed/2.0-bath other listed at $280k.
Deal economics
- At list price, monthly cash flow is $-191 ($-2k/yr) — negative.
- To cash-flow at today's rent, offer at most $246k (12.1% below list).
- To meet the 1% rule (rent ≥ 1% of price), the offer needs to be $221k (21.0% below list).
- Recommended offer: $221k (21.0% below list) — sets the bar for 1% rule.
Location & tenants
- Location reads 54/100 on livability (#158 in AK) — a working-class tenant base; expect higher turnover. Strengths: housing A+; Watch: health & safety C-, crime F, amenities F.
- Matanuska-Susitna Borough School District (town): math 42% / reading 50% proficiency, ranked #5 of 21 in AK (top 24%) — families likely to look elsewhere, expect single-tenant / working-renter base with shorter leases.
- Zoned schools: Swanson Elementary (406 students, 45% FRL); Palmer Middle School (math 25% / reading 42%, grade F, #24 of 36 statewide, top 69%, 594 students, 46% FRL); Palmer High School (math 32% / reading 37%, grade F, #28 of 61 statewide, top 50%, 760 students, 33% FRL).
- Zoned-school proficiency averages 34% at this address vs 46% district-wide (-12 pts) — the specific schools serving this property underperform the Matanuska-Susitna Borough School District average; the district grade overstates school quality for this exact location.
- Market conditions: 378 active listings in the ZIP; solid renter incomes; 91 units permitted in Matanuska-Susitna Borough in 2024 (25 in 5+ unit buildings).
Forward outlook
- Local home prices are declining (-3.0%/yr); year-one equity from $2k of loan paydown is wiped out by about $8k of value loss. Plan a longer hold.
- Matanuska-Susitna County population projected at +50% by 2050 — long-run rental-demand tailwind backs the buy-and-hold thesis.
Negotiation context
- It's been on market 38 days — a 3% lower offer ($271k) is reasonable based on typical stale-listing flexibility.
- 8 sale attempts since 23y ago; this cycle's ask has dropped $60k (18%) from the opening price — seller is motivated, your offer sets the floor, not the list.
Questions for the listing agent
- What do current leases actually rent for vs. the listed asking? Can we see a recent rent roll and the last 12 months of T-12 income?
- It's been on market 38 days. Have you received any prior offers? Is the seller open to a 21% concession, seller financing, or rate buy-down credit?
- Is there a deadline driving the sale (1031 exchange, divorce, estate, relocation)? That informs how much negotiation room exists.
- Schools are F-rated, which usually means shorter tenancies and higher turnover. Who's the typical renter profile here, and what's been the actual vacancy rate?
- Crime grade is F in this area — have there been break-ins, vandalism, or insurance claims at this property in the last 3 years? What carrier currently insures it and at what premium?
- The area grade is low — what's the realistic commute time and amenity access for the typical tenant pool here? Any planned neighborhood developments (good or bad) we should know about?
- What's the average days-on-market for RENTAL listings here right now (not sales)? A rising rental-DOM trend means longer vacancies and softer asking-rent achievability than the comps imply.
- What's the recent tenant-quality profile in this submarket — average credit score on applications, eviction rate, late-payment / NSF rate, and stable-employment percentage? A property-management company in the area should have these aggregated.
- How much new for-sale + rental construction is in the pipeline within 1–3 miles? Heavy new supply typically softens prices + rents 12–24 months out; constrained supply supports both.
Investment metrics
- 1% rule
- 0.79% ✗
- Cap rate
- 5.47%
- Cash-on-cash
- -2.93%
- DSCR
- 0.87
- GRM
- 10.6
CMA / ARV
- ARV (median comp)
- $533,924
- List price
- $279,500
- Delta
- -47.65%
- Verdict
- UNDERPRICED
- Comps
- 18 within 2.0 mi
Projected returns pro-forma
-3.0% appreciation · 3.0% rent growth · sell at horizon
- IRR
- -21.2%
- Equity multiple
- 0.27×
- Total profit
- $-57,436
- Equity at exit
- $41,674
- IRR
- -14.6%
- Equity multiple
- 0.16×
- Total profit
- $-65,555
- Equity at exit
- $24,166
Cash invested: $78,260 (down + closing). Projections, not guarantees.
Landlord ↔ Tenant lean methodology
- Overall (STATE)
- 80 Strongly Landlord-Friendly
- State Alaska
- 80 Strongly Landlord-Friendly · R+8
- County
- — inherits STATE
- City
- — inherits STATE
ZIP-level market 99645
- Home prices YoY
- -22.8%
- Active inventory
- 378
- Price-to-rent
- 10.6×
Monthly cashflow live
- Estimated rent
- $2,207 medium interval (Pro) →
- Mortgage (P&I)
- −$1,466
- Tax from tax record
- −$353 /mo · $4,231/yr
- Insurance
- −$116
- HOA
- −$0
- Vacancy / Maint / Mgmt
- −$463
- Net cashflow
- $-191
Break-even live
Sensitivity live
| Price | -10% $-33 | -5% $-112 | +0% $-191 | +5% $-270 | +10% $-349 |
|---|---|---|---|---|---|
| Rent | -10% $-366 | -5% $-278 | +0% $-191 | +5% $-104 | +10% $-17 |
| Rate | -1.0pp $-50 | -0.5pp $-120 | base $-191 | +0.5pp $-264 | +1.0pp $-337 |
UW: 25.0% down · 7.5% · 30yr · 1.5% tax · 5.0% vac · 8.0% maint · 8.0% mgmt
Financing live
Cash to close
- Down payment
- $69,875
- Closing costs
- $8,385
- Reserves months
- —
- Total cash needed
- —
Loan-product check · same deal, 3 products live
Conventional
25% down · 7.5% · 30yr
- Down + closing
- —
- Monthly P&I
- —
- Monthly cashflow
- —
- DSCR
- —
- Eligible?
- —
Personal DTI + credit; lowest rate.
DSCR
20% down · 8.5% · 30yr
- Down + closing
- —
- Monthly P&I
- —
- Monthly cashflow
- —
- DSCR
- —
- Eligible?
- —
No personal income docs; deal must DSCR.
Hard money
10% down · 12.0% · 12mo
- Down + closing
- —
- Monthly P&I
- —
- Monthly cashflow
- —
- DSCR
- —
- Eligible?
- —
Short-term bridge; refi at stabilization.
Listing history 30 events
-
2026-06-22days on market $279,500 Active 38 DOM
-
2026-06-18days on market $279,500 Active 35 DOM
-
2026-06-17days on market $279,500 Active 34 DOM
-
2026-06-16pricedays on market $279,500 Active 33 DOM
-
2026-06-15days on market $299,000 Active 32 DOM
-
2026-06-14days on market $299,000 Active 30 DOM
-
2026-06-13days on market $299,000 Active 29 DOM
-
2026-06-10pricedays on market $299,000 Active 27 DOM
-
2026-06-09days on market $320,000 Active 26 DOM
-
2026-06-08days on market $320,000 Active 25 DOM
-
2026-06-07days on market $320,000 Active 24 DOM
-
2026-06-03days on market $320,000 Active 20 DOM
-
2026-06-02days on market $320,000 Active 19 DOM
-
2026-06-01days on market $320,000 Active 18 DOM
-
2026-05-31days on market $320,000 Active 17 DOM
-
2026-05-30days on market $320,000 Active 16 DOM
-
2026-05-14$340,000 Active 371-char remark
-
2019-03-21soldstatus
-
2018-07-16$165,000
-
2016-10-11$200,000
-
2011-05-25soldstatus
-
2008-05-01soldstatus
-
2007-11-16$28,000
-
2006-07-26$39,000
-
2005-09-23$35,000
-
2005-08-03soldstatus
-
2005-05-12$28,000
-
2005-01-27soldstatus
-
2004-04-06soldstatus
-
2003-04-03$12,500
ⓘ Source: listings_history table (triggers on properties + properties_extension) + one-shot
backfill from property_details.listing_events for pre-trigger history.
Tax reassessment forecast AK · Partial reset (capped growth)
- Current annual tax
- $4,231 · $353/mo
- Projected year-2 tax
- $4,231 · $353/mo
- Expected delta
- $0/yr ($0/mo · 0.0%)
ⓘ Screening estimate from a state-policy table — verify with the county assessor before closing.
Climate risk First Street
- Flood 1/10 Low FEMA zone X (unshaded) · 0% chance over 30 yrs
- Air quality 1/10 Low
Nearby sold comps map
Loading sold comps map…
Walkable amenities ~0.75 mi
Loading nearby amenities…
Taxation est. · year 1
- Rental income
- $26,484
- − Mortgage interest
- −$15,656
- − Property taxes
- −$4,231
- − Insurance
- −$1,398
- − Repairs & maintenance
- −$2,119
- − Management
- −$2,119
- − Depreciation
- −$8,131
- Taxable loss
- −$7,169
- Est. tax savings @ 24.0%
- +$1,721
- After-tax cash flow
- $-574/yr
For passive investors: Depreciation is non-cash, so a rental often shows a tax loss while cash-flowing — sheltering income. Rental losses are passive: they offset passive income freely, and up to $25,000/yr can offset ordinary (W-2) income if you actively participate and your MAGI is under $100k (phasing out to $0 by $150k); unused losses carry forward. On sale, claimed depreciation is recaptured at up to 25%, and gains may owe capital-gains tax (a 1031 exchange can defer both). Figures are a year-1 estimate at your 24.0% rate — not tax advice; consult a CPA.
Schools (NCES district)
- District
- Matanuska-Susitna Borough School District
- NCES district ID
- 0200510
- Math proficiency
- 42% ▲ 1.00%
- Reading proficiency
- 50% ▲ 5.00%
- Median HH income
- $70,325
- Composite
- 41.38/100
- National rank
- #3484
- State rank
- #5 of 21 in AK
Livability — Buffalo Soapstone
- Score
- 54/100
- State rank
- #158
- US rank
- #23784
Category grades
Schools grade is shown separately in the Schools card above.
Census & demographics
- Census place
- Buffalo Soapstone, AK
- County
- Matanuska Susitna Borough · 100,174 people
- Metro
- Anchorage, AK
- Population (ZIP)
- 32,103
- Household income
- $100,455
- Rent vs Own
- Severe rent burden
- 539.0
Population outlook (Matanuska-Susitna County) Hauer SSP2
- Today (2025)
- 126,730 people
- By 2030
- 139,641 · +10.2%
- By 2040
- 165,122 · +30.3%
- By 2050
- 189,697 · +49.7%
- By 2075
- 249,959 · +97.2%
- By 2100
- 288,077 · +127.3%
Race, ethnicity, and origin ACS 2023
- Neighborhood character
- Predominantly White (75%)
- Race & ethnicity
- White 75% Two or more races 11% Hispanic / Latino 6% Native American 6% Black 1% Asian 1%
- Hispanic origin (detail)
- Mexican 4%
- Common ancestry
- Portuguese 4% Slovak 2% Italian 2%
- Foreign-born
- 3% · Canada
- Languages at home
- 95% English-only · Spanish 2%
Political lean MEDSL · Matanuska-Susitna
- 2016 margin
- R (+15.2) · D 37.7% · R 52.9% · Other 9.4%
- All cycles
- 2016: R+15.2
Not yet ingested
- Civics
- —
Market trends
- HPI YoY
- ▼ -62.20%
- Current HPI
- 210.5448
- Rent YoY
- —
- Metro
- Anchorage, AK
- State GDP YoY
- —
- F500 in state
- 0
Price history
+2136.0% since first listed17 events — show timeline
- 2026-06-16 Price Changed $279,500 AKMLS
- 2026-06-09 Price Changed $299,000 AKMLS
- 2026-05-27 Price Changed $320,000 AKMLS
- 2026-05-14 Listed $340,000 AKMLS
- 2019-03-21 Sold (Public Records) — Public Records
- 2018-07-16 Listed $165,000 AKMLS
- 2016-10-11 Listed $200,000 AKMLS
- 2011-05-25 Sold (Public Records) — Public Records
- 2008-05-01 Sold (Public Records) — Public Records
- 2007-11-16 Listed $28,000 AKMLS
- 2006-07-26 Listed $39,000 AKMLS
- 2005-09-23 Listed $35,000 AKMLS
- 2005-08-03 Sold (Public Records) — Public Records
- 2005-05-12 Listed $28,000 AKMLS
- 2005-01-27 Sold (Public Records) — Public Records
- 2004-04-06 Sold (Public Records) — Public Records
- 2003-04-03 Listed $12,500 AKMLS
Property tax history
+14.4%/yrLatest (2025): $4,231 · +2.3% YoY. Source: county tax records.
Cash-flow waterfall
monthlySold comps — $/sqft
last 12 mo · ≤1 miLoading sold comps…