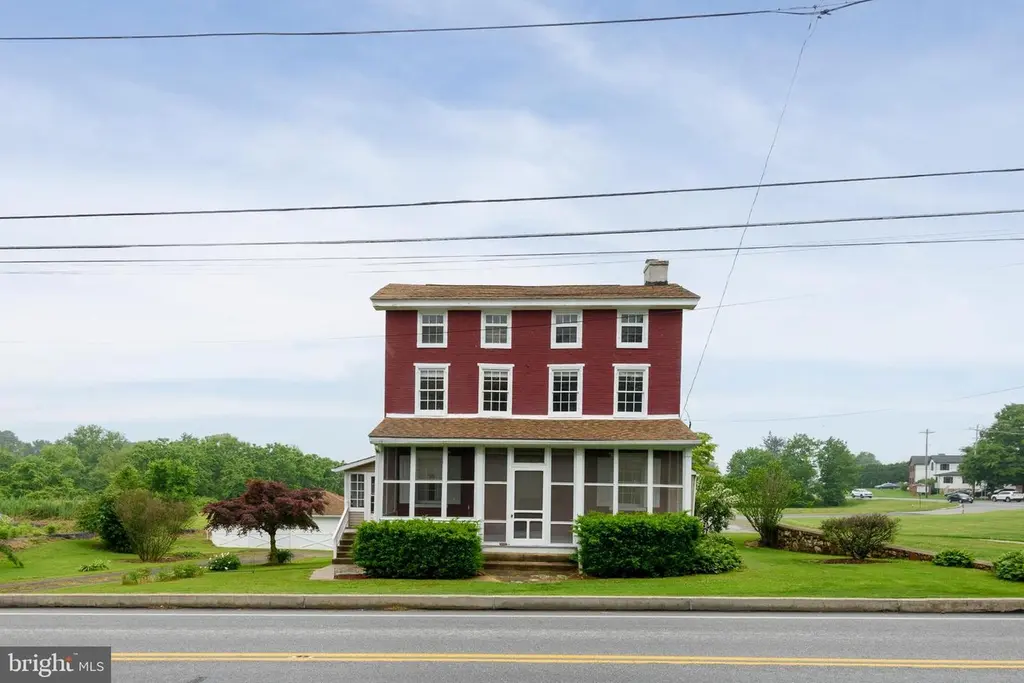
808 W Baltimore Pike · West Grove, PA
Flood risk 1/10 · Minimal
- FEMA flood zone
- X (unshaded)
- Chance of flooding over 30 yrs
- 0.0%
- Est. flood insurance / yr
- $473 – $860
Fire risk 1/10 · Minimal
- Est. fire insurance / yr
- $511 – $949
Heat risk 6/10 · Moderate
- Hot days now (above 101°F)
- 7 days/yr
- Hot days in 30 yrs
- 15 days/yr
Wind risk 6/10 · Moderate
- Chance of severe wind over 30 yrs
- 27.0%
Air-quality risk 2/10 · Minimal
- Unhealthy air days now
- 1 days/yr
- Unhealthy air days in 30 yrs
- 3 days/yr
Risk factors via First Street. Map © Google.
Why this score? — see what drove the D grade
The composite is a weighted blend of 9 inputs, each scored 0–100. Each bar is that input's sub-score; the figure is the points it added to the 100-point composite (weight × sub-score).
- Cash flow +14.0/30.0
- ARV discount +7.5/15.0
- Schools +5.3/10.0
- DSCR +4.3/10.0
- Livability +4.0/5.0
- 1% rule +3.6/10.0
- Rent growth +2.5/5.0
- Condition / age +2.5/5.0
- Appreciation +0.0/10.0
$349,900
🖨 Deal sheet (PDF) 📄 Offer letter ✓ Due diligence
Listing remarks
Welcome to 808 W. Baltimore Pike in West Grove, Pennsylvania a charming turn-of-the-century solid brick residence ideally situated in Jennersville Village and adjacent to the historic Red Rose Inn. Rich in character and timeless appeal, this spacious home offers classic architectural details, generous living space, and the opportunity to blend historic charm with modern updates. A screened front porch welcomes you into the traditional center hall layout, flanked by a formal living room and formal dining room, both offering the warmth and character expected from a home of this era. Toward the rear of the home, the country kitchen features vintage metal cabinetry in remarkably good condition,
Key facts
- Screened front porch
- Country kitchen
- First-floor den
Tags
Property features AI
Finance
- Other: Fee simple ownership; Year built reported by assessor
Exterior
- Parking: Front-entry garage; Two garage spaces (detached); Driveway with four parking spaces; Total of six garage and parking spaces
- Utilities: Well water source; On-site septic sewer; Electric service
- Home design: Detached structure
- Construction: Brick construction; Permanent foundation; Above-grade and below-grade structures
- Exterior features: Well water; On-site septic
Interior
- Kitchen: Kitchen
- Bedrooms: Three bedrooms on the first upper level; Three bedrooms on the second upper level; Total of six bedrooms
- Bathrooms: One full bathroom
- Heating & cooling: Hot water heating; Oil-fired heating; Electric hot water
- Interior features: Full basement; Living room; Dining room; Den
- Laundry & utility: Laundry in basement
Neighborhood map
What this means for you Summary
Snapshot
- This is a 6-bed/1.0-bath single-family listed at $350k.
Deal economics
- At list price, monthly cash flow is $48 ($575/yr) — positive.
- The deal already cash-flows at list — no discount required.
- To meet the 1% rule (rent ≥ 1% of price), the offer needs to be $302k (13.7% below list).
- Recommended offer: $302k (13.7% below list) — sets the bar for 1% rule.
- Cap rate 6.5% vs local median 1.8% in West Grove — top-decile yield for the area; either an underpriced asset or a hidden risk that comps aren't pricing in. Stress-test before assuming the spread holds.
Location & tenants
- Location reads 81/100 on livability (#183 in PA, #1,542 nationally) — a professional / high-income tenant draw. Strengths: crime A+, housing A+, employment A; Watch: amenities F, commute F.
- Avon Grove SD (suburban): math 54% / reading 61% proficiency, ranked #63 of 539 in PA (top 12%) — acceptable for families but not a draw, mixed tenant base, ~2y average lease.
- Zoned schools: Avon Grove Intrmd Sch (math 48% / reading 58%, grade C, #571 of 1,518 statewide, top 38%, 1,457 students, 32% FRL); Fred S Engle Ms (math 49% / reading 69%, grade B, #50 of 512 statewide, top 10%, 819 students, 30% FRL); Avon Grove Hs (math 80% / reading 24%, grade C-, #112 of 437 statewide, top 26%, 1,747 students, 24% FRL).
- Market conditions: 73 active listings in the ZIP; 1,513 units permitted in Chester County in 2024 (354 in 5+ unit buildings).
Forward outlook
- Local home prices are declining (-3.0%/yr); year-one equity from $2k of loan paydown is wiped out by about $10k of value loss. Plan a longer hold.
- Chester County population projected at +6% by 2050 — modest demand growth; plan on rents tracking national, not racing it.
Negotiation context
- It's been on market 21 days — a 2% lower offer ($345k) is reasonable based on typical stale-listing flexibility.
Risks & watch-outs
- Watch-outs: built in 1900 — expect roof / HVAC / electrical / plumbing capex.
- Climate carrying-cost: major wind risk, 27% chance of damaging wind over 30y; extreme-heat days projected 7→15/yr by 2055 (HVAC capex compounding) — expect insurance premiums to compound above CPI over the hold.
Questions for the listing agent
- Built in 1900 — when were the roof, HVAC, electrical panel, plumbing, and water heater last replaced?
- Is there a deadline driving the sale (1031 exchange, divorce, estate, relocation)? That informs how much negotiation room exists.
- Schools are B-rated — typically a magnet for longer-tenancy family renters. What's the average tenant stay here, and is there a school-zone premium baked into asking?
- The area grade is low — what's the realistic commute time and amenity access for the typical tenant pool here? Any planned neighborhood developments (good or bad) we should know about?
- What's the average days-on-market for RENTAL listings here right now (not sales)? A rising rental-DOM trend means longer vacancies and softer asking-rent achievability than the comps imply.
- What's the recent tenant-quality profile in this submarket — average credit score on applications, eviction rate, late-payment / NSF rate, and stable-employment percentage? A property-management company in the area should have these aggregated.
- How much new for-sale + rental construction is in the pipeline within 1–3 miles? Heavy new supply typically softens prices + rents 12–24 months out; constrained supply supports both.
Investment metrics
- 1% rule
- 0.86% ✗
- Cap rate
- 6.46%
- Cash-on-cash
- 0.59%
- DSCR
- 1.03
- GRM
- 9.7
CMA / ARV
No comps found within radius.
Projected returns pro-forma
-3.0% appreciation · 3.0% rent growth · sell at horizon
- IRR
- -15.4%
- Equity multiple
- 0.45×
- Total profit
- $-53,650
- Equity at exit
- $52,171
- IRR
- -6.8%
- Equity multiple
- 0.56×
- Total profit
- $-42,804
- Equity at exit
- $30,253
Cash invested: $97,972 (down + closing). Projections, not guarantees.
Landlord ↔ Tenant lean methodology
- Overall (STATE)
- 62 Landlord-Friendly
- State Pennsylvania
- 62 Landlord-Friendly · EVEN
- County
- — inherits STATE
- City
- — inherits STATE
ZIP-level market 19390
- Home prices YoY
- -27.7%
- Active inventory
- 73
- Price-to-rent
- 9.7×
Monthly cashflow live
- Estimated rent
- $3,019 medium interval (Pro) →
- Mortgage (P&I)
- −$1,835
- Tax from tax record
- −$356 /mo · $4,274/yr
- Insurance
- −$146
- HOA
- −$0
- Vacancy / Maint / Mgmt
- −$634
- Net cashflow
- $48
Break-even live
Sensitivity live
| Price | -10% $246 | -5% $147 | +0% $48 | +5% $-51 | +10% $-150 |
|---|---|---|---|---|---|
| Rent | -10% $-191 | -5% $-71 | +0% $48 | +5% $167 | +10% $286 |
| Rate | -1.0pp $224 | -0.5pp $137 | base $48 | +0.5pp $-43 | +1.0pp $-135 |
UW: 25.0% down · 7.5% · 30yr · 1.5% tax · 5.0% vac · 8.0% maint · 8.0% mgmt
Financing live
Cash to close
- Down payment
- $87,475
- Closing costs
- $10,497
- Reserves months
- —
- Total cash needed
- —
Loan-product check · same deal, 3 products live
Conventional
25% down · 7.5% · 30yr
- Down + closing
- —
- Monthly P&I
- —
- Monthly cashflow
- —
- DSCR
- —
- Eligible?
- —
Personal DTI + credit; lowest rate.
DSCR
20% down · 8.5% · 30yr
- Down + closing
- —
- Monthly P&I
- —
- Monthly cashflow
- —
- DSCR
- —
- Eligible?
- —
No personal income docs; deal must DSCR.
Hard money
10% down · 12.0% · 12mo
- Down + closing
- —
- Monthly P&I
- —
- Monthly cashflow
- —
- DSCR
- —
- Eligible?
- —
Short-term bridge; refi at stabilization.
Listing history 16 events
-
2026-06-18status $349,900 Pending 21 DOM
-
2026-06-18days on market $349,900 Active 21 DOM
-
2026-06-17days on market $349,900 Active 20 DOM
-
2026-06-16days on market $349,900 Active 19 DOM
-
2026-06-15days on market $349,900 Active 18 DOM
-
2026-06-13days on market $349,900 Active 16 DOM
-
2026-06-13days on market $349,900 Active 15 DOM
-
2026-06-09days on market $349,900 Active 12 DOM
-
2026-06-08days on market $349,900 Active 11 DOM
-
2026-06-07days on market $349,900 Active 10 DOM
-
2026-06-04days on market $349,900 Active 7 DOM
-
2026-06-03days on market $349,900 Active 6 DOM
-
2026-06-02days on market $349,900 Active 5 DOM
-
2026-06-01days on market $349,900 Active 4 DOM
-
2026-05-31days on market $349,900 Active 3 DOM
-
2026-05-28$349,900 Active
ⓘ Source: listings_history table (triggers on properties + properties_extension) + one-shot
backfill from property_details.listing_events for pre-trigger history.
Tax reassessment forecast PA · Partial reset (capped growth)
- Current annual tax
- $4,274 · $356/mo
- Projected year-2 tax
- $4,901 · $408/mo
- Expected delta
- +$627/yr (+$52/mo · 14.7%)
ⓘ Screening estimate from a state-policy table — verify with the county assessor before closing.
Climate risk First Street
- Flood 1/10 Low FEMA zone X (unshaded) · 0% chance over 30 yrs
- Wildfire 1/10 Low
- Heat 6/10 Major 7 d/yr ≥101°F today · 15 d/yr by 30 yrs out
- Wind 6/10 Major 27% chance of damaging wind over 30 yrs
- Air quality 2/10 Low 1 unhealthy d/yr today · 3 by 30 yrs out
Nearby sold comps map
Loading sold comps map…
Walkable amenities ~0.75 mi
Loading nearby amenities…
Taxation est. · year 1
- Rental income
- $36,225
- − Mortgage interest
- −$19,600
- − Property taxes
- −$4,274
- − Insurance
- −$1,750
- − Repairs & maintenance
- −$2,898
- − Management
- −$2,898
- − Depreciation
- −$10,179
- Taxable loss
- −$5,373
- Est. tax savings @ 24.0%
- +$1,290
- After-tax cash flow
- $1,865/yr
For passive investors: Depreciation is non-cash, so a rental often shows a tax loss while cash-flowing — sheltering income. Rental losses are passive: they offset passive income freely, and up to $25,000/yr can offset ordinary (W-2) income if you actively participate and your MAGI is under $100k (phasing out to $0 by $150k); unused losses carry forward. On sale, claimed depreciation is recaptured at up to 25%, and gains may owe capital-gains tax (a 1031 exchange can defer both). Figures are a year-1 estimate at your 24.0% rate — not tax advice; consult a CPA.
Schools (NCES district)
- District
- Avon Grove SD
- NCES district ID
- 4202790
- Math proficiency
- 54% ▼ -13.00%
- Reading proficiency
- 61% ▼ -15.00%
- Median HH income
- $90,335
- Composite
- 52.84/100
- National rank
- #1536
- State rank
- #63 of 539 in PA
Livability — West Grove
- Score
- 81/100
- State rank
- #183
- US rank
- #1542
Category grades
Schools grade is shown separately in the Schools card above.
Census & demographics
- Population (ZIP)
- 12,049
Population outlook (Chester County) Hauer SSP2
- Today (2025)
- 546,756 people
- By 2030
- 559,441 · +2.3%
- By 2040
- 576,377 · +5.4%
- By 2050
- 580,602 · +6.2%
- By 2075
- 581,575 · +6.4%
- By 2100
- 540,922 · -1.1%
Race, ethnicity, and origin ACS 2023
- Neighborhood character
- Predominantly White (72%)
- Race & ethnicity
- White 72% Hispanic / Latino 17% Two or more races 9% Asian 5% Black 2%
- Hispanic origin (detail)
- Mexican 14% Puerto Rican 1%
- Common ancestry
- Romanian 4% Italian 3% Slovak 2%
- Foreign-born
- 9% · Canada, Vietnam, China
- Languages at home
- 86% English-only · Spanish 10% Other Asian/Pacific 1% Other Indo-European 1%
Political lean MEDSL · Chester
- 2024 margin
- D (+14.5) · D 56.7% · R 42.2% · Other 1.0%
- 2008→2024 swing
- +5.2pp toward D · 2008: 9.2pp · 2024: 14.5pp
- All cycles
- 2024: D+14.5 2020: D+17.0 2016: D+9.2 2012: R+0.4 2008: D+9.2
Not yet ingested
- Civics
- —
Market trends
- HPI YoY
- ▼ -102.59%
- Current HPI
- 268.0284
- Rent YoY
- —
- Metro
- —
- State GDP YoY
- ▲ 1.68%
- F500 in state
- 34
Industry mix (Fortune 500 HQ in PA)
| Industry | F500 HQs | Revenue |
|---|---|---|
| Healthcare | 2 | $309B |
|
||
| Insurance | 2 | $27B |
|
||
| Telecommunications / Media | 1 | $124B |
|
||
| Industrial Distribution | 1 | $22B |
|
||
| Financial Services | 1 | $20B |
|
||
| Chemicals / Materials | 1 | $18B |
|
||
Price history
1 event — show timeline
- 2026-05-28 Listed $349,900 BRIGHT MLS
Property tax history
+2.4%/yrLatest (2026): $4,274 · +2.6% YoY. Source: county tax records.
Cash-flow waterfall
monthlySold comps — $/sqft
last 12 mo · ≤1 miLoading sold comps…