1270 Hatton School Rd · Leighton, AL
Flood risk 1/10 · Minimal
- FEMA flood zone
- X (unshaded)
- Chance of flooding over 30 yrs
- 0.0%
- Est. flood insurance / yr
- $507 – $1,088
Fire risk 2/10 · Minimal
- Est. fire insurance / yr
- $916 – $1,700
Heat risk 6/10 · Moderate
- Hot days now (above 107°F)
- 7 days/yr
- Hot days in 30 yrs
- 20 days/yr
Wind risk 6/10 · Moderate
- Chance of severe wind over 30 yrs
- 27.0%
Air-quality risk 2/10 · Minimal
- Unhealthy air days now
- 0 days/yr
- Unhealthy air days in 30 yrs
- 1 days/yr
Risk factors via First Street. Map © Google.
Why this score? — see what drove the D grade
The composite is a weighted blend of 9 inputs, each scored 0–100. Each bar is that input's sub-score; the figure is the points it added to the 100-point composite (weight × sub-score).
- ARV discount +15.0/15.0
- Appreciation +7.6/10.0
- Cash flow +6.9/30.0
- Livability +2.6/5.0
- Rent growth +2.5/5.0
- Condition / age +2.5/5.0
- Schools +2.1/10.0
- DSCR +1.1/10.0
- 1% rule +0.4/10.0
$225,000
🖨 Deal sheet (PDF) 📄 Offer letter ✓ Due diligence
Listing remarks
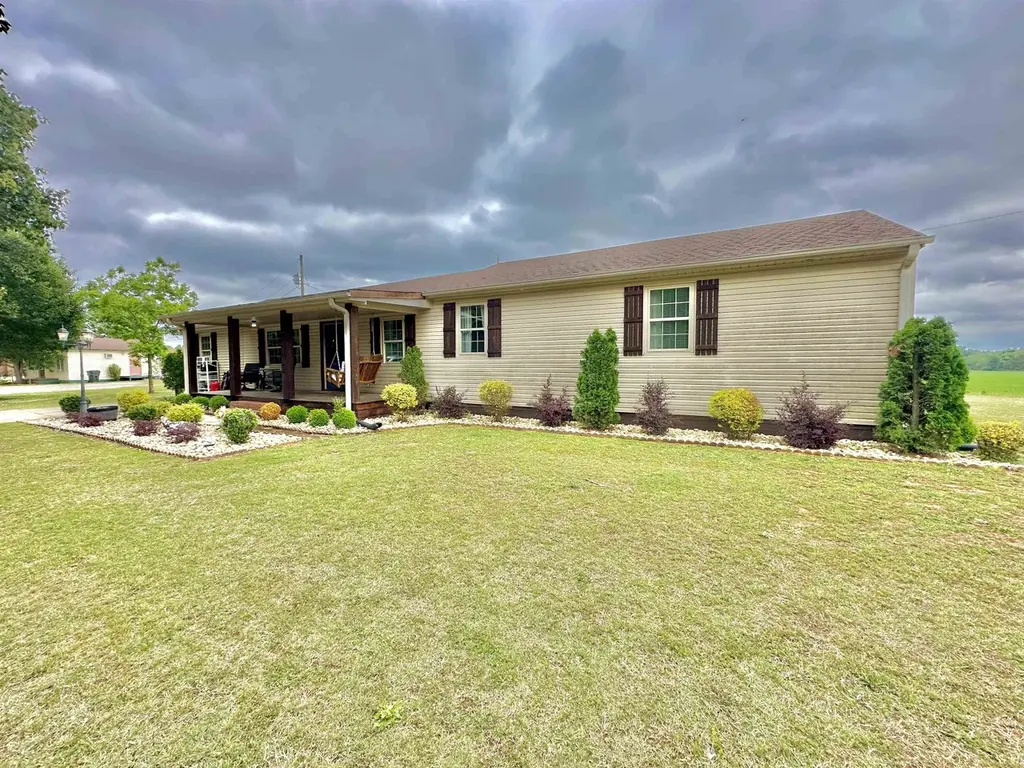
Welcome to this recently updated 4-bedroom, 2-bathroom home situated on approximately 1 acre in Leighton, Alabama. Offering around 1,700 square feet of living space, this property combines comfort, functionality, and recent improvements that make it move-in ready. Recent updates include a fresh coat of paint, new flooring, an expanded closet in one of the bedrooms and a new roof installed on both the home and outdoor storage shed. This property also includes an outdoor storage shed/workshop and a spacious, level yard with plenty of room to enjoy outdoor living. The covered back porch provides the perfect space for relaxing or entertaining guests year-round. The home now qualifies for FHA, U
Key facts
- Shed
- Extra storage
- 1 acre lot
Tags
Property features AI
Exterior
- Utilities: Septic tank
- Home design: Single-family residential property; Seller indicates fixer condition
- Construction: Vinyl siding; Shingle roof
- Exterior features: Covered patio/porch; Deck; Front porch; Porch; Back yard; Cleared lot with few trees; Asphalt-paved road frontage on a county road
Interior
- Kitchen: Dishwasher; Electric range
- Bedrooms: Four main-level bedrooms
- Flooring: Ceramic tile; Hardwood
- Bathrooms: Two full bathrooms (both on the main level)
- Heating & cooling: Central heating; Central air conditioning
- Interior features: Walk-in closets; Master suite on the main level; Living room fireplace
- Laundry & utility: Separate laundry room
Neighborhood map
What this means for you Summary
Snapshot
- This is a 4-bed/2.0-bath single-family listed at $225k.
Deal economics
- At list price, monthly cash flow is $-345 ($-4k/yr) — negative.
- To cash-flow at today's rent, offer at most $164k (27.1% below list).
- To meet the 1% rule (rent ≥ 1% of price), the offer needs to be $123k (45.5% below list).
- Recommended offer: $123k (45.5% below list) — sets the bar for 1% rule.
Location & tenants
- Location reads 52/100 on livability (#500 in AL) — a working-class tenant base; expect higher turnover. Strengths: cost of living A+; Watch: crime F, amenities F, commute F.
- Colbert County (rural): math 13% / reading 38% proficiency, ranked #90 of 129 in AL (top 70%) — low school quality limits family demand, transient renter base, plan for 1-2y turnover.
- Zoned schools: Hatton Elementary School (math 17% / reading 37%, grade F, #392 of 627 statewide, top 65%, 242 students, 72% FRL); Colbert County High School (math 5% / reading 32%, grade F, #184 of 305 statewide, top 61%, 455 students, 43% FRL) — zoned schools at 57% FRL track the district average.
- Market conditions: 29 active listings in the ZIP; 91 units permitted in Colbert County in 2024 (0 in 5+ unit buildings).
Forward outlook
- In year one you build about $13k of equity ($2k loan paydown + $12k appreciation (5.3% local appreciation)).
- Colbert County population projected to shrink 7% by 2050 — rents likely to lag national; underwrite the cash flow, not the appreciation.
- By year 3, paydown + projected appreciation supports a ~$33k cash-out refi (75% LTV) — recoverable capital for the next deal without selling this one.
Negotiation context
- It's been on market 53 days — a 3% lower offer ($218k) is reasonable based on typical stale-listing flexibility.
- 5 sale attempts since 16y ago; this cycle's ask is 25% above the opening price — seller raised mid-cycle; expect resistance to lowballs.
- Current owner paid $160k; 41% above their basis — modest negotiation headroom, anchor on the comps not their cost.
Risks & watch-outs
- Climate carrying-cost: major wind risk, 27% chance of damaging wind over 30y; extreme-heat days projected 7→20/yr by 2055 (HVAC capex compounding) — expect insurance premiums to compound above CPI over the hold.
Questions for the listing agent
- What do current leases actually rent for vs. the listed asking? Can we see a recent rent roll and the last 12 months of T-12 income?
- It's been on market 53 days. Have you received any prior offers? Is the seller open to a 46% concession, seller financing, or rate buy-down credit?
- Built in 1968 — when were the roof, HVAC, electrical panel, plumbing, and water heater last replaced?
- Is there a deadline driving the sale (1031 exchange, divorce, estate, relocation)? That informs how much negotiation room exists.
- Schools are F-rated, which usually means shorter tenancies and higher turnover. Who's the typical renter profile here, and what's been the actual vacancy rate?
- Crime grade is F in this area — have there been break-ins, vandalism, or insurance claims at this property in the last 3 years? What carrier currently insures it and at what premium?
- The area grade is low — what's the realistic commute time and amenity access for the typical tenant pool here? Any planned neighborhood developments (good or bad) we should know about?
- What's the average days-on-market for RENTAL listings here right now (not sales)? A rising rental-DOM trend means longer vacancies and softer asking-rent achievability than the comps imply.
- What's the recent tenant-quality profile in this submarket — average credit score on applications, eviction rate, late-payment / NSF rate, and stable-employment percentage? A property-management company in the area should have these aggregated.
- How much new for-sale + rental construction is in the pipeline within 1–3 miles? Heavy new supply typically softens prices + rents 12–24 months out; constrained supply supports both.
Investment metrics
- 1% rule
- 0.54% ✗
- Cap rate
- 4.45%
- Cash-on-cash
- -6.57%
- DSCR
- 0.71
- GRM
- 15.3
CMA / ARV
- ARV (median comp)
- $274,502
- List price
- $225,000
- Delta
- -18.03%
- Verdict
- UNDERPRICED
- Comps
- 12 within 2.0 mi
Projected returns pro-forma
5.26% appreciation · 3.0% rent growth · sell at horizon
- IRR
- 8.0%
- Equity multiple
- 1.53×
- Total profit
- $33,117
- Equity at exit
- $131,072
- IRR
- 9.8%
- Equity multiple
- 2.86×
- Total profit
- $117,376
- Equity at exit
- $229,219
Cash invested: $63,000 (down + closing). Projections, not guarantees.
Landlord ↔ Tenant lean methodology
- Overall (STATE)
- 90 Strongly Landlord-Friendly
- State Alabama
- 90 Strongly Landlord-Friendly · R+15
- County
- — inherits STATE
- City
- — inherits STATE
ZIP-level market 35646
- Home prices YoY
- 3.6%
- Active inventory
- 29
- Price-to-rent
- 15.3×
Monthly cashflow live
- Estimated rent
- $1,225 medium interval (Pro) →
- Mortgage (P&I)
- −$1,180
- Tax from tax record
- −$39 /mo · $471/yr
- Insurance
- −$94
- HOA
- −$0
- Vacancy / Maint / Mgmt
- −$257
- Net cashflow
- $-345
Break-even live
Sensitivity live
| Price | -10% $-218 | -5% $-281 | +0% $-345 | +5% $-665 | +10% $-742 |
|---|---|---|---|---|---|
| Rent | -10% $-442 | -5% $-393 | +0% $-345 | +5% $-296 | +10% $-248 |
| Rate | -1.0pp $-232 | -0.5pp $-288 | base $-345 | +0.5pp $-403 | +1.0pp $-463 |
UW: 25.0% down · 7.5% · 30yr · 1.5% tax · 5.0% vac · 8.0% maint · 8.0% mgmt
Financing live
Cash to close
- Down payment
- $56,250
- Closing costs
- $6,750
- Reserves months
- —
- Total cash needed
- —
Loan-product check · same deal, 3 products live
Conventional
25% down · 7.5% · 30yr
- Down + closing
- —
- Monthly P&I
- —
- Monthly cashflow
- —
- DSCR
- —
- Eligible?
- —
Personal DTI + credit; lowest rate.
DSCR
20% down · 8.5% · 30yr
- Down + closing
- —
- Monthly P&I
- —
- Monthly cashflow
- —
- DSCR
- —
- Eligible?
- —
No personal income docs; deal must DSCR.
Hard money
10% down · 12.0% · 12mo
- Down + closing
- —
- Monthly P&I
- —
- Monthly cashflow
- —
- DSCR
- —
- Eligible?
- —
Short-term bridge; refi at stabilization.
Listing history 25 events
-
2026-06-21days on market $225,000 Active 53 DOM
-
2026-06-19days on market $225,000 Active 51 DOM
-
2026-06-18days on market $225,000 Active 50 DOM
-
2026-06-17days on market $225,000 Active 49 DOM
-
2026-06-16days on market $225,000 Active 48 DOM
-
2026-06-15days on market $225,000 Active 47 DOM
-
2026-06-14days on market $225,000 Active 45 DOM
-
2026-06-13days on market $225,000 Active 44 DOM
-
2026-06-10days on market $225,000 Active 42 DOM
-
2026-06-09days on market $225,000 Active 41 DOM
-
2026-06-08days on market $225,000 Active 40 DOM
-
2026-06-07days on market $225,000 Active 39 DOM
-
2026-06-05days on market $225,000 Active 36 DOM
-
2026-06-03days on market $225,000 Active 35 DOM
-
2026-06-02days on market $225,000 Active 34 DOM
-
2026-06-01days on market $225,000 Active 33 DOM
-
2026-05-31days on market $225,000 Active 32 DOM
-
2026-05-30days on market $225,000 Active 31 DOM
-
2026-04-29$179,900 Active 362-char remark
-
2021-07-26soldstatus $160,000
-
2021-07-26$160,000
-
2017-07-17soldstatus $92,000
-
2016-07-28$93,500
-
2011-07-27$99,900
-
2010-10-25$109,900
ⓘ Source: listings_history table (triggers on properties + properties_extension) + one-shot
backfill from property_details.listing_events for pre-trigger history.
Tax reassessment forecast AL · Resets to sale price
- Current annual tax
- $471 · $39/mo
- Projected year-2 tax
- $923 · $77/mo
- Expected delta
- +$451/yr (+$38/mo · 95.8%)
ⓘ Screening estimate from a state-policy table — verify with the county assessor before closing.
Climate risk First Street
- Flood 1/10 Low FEMA zone X (unshaded) · 0% chance over 30 yrs
- Wildfire 2/10 Low
- Heat 6/10 Major 7 d/yr ≥107°F today · 20 d/yr by 30 yrs out
- Wind 6/10 Major 27% chance of damaging wind over 30 yrs
- Air quality 2/10 Low 0 unhealthy d/yr today · 1 by 30 yrs out
Nearby sold comps map
Loading sold comps map…
Walkable amenities ~0.75 mi
Loading nearby amenities…
Taxation est. · year 1
- Rental income
- $14,705
- − Mortgage interest
- −$12,603
- − Property taxes
- −$471
- − Insurance
- −$1,125
- − Repairs & maintenance
- −$1,176
- − Management
- −$1,176
- − Depreciation
- −$6,545
- Taxable loss
- −$8,393
- Est. tax savings @ 24.0%
- +$2,014
- After-tax cash flow
- $-2,124/yr
For passive investors: Depreciation is non-cash, so a rental often shows a tax loss while cash-flowing — sheltering income. Rental losses are passive: they offset passive income freely, and up to $25,000/yr can offset ordinary (W-2) income if you actively participate and your MAGI is under $100k (phasing out to $0 by $150k); unused losses carry forward. On sale, claimed depreciation is recaptured at up to 25%, and gains may owe capital-gains tax (a 1031 exchange can defer both). Figures are a year-1 estimate at your 24.0% rate — not tax advice; consult a CPA.
Schools (NCES district)
- District
- Colbert County
- NCES district ID
- 0100840
- Math proficiency
- 13% ▼ -24.00%
- Reading proficiency
- 38% ▬ 0.00%
- Median HH income
- $40,710
- Composite
- 21.48/100
- National rank
- #8328
- State rank
- #90 of 129 in AL
Livability — Leighton
- Score
- 52/100
- State rank
- #500
- US rank
- #24843
Category grades
Schools grade is shown separately in the Schools card above.
Census & demographics
- Population (ZIP)
- 4,005
Population outlook (Colbert County) Hauer SSP2
- Today (2025)
- 54,154 people
- By 2030
- 53,746 · -0.8%
- By 2040
- 52,431 · -3.2%
- By 2050
- 50,303 · -7.1%
- By 2075
- 44,789 · -17.3%
- By 2100
- 36,676 · -32.3%
Race, ethnicity, and origin ACS 2023
- Neighborhood character
- Predominantly White (69%)
- Race & ethnicity
- White 69% Black 29% Two or more races 2%
- Common ancestry
- Iranian 2% Italian 2% Romanian 1%
Political lean MEDSL · Colbert
- 2024 margin
- Solid R (+46.4) · D 26.4% · R 72.8%
- 2008→2024 swing
- -26.2pp toward R · 2008: -20.3pp · 2024: -46.4pp
- All cycles
- 2024: R+46.4 2020: R+38.9 2016: R+38.3 2012: R+20.4 2008: R+20.3
Not yet ingested
- Civics
- —
Market trends
- HPI YoY
- ▲ 5.26%
- Current HPI
- 151.8695
- Rent YoY
- —
- Metro
- —
- State GDP YoY
- ▲ 2.94%
- F500 in state
- 4
Industry mix (Fortune 500 HQ in AL)
| Industry | F500 HQs | Revenue |
|---|---|---|
| Financial Services | 1 | $8B |
|
||
| Healthcare | 1 | $5B |
|
||
Price history
+104.7% since first listed8 events — show timeline
- 2026-05-28 Price Changed $225,000 SAARMLS
- 2026-04-29 Listed $179,900 SAARMLS
- 2021-07-26 Listed $160,000 SAARMLS
- 2021-07-26 Sold (MLS) $160,000 SAARMLS
- 2017-07-17 Sold (Public Records) $92,000 Public Records
- 2016-07-28 Listed $93,500 SAARMLS
- 2011-07-27 Listed $99,900 SAARMLS
- 2010-10-25 Listed $109,900 SAARMLS
Property tax history
+7.2%/yrLatest (2025): $471 · +6.1% YoY. Source: county tax records.
Cash-flow waterfall
monthlySold comps — $/sqft
last 12 mo · ≤1 miLoading sold comps…