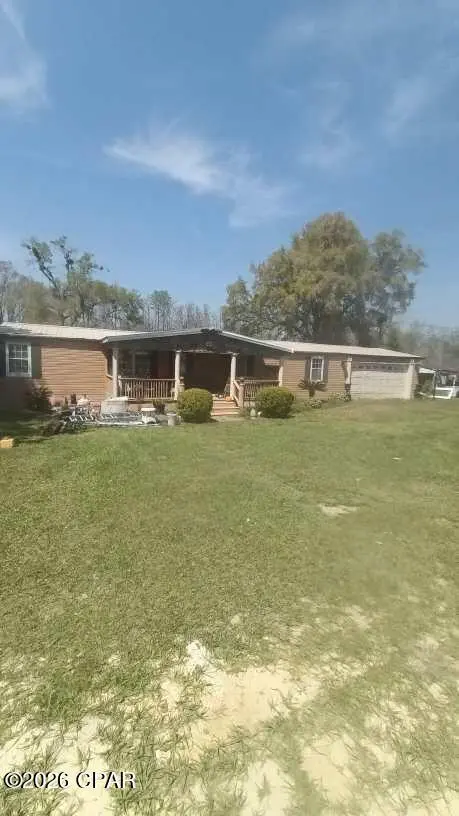
365 Jehu Rd · Wewahitchka, FL
Flood risk 1/10 · Minimal
- FEMA flood zone
- AE
- Chance of flooding over 30 yrs
- 0.0%
- Est. flood insurance / yr
- $1,737 – $8,500
Fire risk 3/10 · Minor
- Est. fire insurance / yr
- $947 – $1,759
Heat risk 9/10 · Severe
- Hot days now (above 106°F)
- 7 days/yr
- Hot days in 30 yrs
- 20 days/yr
Wind risk 9/10 · Severe
- Chance of severe wind over 30 yrs
- 99.0%
Air-quality risk 1/10 · Minimal
- Unhealthy air days now
- 0 days/yr
- Unhealthy air days in 30 yrs
- 0 days/yr
Risk factors via First Street. Map © Google.
Why this score? — see what drove the C+ grade
The composite is a weighted blend of 9 inputs, each scored 0–100. Each bar is that input's sub-score; the figure is the points it added to the 100-point composite (weight × sub-score).
- Cash flow +21.9/30.0
- Appreciation +10.0/10.0
- ARV discount +7.5/15.0
- DSCR +7.0/10.0
- 1% rule +5.7/10.0
- Schools +3.9/10.0
- Livability +3.6/5.0
- Rent growth +2.5/5.0
- Condition / age +2.5/5.0
$127,500
🖨 Deal sheet (PDF) 📄 Offer letter ✓ Due diligence
Listing remarks
WOW, THIS IS A CASH ONLY SALE. Please understand that when submitting an offer The possibilities for a great Fish Camp on the Dead Lakes almost 1 acre. The owner had started to rehab but has to return to the North. This property offers 2 large bedrooms, 2 Baths. There are a lot of positives but with some TLC this could be a great getaway, Fish Camp or project started home. The Lake is only 10/15 feet inside the wood line. and there are some older piles that a dock maybe reestablished on. Large front and back, there is also a large unfinished garage with a dirt floor. Like i said it needs TLC but the property has great possibilities. Quiet peaceful area. Come check it out. .
Key facts
- Quiet peaceful area
- Unfinished garage
- 0.96 acre lot
Tags
Property features AI
Finance
- HOA & community: Short-term rentals allowed
Exterior
- Parking: 2-car garage; Unpaved parking
- Utilities: Electricity available; Public sewer
- Home design: Double wide mobile home; Wood frame with vinyl siding; Metal roof
- Construction: Built with wood frame and vinyl siding; Metal roof
- Exterior features: Covered open porch; Partial fencing; Paved lot access; Lakefront on a lake
Interior
- Kitchen: Electric range
- Bedrooms: Primary bedroom on the first floor
- Bathrooms: 2 full bathrooms
- Heating & cooling: Central heating (electric); Central air conditioning; Ceiling fans
- Interior features: Has view
Neighborhood map
What this means for you Summary
Snapshot
- This is a 3-bed/2.0-bath manufactured listed at $128k.
Deal economics
- At list price, monthly cash flow is $-225 ($-3k/yr) — negative.
- To cash-flow at today's rent, offer at most $95k (25.6% below list).
- Meets the 1% rule at list price ($1k rent vs $128k).
- Recommended offer: $95k (25.6% below list) — sets the bar for cash-flow.
- Cap rate 8.2% vs local median 3.4% in Wewahitchka — top-decile yield for the area; either an underpriced asset or a hidden risk that comps aren't pricing in. Stress-test before assuming the spread holds.
Location & tenants
- Location reads 71/100 on livability (#386 in FL) — a middle-class / working-renter tenant base. Strengths: crime A+, cost of living A+, housing A+; Watch: amenities F, commute F, health & safety F.
- Gulf (rural): math 47% / reading 45% proficiency, ranked #49 of 73 in FL (top 67%) — families likely to look elsewhere, expect single-tenant / working-renter base with shorter leases.
- Zoned schools: Wewahitchka Elementary School (math 47% / reading 37%, grade F, #1,403 of 2,144 statewide, top 67%, 504 students, 55% FRL); Wewahitchka High School (math 42% / reading 47%, grade F, #237 of 667 statewide, top 36%, 363 students, 53% FRL) — zoned schools at 54% FRL track the district average.
- Market conditions: 166 active listings in the ZIP; 302 units permitted in Gulf County in 2024 (0 in 5+ unit buildings).
Forward outlook
- In year one you build about $14k of equity ($882 loan paydown + $13k appreciation (10.0% local appreciation)).
- Gulf County population projected to shrink 4% by 2050 — rents likely to lag national; underwrite the cash flow, not the appreciation.
- By year 3, paydown + projected appreciation supports a ~$35k cash-out refi (75% LTV) — recoverable capital for the next deal without selling this one.
Negotiation context
- It's been on market 17 days — a 2% lower offer ($126k) is reasonable based on typical stale-listing flexibility.
- 6 sale attempts since 3y ago with the ask held roughly flat each time — persistent listings suggest the price (not the market) is what's stuck; bring a comps-based counter.
- Current owner paid $62k; list at $128k implies a 104% gain — meaningful room to come down on a strong offer.
Risks & watch-outs
- Watch-outs: flood insurance adds $427/mo.
- Climate carrying-cost: in FEMA flood zone AE (mandatory federal flood insurance); severe wind risk, 99% chance of damaging wind over 30y; extreme-heat days projected 7→20/yr by 2055 (HVAC capex compounding) — expect insurance premiums to compound above CPI over the hold.
Questions for the listing agent
- What do current leases actually rent for vs. the listed asking? Can we see a recent rent roll and the last 12 months of T-12 income?
- What's the actual annual flood-insurance premium (NFIP or private), and is the property in a SFHA with mandatory coverage?
- Is there a deadline driving the sale (1031 exchange, divorce, estate, relocation)? That informs how much negotiation room exists.
- Schools are D-rated, which usually means shorter tenancies and higher turnover. Who's the typical renter profile here, and what's been the actual vacancy rate?
- What's the average days-on-market for RENTAL listings here right now (not sales)? A rising rental-DOM trend means longer vacancies and softer asking-rent achievability than the comps imply.
- What's the recent tenant-quality profile in this submarket — average credit score on applications, eviction rate, late-payment / NSF rate, and stable-employment percentage? A property-management company in the area should have these aggregated.
- How much new for-sale + rental construction is in the pipeline within 1–3 miles? Heavy new supply typically softens prices + rents 12–24 months out; constrained supply supports both.
Investment metrics
- 1% rule
- 1.07% ✓
- Cap rate
- 8.19%
- Cash-on-cash
- 6.76%
- DSCR
- 1.30
- GRM
- 7.8
CMA / ARV
No comps found within radius.
Projected returns pro-forma
10.0% appreciation · 3.0% rent growth · sell at horizon
- IRR
- 19.0%
- Equity multiple
- 2.55×
- Total profit
- $55,371
- Equity at exit
- $114,862
- IRR
- 17.6%
- Equity multiple
- 5.90×
- Total profit
- $174,906
- Equity at exit
- $247,704
Cash invested: $35,700 (down + closing). Projections, not guarantees.
Landlord ↔ Tenant lean methodology
- Overall (STATE)
- 87 Strongly Landlord-Friendly
- State Florida
- 87 Strongly Landlord-Friendly · R+3
- County
- — inherits STATE
- City
- — inherits STATE
ZIP-level market 32465
- Home prices YoY
- 25.5%
- Active inventory
- 166
- Price-to-rent
- 7.8×
Monthly cashflow live
- Estimated rent
- $1,370 medium interval (Pro) →
- Mortgage (P&I)
- −$669
- Tax est. 1.5%
- −$159 /mo · $1,912/yr
- Insurance
- −$53
- Flood insurance flood zone
- −$427 /mo · $5,118/yr
- HOA
- −$0
- Vacancy / Maint / Mgmt
- −$288
- Net cashflow
- $-225
Break-even live
Sensitivity live
| Price | -10% $-137 | -5% $-181 | +0% $-225 | +5% $-269 | +10% $-313 |
|---|---|---|---|---|---|
| Rent | -10% $-334 | -5% $-279 | +0% $-225 | +5% $-171 | +10% $-117 |
| Rate | -1.0pp $-161 | -0.5pp $-193 | base $-225 | +0.5pp $-258 | +1.0pp $-292 |
UW: 25.0% down · 7.5% · 30yr · 1.5% tax · 5.0% vac · 8.0% maint · 8.0% mgmt
Financing live
Cash to close
- Down payment
- $31,875
- Closing costs
- $3,825
- Reserves months
- —
- Total cash needed
- —
Loan-product check · same deal, 3 products live
Conventional
25% down · 7.5% · 30yr
- Down + closing
- —
- Monthly P&I
- —
- Monthly cashflow
- —
- DSCR
- —
- Eligible?
- —
Personal DTI + credit; lowest rate.
DSCR
20% down · 8.5% · 30yr
- Down + closing
- —
- Monthly P&I
- —
- Monthly cashflow
- —
- DSCR
- —
- Eligible?
- —
No personal income docs; deal must DSCR.
Hard money
10% down · 12.0% · 12mo
- Down + closing
- —
- Monthly P&I
- —
- Monthly cashflow
- —
- DSCR
- —
- Eligible?
- —
Short-term bridge; refi at stabilization.
Listing history 28 events
-
2026-06-22days on market $127,500 Active 17 DOM
-
2026-06-19days on market $127,500 Active 15 DOM
-
2026-06-18days on market $127,500 Active 14 DOM
-
2026-06-17remarks 686-char remark
-
2026-06-17status $127,500 Active 13 DOM
-
2026-06-07statusdays on market $127,500 Pending 13 DOM
-
2026-06-05days on market $127,500 Active 11 DOM
-
2026-06-02days on market $127,500 Active 9 DOM
-
2026-06-01days on market $127,500 Active 8 DOM
-
2026-05-31days on market $127,500 Active 7 DOM
-
2026-05-30days on market $127,500 Active 6 DOM
-
2026-05-23$127,500 Active
-
2026-05-05price $107,900
-
2026-04-29price $129,900
-
2026-03-16$157,000 Active
-
2025-12-17price $189,900
-
2023-11-17soldstatus $62,500 Closed
-
2023-11-17soldstatus $62,500 Closed
-
2023-10-26historical Active Under Contract
-
2023-10-26status Pending
-
2023-10-13status Active
-
2023-10-12$75,000 Active
-
2023-09-30historical
-
2023-09-06status Active
-
2023-08-31historical
-
2023-08-03price $75,000
-
2023-08-03$75,000 Active
-
2023-06-15price $80,000
ⓘ Source: listings_history table (triggers on properties + properties_extension) + one-shot
backfill from property_details.listing_events for pre-trigger history.
Climate risk First Street
- Flood 1/10 Low FEMA zone AE · 0% chance over 30 yrs
- Wildfire 3/10 Moderate
- Heat 9/10 Extreme 7 d/yr ≥106°F today · 20 d/yr by 30 yrs out
- Wind 9/10 Extreme 99% chance of damaging wind over 30 yrs
- Air quality 1/10 Low 0 unhealthy d/yr today · 0 by 30 yrs out
Nearby sold comps map
Loading sold comps map…
Walkable amenities ~0.75 mi
Loading nearby amenities…
Taxation est. · year 1
- Rental income
- $16,440
- − Mortgage interest
- −$7,142
- − Property taxes
- −$1,912
- − Insurance
- −$5,756
- − Repairs & maintenance
- −$1,315
- − Management
- −$1,315
- − Depreciation
- −$3,709
- Taxable loss
- −$4,710
- Est. tax savings @ 24.0%
- +$1,130
- After-tax cash flow
- $-1,574/yr
For passive investors: Depreciation is non-cash, so a rental often shows a tax loss while cash-flowing — sheltering income. Rental losses are passive: they offset passive income freely, and up to $25,000/yr can offset ordinary (W-2) income if you actively participate and your MAGI is under $100k (phasing out to $0 by $150k); unused losses carry forward. On sale, claimed depreciation is recaptured at up to 25%, and gains may owe capital-gains tax (a 1031 exchange can defer both). Figures are a year-1 estimate at your 24.0% rate — not tax advice; consult a CPA.
Schools (NCES district)
- District
- Gulf
- NCES district ID
- 1200690
- Math proficiency
- 47% ▼ -5.00%
- Reading proficiency
- 45% ▼ -5.00%
- Median HH income
- $41,047
- Composite
- 38.63/100
- National rank
- #4154
- State rank
- #49 of 73 in FL
Livability — Wewahitchka
- Score
- 71/100
- State rank
- #386
- US rank
- #6847
Category grades
Schools grade is shown separately in the Schools card above.
Census & demographics
- Census place
- Wewahitchka, FL
- Population (ZIP)
- 7,940
Population outlook (Gulf County) Hauer SSP2
- Today (2025)
- 15,677 people
- By 2030
- 15,538 · -0.9%
- By 2040
- 15,386 · -1.9%
- By 2050
- 15,043 · -4.0%
- By 2075
- 13,793 · -12.0%
- By 2100
- 10,793 · -31.2%
Race, ethnicity, and origin ACS 2023
- Neighborhood character
- Predominantly White (69%)
- Race & ethnicity
- White 69% Black 21% Hispanic / Latino 6% Two or more races 5% Native American 1%
- Hispanic origin (detail)
- Mexican 2% Puerto Rican 1% Cuban 1%
- Common ancestry
- Lithuanian 2% Hispanic 1% Italian 1%
- Foreign-born
- 3% · Canada
- Languages at home
- 92% English-only · Spanish 6% French/Haitian/Cajun 1%
Political lean MEDSL · Gulf
- 2024 margin
- Solid R (+54.2) · D 22.6% · R 76.8%
- 2008→2024 swing
- -14.9pp toward R · 2008: -39.3pp · 2024: -54.2pp
- All cycles
- 2024: R+54.2 2020: R+50.6 2016: R+49.5 2012: R+42.0 2008: R+39.3
Not yet ingested
- Civics
- —
Market trends
- HPI YoY
- ▲ 85.74%
- Current HPI
- 421.7879
- Rent YoY
- —
- Metro
- —
- State GDP YoY
- ▲ 3.28%
- F500 in state
- 36
Industry mix (Fortune 500 HQ in FL)
| Industry | F500 HQs | Revenue |
|---|---|---|
| Industrial Technology | 2 | $29B |
|
||
| Insurance | 2 | $17B |
|
||
| Retail | 1 | $60B |
|
||
| Technology Distribution | 1 | $58B |
|
||
| Homebuilding | 1 | $35B |
|
||
| Technology Manufacturing | 1 | $35B |
|
||
Price history
+59.4% since first listed17 events — show timeline
- 2026-05-23 Listed $127,500 CPARMLS
- 2026-05-05 Price Changed $107,900 RAFGC
- 2026-04-29 Price Changed $129,900 RAFGC
- 2026-03-16 Listed $157,000 ECAR
- 2025-12-17 Price Changed $189,900 RAFGC
- 2023-11-17 Sold (MLS) $62,500 RAFGC
- 2023-11-17 Sold (MLS) $62,500 CPARMLS
- 2023-10-26 Contingent — RAFGC
- 2023-10-26 Pending — CPARMLS
- 2023-10-13 Relisted — CPARMLS
- 2023-10-12 Listed $75,000 RAFGC
- 2023-09-30 Listing Removed — CPARMLS
- 2023-09-06 Relisted — CPARMLS
- 2023-08-31 Listing Removed — CPARMLS
- 2023-08-03 Price Changed $75,000 RAFGC
- 2023-08-03 Listed $75,000 CPARMLS
- 2023-06-15 Price Changed $80,000 RAFGC
Property tax history
-1.0%/yrLatest (2025): $217 · -77.1% YoY. Source: county tax records.
Cash-flow waterfall
monthlySold comps — $/sqft
last 12 mo · ≤1 miLoading sold comps…