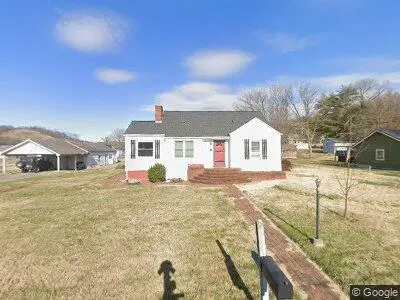
412 Monument Pl · Elizabethton, TN
Flood risk 1/10 · Minimal
- FEMA flood zone
- X (unshaded)
- Chance of flooding over 30 yrs
- 0.0%
- Est. flood insurance / yr
- $473 – $860
Fire risk 3/10 · Minor
- Est. fire insurance / yr
- $949 – $1,763
Heat risk 5/10 · Moderate
- Hot days now (above 98°F)
- 7 days/yr
- Hot days in 30 yrs
- 22 days/yr
Wind risk 2/10 · Minimal
- Chance of severe wind over 30 yrs
- —
Air-quality risk 2/10 · Minimal
- Unhealthy air days now
- 1 days/yr
- Unhealthy air days in 30 yrs
- 1 days/yr
Risk factors via First Street. Map © Google.
Why this score? — see what drove the F grade
The composite is a weighted blend of 9 inputs, each scored 0–100. Each bar is that input's sub-score; the figure is the points it added to the 100-point composite (weight × sub-score).
- ARV discount +7.5/15.0
- Cash flow +6.9/30.0
- Livability +3.3/5.0
- Schools +2.9/10.0
- Rent growth +2.5/5.0
- Condition / age +2.5/5.0
- DSCR +1.1/10.0
- 1% rule +0.7/10.0
- Appreciation +0.0/10.0
$278,000
🖨 Deal sheet (PDF) 📄 Offer letter ✓ Due diligence
Listing remarks MLS
This large family home in West Elizabethton is a wonderful family home in need of some exterior TLC and is priced attractively to allow for those needed improvements. Buyers must see inside this home to appreciate the interior condition and the amount of living area offered at such an affordable price. Price is $19,200 under current Tax Appraisal. Huge level lot offering 122.5' of frontage with a depth of 150' Enter into a large living room with a fireplace and original hardwood flooring. Spacious formal dining room, big enough to accommodate large gatherings. Eat in kitchen with updated wood cabinetry and all appliances conveying. Family room with stone wood burning fireplace and updated hardwood flooring. Three main level bedrooms and two full baths. Huge laundry and mud room. Upstairs there is a large fourth bedroom. Full basement with rec room area. Central heating and air conditioning with the heating and cooling vented to both the upper level bedroom and the basement area. Home is wired for a security system. The lot is table top level, ideal for children and pets. Oversize detached two car garage with adjacent workshop. Two car detached carport. A drive by of this home will not reveal all that there is to offer in this spacious home at such an affordable price. Opportunity for buyers who are willing to invest in some exterior improvements to buy a 4 bedroom, 2 bath home with 2,328 square feet of living area with a basement and situated on a premium sized lot in the highly desirable West End of Elizabethton at a per square foot price that makes this property an attractive buy and an excellent choice for smart buyers. All info. taken from Tax Records. Buyer/buyer's Agent to verify all.
Key facts
- Eat in kitchen
- Large living room
- Built 1973
Tags
Neighborhood map
What this means for you Summary
Snapshot
- This is a 4-bed/2.0-bath single-family listed at $278k.
Deal economics
- At list price, monthly cash flow is $-423 ($-5k/yr) — negative.
- To cash-flow at today's rent, offer at most $203k (26.9% below list).
- To meet the 1% rule (rent ≥ 1% of price), the offer needs to be $157k (43.4% below list).
- Recommended offer: $157k (43.4% below list) — sets the bar for 1% rule.
- Cap rate 4.5% vs local median 3.7% in Elizabethton — meaningfully above typical; check what's discounted (condition, days-on-market, listing class) to confirm the premium yield is real.
Location & tenants
- Location reads 66/100 on livability (#121 in TN) — a middle-class / working-renter tenant base. Strengths: cost of living A+, housing A, crime A-; Watch: amenities F, commute F, employment F.
- Elizabethton (suburban): math 36% / reading 35% proficiency, ranked #35 of 139 in TN (top 25%) — families likely to look elsewhere, expect single-tenant / working-renter base with shorter leases.
- Zoned schools: West Side Elementary (math 52% / reading 57%, grade C, #92 of 952 statewide, top 10%, 371 students, 0% FRL); T A Dugger Junior High School (math 42% / reading 28%, grade F, #65 of 333 statewide, top 20%, 633 students, 0% FRL); Elizabethton High School (math 17% / reading 41%, grade F, #92 of 332 statewide, top 28%, 863 students, 0% FRL) — zoned schools average 0% FRL vs 43% district-wide (43 pts lower); this property's tenant base skews higher-income than the district average.
- Market conditions: 178 active listings in the ZIP; 184 units permitted in Carter County in 2024 (0 in 5+ unit buildings).
Forward outlook
- Local home prices are declining (-3.0%/yr); year-one equity from $2k of loan paydown is wiped out by about $8k of value loss. Plan a longer hold.
- Carter County population projected at -21% by 2050 — secular population decline; favor cash flow + early exit over multi-decade hold.
Negotiation context
- It's been on market 15 days — a 2% lower offer ($274k) is reasonable based on typical stale-listing flexibility.
- 2 sale attempts since 7y ago with the ask held roughly flat each time — persistent listings suggest the price (not the market) is what's stuck; bring a comps-based counter.
- Current owner paid $110k; list at $278k implies a 153% gain — meaningful room to come down on a strong offer.
Risks & watch-outs
- Climate carrying-cost: extreme-heat days projected 7→22/yr by 2055 (HVAC capex compounding) — expect insurance premiums to compound above CPI over the hold.
Questions for the listing agent
- What do current leases actually rent for vs. the listed asking? Can we see a recent rent roll and the last 12 months of T-12 income?
- Built in 1973 — when were the roof, HVAC, electrical panel, plumbing, and water heater last replaced?
- Is there a deadline driving the sale (1031 exchange, divorce, estate, relocation)? That informs how much negotiation room exists.
- Schools are D-rated, which usually means shorter tenancies and higher turnover. Who's the typical renter profile here, and what's been the actual vacancy rate?
- The area grade is low — what's the realistic commute time and amenity access for the typical tenant pool here? Any planned neighborhood developments (good or bad) we should know about?
- What's the average days-on-market for RENTAL listings here right now (not sales)? A rising rental-DOM trend means longer vacancies and softer asking-rent achievability than the comps imply.
- What's the recent tenant-quality profile in this submarket — average credit score on applications, eviction rate, late-payment / NSF rate, and stable-employment percentage? A property-management company in the area should have these aggregated.
- How much new for-sale + rental construction is in the pipeline within 1–3 miles? Heavy new supply typically softens prices + rents 12–24 months out; constrained supply supports both.
Investment metrics
- 1% rule
- 0.57% ✗
- Cap rate
- 4.47%
- Cash-on-cash
- -6.52%
- DSCR
- 0.71
- GRM
- 14.7
CMA / ARV
No comps found within radius.
Projected returns pro-forma
-3.0% appreciation · 3.0% rent growth · sell at horizon
- IRR
- -27.6%
- Equity multiple
- 0.07×
- Total profit
- $-72,130
- Equity at exit
- $41,451
- IRR
- -26.3%
- Equity multiple
- -0.26×
- Total profit
- $-98,053
- Equity at exit
- $24,036
Cash invested: $77,840 (down + closing). Projections, not guarantees.
Landlord ↔ Tenant lean methodology
- Overall (STATE)
- 87 Strongly Landlord-Friendly
- State Tennessee
- 87 Strongly Landlord-Friendly · R+13
- County
- — inherits STATE
- City
- — inherits STATE
ZIP-level market 37643
- Home prices YoY
- -19.3%
- Active inventory
- 178
- Price-to-rent
- 14.7×
Monthly cashflow live
- Estimated rent
- $1,572 medium interval (Pro) →
- Mortgage (P&I)
- −$1,458
- Tax from tax record
- −$92 /mo · $1,099/yr
- Insurance
- −$116
- HOA
- −$0
- Vacancy / Maint / Mgmt
- −$330
- Net cashflow
- $-423
Break-even live
Sensitivity live
| Price | -10% $-266 | -5% $-344 | +0% $-423 | +5% $-502 | +10% $-580 |
|---|---|---|---|---|---|
| Rent | -10% $-547 | -5% $-485 | +0% $-423 | +5% $-361 | +10% $-299 |
| Rate | -1.0pp $-283 | -0.5pp $-352 | base $-423 | +0.5pp $-495 | +1.0pp $-568 |
UW: 25.0% down · 7.5% · 30yr · 1.5% tax · 5.0% vac · 8.0% maint · 8.0% mgmt
Financing live
Cash to close
- Down payment
- $69,500
- Closing costs
- $8,340
- Reserves months
- —
- Total cash needed
- —
Loan-product check · same deal, 3 products live
Conventional
25% down · 7.5% · 30yr
- Down + closing
- —
- Monthly P&I
- —
- Monthly cashflow
- —
- DSCR
- —
- Eligible?
- —
Personal DTI + credit; lowest rate.
DSCR
20% down · 8.5% · 30yr
- Down + closing
- —
- Monthly P&I
- —
- Monthly cashflow
- —
- DSCR
- —
- Eligible?
- —
No personal income docs; deal must DSCR.
Hard money
10% down · 12.0% · 12mo
- Down + closing
- —
- Monthly P&I
- —
- Monthly cashflow
- —
- DSCR
- —
- Eligible?
- —
Short-term bridge; refi at stabilization.
Listing history 12 events
-
2026-06-16days on market $278,000 Active 15 DOM
-
2026-06-15days on market $278,000 Active 14 DOM
-
2026-06-14days on market $278,000 Active 12 DOM
-
2026-06-13days on market $278,000 Active 11 DOM
-
2026-06-10days on market $278,000 Active 9 DOM
-
2026-06-09days on market $278,000 Active 8 DOM
-
2026-06-08days on market $278,000 Active 7 DOM
-
2026-06-07days on market $278,000 Active 6 DOM
-
2026-06-05days on market $278,000 Active 3 DOM
-
2026-06-03days on market $278,000 Active 2 DOM
-
2026-06-01remarks 691-char remark
-
2026-06-01$278,000 Active 1 DOM
ⓘ Source: listings_history table (triggers on properties + properties_extension) + one-shot
backfill from property_details.listing_events for pre-trigger history.
Tax reassessment forecast TN · Resets to sale price
- Current annual tax
- $1,099 · $92/mo
- Projected year-2 tax
- $1,974 · $164/mo
- Expected delta
- +$875/yr (+$73/mo · 79.6%)
ⓘ Screening estimate from a state-policy table — verify with the county assessor before closing.
Climate risk First Street
- Flood 1/10 Low FEMA zone X (unshaded) · 0% chance over 30 yrs
- Wildfire 3/10 Moderate
- Heat 5/10 Major 7 d/yr ≥98°F today · 22 d/yr by 30 yrs out
- Wind 2/10 Low
- Air quality 2/10 Low 1 unhealthy d/yr today · 1 by 30 yrs out
Nearby sold comps map
Loading sold comps map…
Walkable amenities ~0.75 mi
Loading nearby amenities…
Taxation est. · year 1
- Rental income
- $18,868
- − Mortgage interest
- −$15,572
- − Property taxes
- −$1,099
- − Insurance
- −$1,390
- − Repairs & maintenance
- −$1,509
- − Management
- −$1,509
- − Depreciation
- −$8,087
- Taxable loss
- −$10,299
- Est. tax savings @ 24.0%
- +$2,472
- After-tax cash flow
- $-2,606/yr
For passive investors: Depreciation is non-cash, so a rental often shows a tax loss while cash-flowing — sheltering income. Rental losses are passive: they offset passive income freely, and up to $25,000/yr can offset ordinary (W-2) income if you actively participate and your MAGI is under $100k (phasing out to $0 by $150k); unused losses carry forward. On sale, claimed depreciation is recaptured at up to 25%, and gains may owe capital-gains tax (a 1031 exchange can defer both). Figures are a year-1 estimate at your 24.0% rate — not tax advice; consult a CPA.
Schools (NCES district)
- District
- Elizabethton
- NCES district ID
- 4701110
- Math proficiency
- 36% ▼ -12.00%
- Reading proficiency
- 35% ▼ -8.00%
- Median HH income
- $30,800
- Composite
- 28.94/100
- National rank
- #6630
- State rank
- #35 of 139 in TN
Livability — Elizabethton
- Score
- 66/100
- State rank
- #121
- US rank
- #11785
Category grades
Schools grade is shown separately in the Schools card above.
Census & demographics
- Census place
- Elizabethton, TN
- City population
- 513
- Population (ZIP)
- 33,690
Population outlook (Carter County) Hauer SSP2
- Today (2025)
- 54,493 people
- By 2030
- 52,639 · -3.4%
- By 2040
- 47,929 · -12.0%
- By 2050
- 42,877 · -21.3%
- By 2075
- 31,487 · -42.2%
- By 2100
- 21,979 · -59.7%
Race, ethnicity, and origin ACS 2023
- Neighborhood character
- Predominantly White (93%)
- Race & ethnicity
- White 93% Two or more races 3% Hispanic / Latino 3% Black 2%
- Common ancestry
- Serbian 3% Slovak 2% Italian 2%
- Foreign-born
- 2% · Canada
- Languages at home
- 98% English-only · Spanish 2%
Political lean MEDSL · Carter
- 2024 margin
- Solid R (+63.2) · D 17.9% · R 81.2%
- 2008→2024 swing
- -16.1pp toward R · 2008: -47.2pp · 2024: -63.2pp
- All cycles
- 2024: R+63.2 2020: R+61.5 2016: R+64.0 2012: R+52.0 2008: R+47.2
Not yet ingested
- Civics
- —
Market trends
- HPI YoY
- ▼ -77.08%
- Current HPI
- 321.4024
- Rent YoY
- —
- Metro
- —
- State GDP YoY
- ▲ 2.78%
- F500 in state
- 22
Industry mix (Fortune 500 HQ in TN)
| Industry | F500 HQs | Revenue |
|---|---|---|
| Healthcare | 3 | $91B |
|
||
| Retail | 3 | $72B |
|
||
| Transportation / Logistics | 1 | $88B |
|
||
| Paper / Packaging | 1 | $19B |
|
||
| Insurance | 1 | $13B |
|
||
| Energy | 1 | $12B |
|
||
Price history
+169.9% since first listed5 events — show timeline
- 2026-06-01 Listed $278,000 FSBO.com
- 2019-09-23 Sold (Public Records) $110,000 Public Records
- 2019-09-20 Sold (MLS) $110,000 TVRMLS
- 2019-01-16 Listed $119,000 TVRMLS
- 1999-05-13 Sold (Public Records) $103,000 Public Records
Property tax history
-2.8%/yrLatest (2025): $1,099 · +2.4% YoY. Source: county tax records.
Cash-flow waterfall
monthlySold comps — $/sqft
last 12 mo · ≤1 miLoading sold comps…