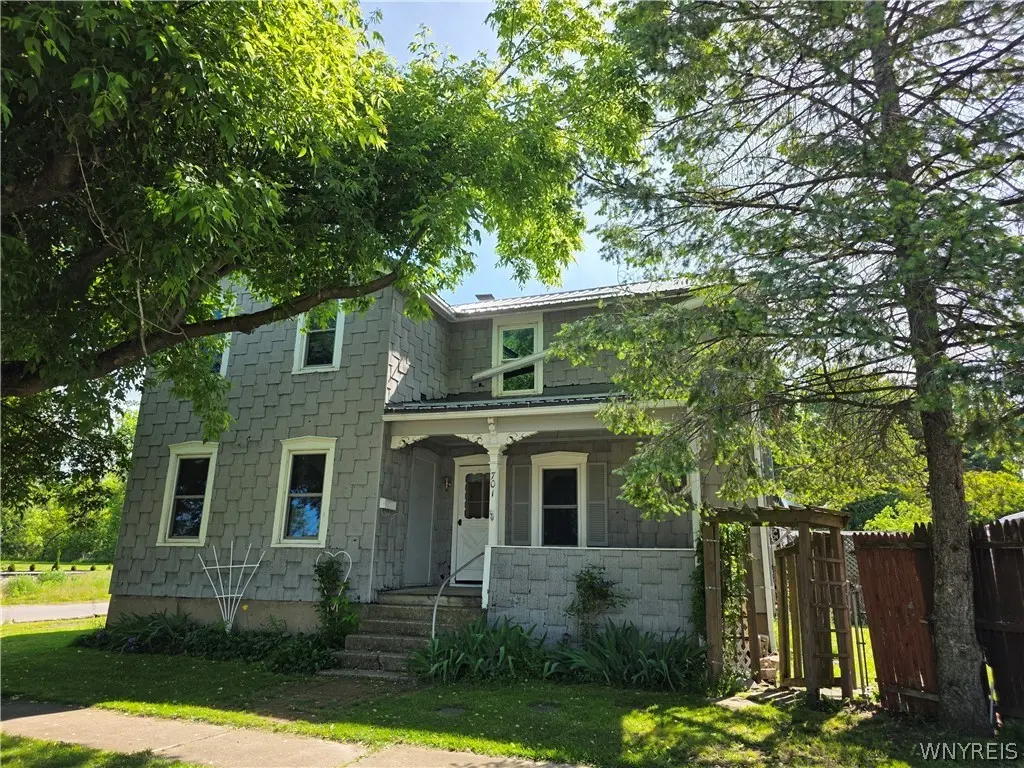
701 Genesee St · Medina, NY
Flood risk 6/10 · Moderate
- FEMA flood zone
- X
- Chance of flooding over 30 yrs
- 0.69%
- Est. flood insurance / yr
- $473 – $860
Fire risk 1/10 · Minimal
- Est. fire insurance / yr
- $691 – $1,283
Heat risk 2/10 · Minimal
- Hot days now (above 95°F)
- 7 days/yr
- Hot days in 30 yrs
- 15 days/yr
Wind risk 1/10 · Minimal
- Chance of severe wind over 30 yrs
- —
Air-quality risk 2/10 · Minimal
- Unhealthy air days now
- 1 days/yr
- Unhealthy air days in 30 yrs
- 2 days/yr
Risk factors via First Street. Map © Google.
Why this score? — see what drove the C- grade
The composite is a weighted blend of 9 inputs, each scored 0–100. Each bar is that input's sub-score; the figure is the points it added to the 100-point composite (weight × sub-score).
- ARV discount +15.0/15.0
- Cash flow +11.1/30.0
- 1% rule +5.0/10.0
- Appreciation +4.9/10.0
- Livability +3.6/5.0
- DSCR +3.2/10.0
- Schools +3.2/10.0
- Rent growth +2.5/5.0
- Condition / age +2.5/5.0
$119,900
🖨 Deal sheet (PDF) 📄 Offer letter ✓ Due diligence
Listing remarks
Three bedroom village home on a corner lot. Home has updates including new furnace and central air in 2024 and a new water heater in 2025. Home also has a metal roof and newer sump pump. Inside features include large foyer area that leads to a kitchen with a breakfast bar and laundry area. All appliances are included. There is also a formal dining room and large first floor full bath. Enjoy your summer evenings on the private back deck surrounded by a partially fenced in yard. There is also a garage for extra storage. Home is within walking distance of Medina's historic business district and the Medina School District. Offer will reviewed Thursday, June 4th at 5:00 p. m.
Key facts
- New furnace
- Metal roof
- Newer sump pump
Tags
Property features AI
Exterior
- Parking: Attached 1-car garage
- Utilities: Public water connected; Sewer connected; Cable available; High-speed internet available
- Home design: Two-story house; Existing construction; Metal roof; Composite siding; Stone foundation
- Construction: Composite siding construction; Metal roof; Stone foundation; Built as existing (year built details: existing)
- Exterior features: Covered and open porch; Deck; Fence (partial); Gravel driveway; Corner, irregular lot (56 x 67)
Interior
- Kitchen: Gas range; Gas oven; Dishwasher; Refrigerator; Breakfast bar
- Bedrooms: Bedroom 1 on second level; Bedroom 2 on second level; Bedroom 3 on second level
- Flooring: Carpet; Varied flooring
- Bathrooms: One full bathroom (main level)
- Heating & cooling: Gas forced-air heating; Central air conditioning
- Interior features: Breakfast bar; Ceiling fans; Separate/formal dining room; Separate/formal living room; Window treatments (drapes)
- Laundry & utility: Washer and dryer on main level; Gas water heater
Neighborhood map
What this means for you Summary
Snapshot
- This is a 4-bed/1.0-bath single-family listed at $120k.
Deal economics
- At list price, monthly cash flow is $-48 ($-582/yr) — negative.
- To cash-flow at today's rent, offer at most $111k (7.1% below list).
- Meets the 1% rule at list price ($1k rent vs $120k).
- Recommended offer: $111k (7.1% below list) — sets the bar for cash-flow.
Location & tenants
- Location reads 72/100 on livability (#344 in NY) — a middle-class / working-renter tenant base. Strengths: cost of living A+, housing A+, health & safety A+; Watch: crime D-, amenities F, commute F.
- Medina Central School District (town): math 37% / reading 38% proficiency, ranked #548 of 590 in NY (top 93%) — families likely to look elsewhere, expect single-tenant / working-renter base with shorter leases.
- Zoned schools: Clifford Wise Intermediate School (math 17% / reading 34%, grade F, #1,821 of 2,108 statewide, top 86%, 395 students, 55% FRL); Medina Junior-Senior High School (math 67% / reading 52%, grade C+, #851 of 1,100 statewide, top 80%, 614 students, 46% FRL).
- Market conditions: 58 active listings in the ZIP; 1 comparable units currently listed for rent nearby; 28 units permitted in Orleans County in 2024 (0 in 5+ unit buildings).
Forward outlook
- In year one you build about $512 of equity ($829 loan paydown + $-317 appreciation (-0.3% local appreciation)).
- Orleans County population projected at -20% by 2050 — secular population decline; favor cash flow + early exit over multi-decade hold.
Negotiation context
- Only 4 days on market — expect competitive offers; lowballing is unlikely to land.
Risks & watch-outs
- Watch-outs: property tax is 3.2% of price; built in 1880 — expect roof / HVAC / electrical / plumbing capex.
- Climate carrying-cost: major flood risk — expect insurance premiums to compound above CPI over the hold.
Questions for the listing agent
- What do current leases actually rent for vs. the listed asking? Can we see a recent rent roll and the last 12 months of T-12 income?
- Built in 1880 — when were the roof, HVAC, electrical panel, plumbing, and water heater last replaced?
- Property tax is high relative to price — has the assessment been appealed recently, and will the sale trigger a re-assessment?
- Is there a deadline driving the sale (1031 exchange, divorce, estate, relocation)? That informs how much negotiation room exists.
- Crime grade is D in this area — have there been break-ins, vandalism, or insurance claims at this property in the last 3 years? What carrier currently insures it and at what premium?
- What's the average days-on-market for RENTAL listings here right now (not sales)? A rising rental-DOM trend means longer vacancies and softer asking-rent achievability than the comps imply.
- What's the recent tenant-quality profile in this submarket — average credit score on applications, eviction rate, late-payment / NSF rate, and stable-employment percentage? A property-management company in the area should have these aggregated.
- How much new for-sale + rental construction is in the pipeline within 1–3 miles? Heavy new supply typically softens prices + rents 12–24 months out; constrained supply supports both.
Investment metrics
- 1% rule
- 1.00% ✓
- Cap rate
- 5.81%
- Cash-on-cash
- -1.73%
- DSCR
- 0.92
- GRM
- 8.3
CMA / ARV
- ARV (on-the-fly)
- $188,000
- Comps found
- 12
Show comp detail 12 sales within ~0.75 mi
| Address | Dist | Beds/Ba | Sqft | Sold | Price | $/sf | Match |
|---|---|---|---|---|---|---|---|
| 325 South Ave | 0.15mi | 5/1.0 (+1) | 1,456 (-3%) | 7mo | $92,200 | $63 | 77 |
| 511 South Academy | 0.28mi | 3/1.0 (-1) | 1,480 (-2%) | 4mo | $185,000 | $125 | 76 |
| 213 Frank St | 0.54mi | 3/2.0 (-1) | 1,465 (-3%) | 6mo | $220,000 | $150 | 57 |
| 508 S Academy St | 0.30mi | 3/1.5 (-1) | 1,348 (-10%) | 8mo | $183,000 | $136 | 55 |
| 116 Hedley St | 0.45mi | 3/1.5 (-1) | 1,389 (-8%) | 6mo | $140,000 | $101 | 54 |
| 706 Orient St | 0.59mi | 3/2.0 (-1) | 1,440 (-4%) | 4mo | $197,100 | $137 | 54 |
| 922 Orient St | 0.62mi | 4/2.0 | 1,408 (-6%) | 5mo | $175,500 | $125 | 52 |
| 910 S Main St | 0.52mi | 3/1.0 (-1) | 1,351 (-10%) | 2mo | $199,000 | $147 | 52 |
| 909 West Ave | 0.37mi | 4/2.0 | 1,699 (+13%) | 6mo | $76,000 | $45 | 52 |
| 528 Florence Ave | 0.48mi | 3/1.0 (-1) | 1,336 (-11%) | 4mo | $140,000 | $105 | 51 |
| 804 S Main St | 0.46mi | 4/1.5 | 1,280 (-15%) | 3mo | $164,883 | $129 | 49 |
| 8 Maple St | 0.67mi | 3/1.5 (-1) | 1,393 (-7%) | 6mo | $150,000 | $108 | 44 |
Match score weights: distance 35% · size 25% · config 20% · recency 20%. Top-matched comps best support the ARV.
Projected returns pro-forma
-0.26% appreciation · 3.0% rent growth · sell at horizon
- IRR
- -5.1%
- Equity multiple
- 0.76×
- Total profit
- $-7,954
- Equity at exit
- $33,240
- IRR
- 1.1%
- Equity multiple
- 1.11×
- Total profit
- $3,669
- Equity at exit
- $38,720
Cash invested: $33,572 (down + closing). Projections, not guarantees.
Landlord ↔ Tenant lean methodology
- Overall (STATE)
- 15 Strongly Tenant-Friendly
- State New York
- 15 Strongly Tenant-Friendly · D+10
- County
- — inherits STATE
- City
- — inherits STATE
ZIP-level market 14103
- Home prices YoY
- -0.1%
- Active inventory
- 58
- Price-to-rent
- 8.3×
Monthly cashflow live
- Estimated rent
- $1,200 medium interval (Pro) →
- Mortgage (P&I)
- −$629
- Tax from tax record
- −$318 /mo · $3,813/yr
- Insurance
- −$50
- HOA
- −$0
- Vacancy / Maint / Mgmt
- −$252
- Net cashflow
- $-48
Break-even live
Sensitivity live
| Price | -10% $19 | -5% $-15 | +0% $-48 | +5% $-82 | +10% $-116 |
|---|---|---|---|---|---|
| Rent | -10% $-143 | -5% $-96 | +0% $-48 | +5% $-1 | +10% $46 |
| Rate | -1.0pp $12 | -0.5pp $-18 | base $-48 | +0.5pp $-80 | +1.0pp $-111 |
UW: 25.0% down · 7.5% · 30yr · 1.5% tax · 5.0% vac · 8.0% maint · 8.0% mgmt
Financing live
Cash to close
- Down payment
- $29,975
- Closing costs
- $3,597
- Reserves months
- —
- Total cash needed
- —
Loan-product check · same deal, 3 products live
Conventional
25% down · 7.5% · 30yr
- Down + closing
- —
- Monthly P&I
- —
- Monthly cashflow
- —
- DSCR
- —
- Eligible?
- —
Personal DTI + credit; lowest rate.
DSCR
20% down · 8.5% · 30yr
- Down + closing
- —
- Monthly P&I
- —
- Monthly cashflow
- —
- DSCR
- —
- Eligible?
- —
No personal income docs; deal must DSCR.
Hard money
10% down · 12.0% · 12mo
- Down + closing
- —
- Monthly P&I
- —
- Monthly cashflow
- —
- DSCR
- —
- Eligible?
- —
Short-term bridge; refi at stabilization.
Rent comps 1 comps
| Address | Beds | Baths | Sqft | Rent | $/sqft | DOM | Units | Dist |
|---|---|---|---|---|---|---|---|---|
| 210 W Oak Orchard St Medina, NY | 3.0 | 1.5 | 2064 | $1,200 | $0.58 | 3d | 1 | 0.29mi |
Listing history 5 events
-
2026-06-07statusdays on market $119,900 Pending 4 DOM
-
2026-06-04days on market $119,900 Active 2 DOM
-
2026-06-03remarks 680-char remark
-
2026-06-01remarks 627-char remark
-
2026-06-01$119,900 Active 1 DOM
ⓘ Source: listings_history table (triggers on properties + properties_extension) + one-shot
backfill from property_details.listing_events for pre-trigger history.
Tax reassessment forecast NY · Partial reset (capped growth)
- Current annual tax
- $3,813 · $318/mo
- Projected year-2 tax
- $3,813 · $318/mo
- Expected delta
- $0/yr ($0/mo · -0.0%)
ⓘ Screening estimate from a state-policy table — verify with the county assessor before closing.
Climate risk First Street
- Flood 6/10 Major FEMA zone X · 69% chance over 30 yrs
- Wildfire 1/10 Low
- Heat 2/10 Low 7 d/yr ≥95°F today · 15 d/yr by 30 yrs out
- Wind 1/10 Low
- Air quality 2/10 Low 1 unhealthy d/yr today · 2 by 30 yrs out
Nearby sold comps map
Loading sold comps map…
Walkable amenities ~0.75 mi
Loading nearby amenities…
Taxation est. · year 1
- Rental income
- $14,400
- − Mortgage interest
- −$6,716
- − Property taxes
- −$3,813
- − Insurance
- −$600
- − Repairs & maintenance
- −$1,152
- − Management
- −$1,152
- − Depreciation
- −$3,488
- Taxable loss
- −$2,521
- Est. tax savings @ 24.0%
- +$605
- After-tax cash flow
- $23/yr
For passive investors: Depreciation is non-cash, so a rental often shows a tax loss while cash-flowing — sheltering income. Rental losses are passive: they offset passive income freely, and up to $25,000/yr can offset ordinary (W-2) income if you actively participate and your MAGI is under $100k (phasing out to $0 by $150k); unused losses carry forward. On sale, claimed depreciation is recaptured at up to 25%, and gains may owe capital-gains tax (a 1031 exchange can defer both). Figures are a year-1 estimate at your 24.0% rate — not tax advice; consult a CPA.
Schools (NCES district)
- District
- Medina Central School District
- NCES district ID
- 3618960
- Math proficiency
- 37% ▼ -12.00%
- Reading proficiency
- 38% ▼ -6.00%
- Median HH income
- $43,046
- Composite
- 31.76/100
- National rank
- #5901
- State rank
- #548 of 590 in NY
Livability — Medina
- Score
- 72/100
- State rank
- #344
- US rank
- #5814
Category grades
Schools grade is shown separately in the Schools card above.
Census & demographics
- Census place
- Medina, NY
- City population
- 10,836
- Population (ZIP)
- 10,836
Population outlook (Orleans County) Hauer SSP2
- Today (2025)
- 39,123 people
- By 2030
- 37,648 · -3.8%
- By 2040
- 34,432 · -12.0%
- By 2050
- 31,487 · -19.5%
- By 2075
- 26,544 · -32.2%
- By 2100
- 22,251 · -43.1%
Race, ethnicity, and origin ACS 2023
- Neighborhood character
- Predominantly White (83%)
- Race & ethnicity
- White 83% Hispanic / Latino 6% Two or more races 5% Black 4% Asian 2%
- Hispanic origin (detail)
- Mexican 4%
- Common ancestry
- Romanian 9% Slovak 2% Lithuanian 1%
- Foreign-born
- 4% · Canada, China
- Languages at home
- 89% English-only · Spanish 5% German/W. Germanic 3% Chinese 1%
Political lean MEDSL · Orleans
- 2024 margin
- Solid R (+40.5) · D 29.8% · R 70.2%
- 2008→2024 swing
- -21.8pp toward R · 2008: -18.7pp · 2024: -40.5pp
- All cycles
- 2024: R+40.5 2020: R+36.0 2016: R+43.4 2012: R+19.4 2008: R+18.7
Not yet ingested
- Civics
- —
Market trends
- HPI YoY
- ▼ -0.26%
- Current HPI
- 307.0342
- Rent YoY
- —
- Metro
- —
- State GDP YoY
- ▲ 2.60%
- F500 in state
- 92
Industry mix (Fortune 500 HQ in NY)
| Industry | F500 HQs | Revenue |
|---|---|---|
| Financial Services | 10 | $950B |
|
||
| Consumer Goods | 9 | $162B |
|
||
| Insurance | 4 | $225B |
|
||
| Telecommunications | 2 | $144B |
|
||
| Pharmaceuticals | 2 | $112B |
|
||
| Media / Entertainment | 2 | $69B |
|
||
Price history
1 event — show timeline
- 2026-06-01 Listed $119,900 WNYREIS
Property tax history
+8.5%/yrLatest (2025): $3,813 · +1.4% YoY. Source: county tax records.
Cash-flow waterfall
monthlySold comps — $/sqft
last 12 mo · ≤1 miLoading sold comps…