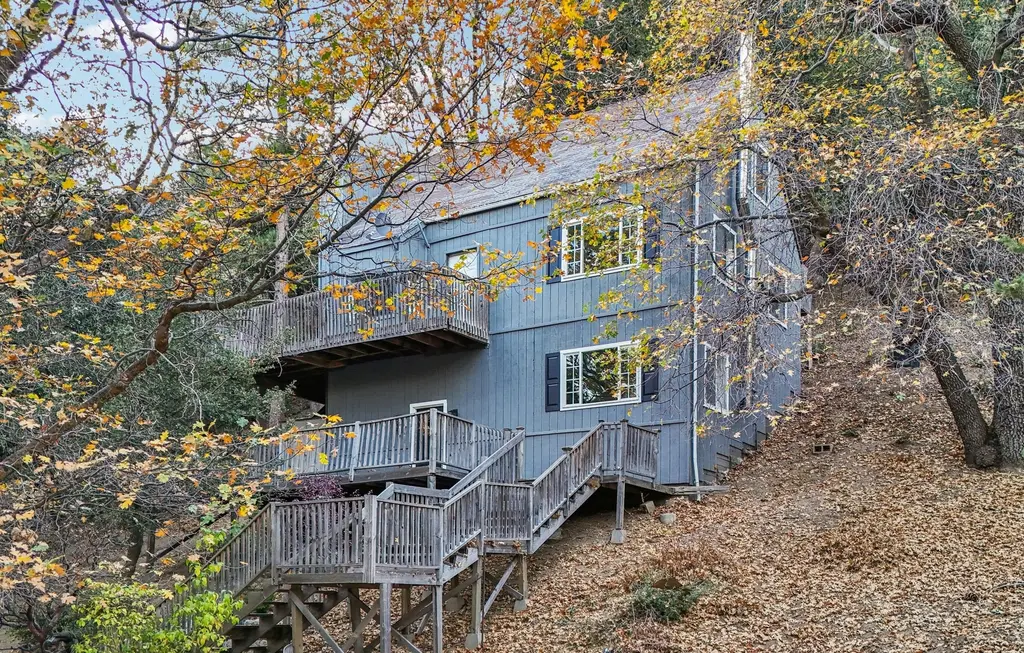
5866 Robin Oak Dr · Oak Glen, CA
Flood risk 1/10 · Minimal
- FEMA flood zone
- D
- Chance of flooding over 30 yrs
- 0.0%
- Est. flood insurance / yr
- $400 – $4,352
Fire risk 8/10 · Major
- Est. fire insurance / yr
- $659 – $1,223
Heat risk 2/10 · Minimal
- Hot days now (above 87°F)
- 10 days/yr
- Hot days in 30 yrs
- 29 days/yr
Wind risk 1/10 · Minimal
- Chance of severe wind over 30 yrs
- —
Air-quality risk 10/10 · Severe
- Unhealthy air days now
- 37 days/yr
- Unhealthy air days in 30 yrs
- 43 days/yr
Risk factors via First Street. Map © Google.
Why this score? — see what drove the C+ grade
The composite is a weighted blend of 9 inputs, each scored 0–100. Each bar is that input's sub-score; the figure is the points it added to the 100-point composite (weight × sub-score).
- Cash flow +20.2/30.0
- ARV discount +15.0/15.0
- Appreciation +6.7/10.0
- DSCR +6.4/10.0
- 1% rule +5.0/10.0
- Schools +2.9/10.0
- Rent growth +2.5/5.0
- Condition / age +2.5/5.0
- Livability +2.0/5.0
$249,900
🖨 Deal sheet 📄 Offer letter ✓ Due diligence
Listing remarks
Experience the magic of all four seasons in picturesque Angelus Oaks, where vibrant autumn colors, crisp mountain air, and peaceful winter snowfall create a truly unforgettable setting. Privately tucked away from the road among towering pines and majestic oaks, this three-story mountain retreat offers the perfect balance of comfort, character, and serene natural beauty. The welcoming entry level features a cozy family room centered around a charming wood-burning stove, creating the ideal space to relax after a day outdoors. This level also includes a convenient laundry area and additional storage, thoughtfully designed for practical mountain living. Central heating and the wood-burning stov
Key facts
- Wraparound deck
- Wood burning stove
- 6,000 sq ft lot
Tags
Property features AI
Finance
- Financial info: Special assessments
- HOA & community: Rural community
Exterior
- Parking: Uncovered parking for 4 vehicles; Paved driveway (asphalt)
- Utilities: Public (district) water; Public sewer (connected/available); Electricity on property (connected/available); Propane available
- Home design: House; Three or more levels; Entry at level 1
- Construction: Composition roof; No common walls; One unit; Year built per assessor
- Exterior features: Deck/patio; Fenced (see remarks); No pool; Secluded lot, up slope from street; Paved driveway and paved road frontage; Access via county road; Has view
Interior
- Kitchen: Remodeled kitchen; Kitchen open to family room; Free-standing range; Eating area
- Bedrooms: Two main-level bedrooms
- Flooring: See remarks
- Bathrooms: One full bathroom (remodeled) with shower-in-tub
- Heating & cooling: Fireplace heating; Fireplaces in living room and family room
- Interior features: Balcony; Living room balcony; Built-ins; High ceilings (9+ feet); Cathedral/vaulted ceilings; Open floor plan; Storage space; Two staircases; Double pane windows; Two or more access exits
- Laundry & utility: Dedicated laundry room
Neighborhood map
What this means for you Summary
Snapshot
- This is a 2-bed/1.0-bath single-family listed at $250k.
Deal economics
- At list price, monthly cash flow is $316 ($4k/yr) — positive.
- The deal already cash-flows at list — no discount required.
- Meets the 1% rule at list price ($3k rent vs $250k).
- Recommended offer: $246k (1.5% below list) — sets the bar for market timing.
- Cap rate 7.8% vs local median 3.6% in Oak Glen — top-decile yield for the area; either an underpriced asset or a hidden risk that comps aren't pricing in. Stress-test before assuming the spread holds.
Location & tenants
- Location reads 40/100 on livability (#1,386 in CA) — a working-class tenant base; expect higher turnover. Strengths: housing A+, crime A; Watch: schools D, amenities F, commute F.
- Bear Valley Unified (town): math 26% / reading 43% proficiency, ranked #289 of 517 in CA (top 56%) — families likely to look elsewhere, expect single-tenant / working-renter base with shorter leases.
- Market conditions: 33 active listings in the ZIP; 5,458 units permitted in San Bernardino County in 2024 (1,500 in 5+ unit buildings).
Forward outlook
- In year one you build about $10k of equity ($2k loan paydown + $9k appreciation (3.5% local appreciation)).
- San Bernardino County population projected at +15% by 2050 — modest demand growth; plan on rents tracking national, not racing it.
- At projected returns (3.5% appreciation + 3.0% rent growth), your $70k cash investment doubles in ~5 years — after that, you're playing with house money.
- By year 4, paydown + projected appreciation supports a ~$35k cash-out refi (75% LTV) — recoverable capital for the next deal without selling this one.
Negotiation context
- It's been on market 27 days — a 2% lower offer ($246k) is reasonable based on typical stale-listing flexibility.
- 4 sale attempts since 22y ago with the ask held roughly flat each time — persistent listings suggest the price (not the market) is what's stuck; bring a comps-based counter.
- Current owner paid $165k; list at $250k implies a 51% gain — meaningful room to come down on a strong offer.
Risks & watch-outs
- Climate carrying-cost: severe wildfire risk — expect insurance premiums to compound above CPI over the hold.
Questions for the listing agent
- Is there a deadline driving the sale (1031 exchange, divorce, estate, relocation)? That informs how much negotiation room exists.
- Schools are D-rated, which usually means shorter tenancies and higher turnover. Who's the typical renter profile here, and what's been the actual vacancy rate?
- What's the average days-on-market for RENTAL listings here right now (not sales)? A rising rental-DOM trend means longer vacancies and softer asking-rent achievability than the comps imply.
- What's the recent tenant-quality profile in this submarket — average credit score on applications, eviction rate, late-payment / NSF rate, and stable-employment percentage? A property-management company in the area should have these aggregated.
- How much new for-sale + rental construction is in the pipeline within 1–3 miles? Heavy new supply typically softens prices + rents 12–24 months out; constrained supply supports both.
Investment metrics
- 1% rule
- 1.00% ✓
- Cap rate
- 7.81%
- Cash-on-cash
- 5.43%
- DSCR
- 1.24
- GRM
- 8.3
CMA / ARV
- ARV (median comp)
- $390,820
- List price
- $249,900
- Delta
- -23.52%
- Verdict
- UNDERPRICED
- Comps
- 20 within 1.0 mi
Show comp detail 3 sales within ~0.75 mi
| Address | Dist | Beds/Ba | Sqft | Sold | Price | $/sf | Match |
|---|---|---|---|---|---|---|---|
| 6034 Mountain Home Creek Rd | 0.19mi | 2/1.0 | 1,323 (-1%) | 21mo | $385,000 | $291 | 73 |
| 6069 Maple | 0.29mi | 3/1.0 (+1) | 1,518 (+14%) | 1mo | $383,000 | $252 | 58 |
| 6301 Cedar Ave | 0.59mi | 2/2.0 | 1,452 (+9%) | 4mo | $465,000 | $320 | 51 |
Match score weights: distance 35% · size 25% · config 20% · recency 20%. Top-matched comps best support the ARV.
Projected returns pro-forma
3.46% appreciation · 3.0% rent growth · sell at horizon
- IRR
- 13.7%
- Equity multiple
- 1.81×
- Total profit
- $56,333
- Equity at exit
- $118,837
- IRR
- 15.3%
- Equity multiple
- 3.36×
- Total profit
- $164,946
- Equity at exit
- $188,341
Cash invested: $69,972 (down + closing). Projections, not guarantees.
Landlord ↔ Tenant lean methodology
- Overall (STATE)
- 18 Strongly Tenant-Friendly
- State California
- 18 Strongly Tenant-Friendly · D+13
- County
- — inherits STATE
- City
- — inherits STATE
ZIP-level market 92305
- Home prices YoY
- 1.1%
- Active inventory
- 33
- Price-to-rent
- 8.3×
Monthly cashflow live
- Estimated rent
- $2,504 medium interval (Pro) →
- Mortgage (P&I)
- −$1,311
- Tax from tax record
- −$247 /mo · $2,962/yr
- Insurance
- −$104
- HOA
- −$0
- Vacancy / Maint / Mgmt
- −$526
- Net cashflow
- $316
Break-even live
UW: 25.0% down · 7.5% · 30yr · 1.5% tax · 5.0% vac · 8.0% maint · 8.0% mgmt
Financing live
Cash to close
- Down payment
- $62,475
- Closing costs
- $7,497
- Reserves months
- —
- Total cash needed
- —
Loan-product check · same deal, 3 products live
Conventional
25% down · 7.5% · 30yr
- Down + closing
- —
- Monthly P&I
- —
- Monthly cashflow
- —
- DSCR
- —
- Eligible?
- —
Personal DTI + credit; lowest rate.
DSCR
20% down · 8.5% · 30yr
- Down + closing
- —
- Monthly P&I
- —
- Monthly cashflow
- —
- DSCR
- —
- Eligible?
- —
No personal income docs; deal must DSCR.
Hard money
10% down · 12.0% · 12mo
- Down + closing
- —
- Monthly P&I
- —
- Monthly cashflow
- —
- DSCR
- —
- Eligible?
- —
Short-term bridge; refi at stabilization.
Listing history 24 events
-
2026-06-18days on market $249,900 Active 27 DOM
-
2026-06-17days on market $249,900 Active 26 DOM
-
2026-06-16days on market $249,900 Active 25 DOM
-
2026-06-15days on market $249,900 Active 24 DOM
-
2026-06-13days on market $249,900 Active 22 DOM
-
2026-06-13days on market $249,900 Active 21 DOM
-
2026-06-09days on market $249,900 Active 18 DOM
-
2026-06-08days on market $249,900 Active 17 DOM
-
2026-06-07days on market $249,900 Active 16 DOM
-
2026-06-04days on market $249,900 Active 13 DOM
-
2026-06-03days on market $249,900 Active 12 DOM
-
2026-06-02days on market $249,900 Active 11 DOM
-
2026-06-01days on market $249,900 Active 10 DOM
-
2026-05-31days on market $249,900 Active 9 DOM
-
2026-03-19$298,900 Active 1539-char remark
-
2026-03-06historical
-
2025-12-09price $299,900
-
2025-11-13$349,900 Active
-
2004-06-08soldstatus $165,000
-
2004-06-08soldstatus $165,000
-
2004-05-03$175,000
-
1983-02-11soldstatus $11,000
-
1981-03-05soldstatus $10,000
-
1981-03-05soldstatus $10,000
ⓘ Source: listings_history table (triggers on properties + properties_extension) + one-shot
backfill from property_details.listing_events for pre-trigger history.
Tax reassessment forecast CA · Resets to sale price
- Current annual tax
- $2,962 · $247/mo
- Projected year-2 tax
- $2,962 · $247/mo
- Expected delta
- $0/yr ($0/mo · 0.0%)
ⓘ Screening estimate from a state-policy table — verify with the county assessor before closing.
Climate risk First Street
- Flood 1/10 Low FEMA zone D · 0% chance over 30 yrs
- Wildfire 8/10 Severe
- Heat 2/10 Low 10 d/yr ≥87°F today · 29 d/yr by 30 yrs out
- Wind 1/10 Low
- Air quality 10/10 Extreme 37 unhealthy d/yr today · 43 by 30 yrs out
Nearby sold comps map
Loading sold comps map…
Walkable amenities ~0.75 mi
Loading nearby amenities…
Taxation est. · year 1
- Rental income
- $30,043
- − Mortgage interest
- −$13,998
- − Property taxes
- −$2,962
- − Insurance
- −$1,250
- − Repairs & maintenance
- −$2,403
- − Management
- −$2,403
- − Depreciation
- −$7,270
- Taxable loss
- −$244
- Est. tax savings @ 24.0%
- +$58
- After-tax cash flow
- $3,855/yr
For passive investors: Depreciation is non-cash, so a rental often shows a tax loss while cash-flowing — sheltering income. Rental losses are passive: they offset passive income freely, and up to $25,000/yr can offset ordinary (W-2) income if you actively participate and your MAGI is under $100k (phasing out to $0 by $150k); unused losses carry forward. On sale, claimed depreciation is recaptured at up to 25%, and gains may owe capital-gains tax (a 1031 exchange can defer both). Figures are a year-1 estimate at your 24.0% rate — not tax advice; consult a CPA.
Schools (NCES district)
- District
- Bear Valley Unified
- NCES district ID
- 0604230
- Math proficiency
- 26% ▼ -4.00%
- Reading proficiency
- 43% ▼ -4.00%
- Median HH income
- $42,222
- Composite
- 29.12/100
- National rank
- #6588
- State rank
- #289 of 517 in CA
Livability — Oak Glen
- Score
- 40/100
- State rank
- #1386
- US rank
- #27266
Category grades
Schools grade is shown separately in the Schools card above.
Census & demographics
- Population (ZIP)
- 371
Population outlook (San Bernardino County) Hauer SSP2
- Today (2025)
- 2,300,329 people
- By 2030
- 2,378,907 · +3.4%
- By 2040
- 2,523,137 · +9.7%
- By 2050
- 2,642,388 · +14.9%
- By 2075
- 2,880,769 · +25.2%
- By 2100
- 2,909,436 · +26.5%
Race, ethnicity, and origin ACS 2023
- Neighborhood character
- Predominantly White (87%)
- Race & ethnicity
- White 87% Two or more races 6% Hispanic / Latino 6% Asian 2%
- Hispanic origin (detail)
- Mexican 4%
- Common ancestry
- Scotch-Irish 5% Iranian 3% Russian 2%
- Foreign-born
- 5%
- Languages at home
- 79% English-only · Russian/Polish/Slavic 21%
Political lean MEDSL · San Bernardino
- 2024 margin
- Toss-up / Even · D 47.5% · R 49.7% · Other 2.8%
- 2008→2024 swing
- -8.5pp toward R · 2008: 6.3pp · 2024: -2.1pp
- All cycles
- 2024: R+2.1 2020: D+10.7 2016: D+9.8 2012: D+5.4 2008: D+6.3
Not yet ingested
- Civics
- —
Market trends
- HPI YoY
- ▲ 3.46%
- Current HPI
- 307.1726
- Rent YoY
- —
- Metro
- —
- State GDP YoY
- ▲ 3.21%
- F500 in state
- 116
Industry mix (Fortune 500 HQ in CA)
| Industry | F500 HQs | Revenue |
|---|---|---|
| Technology | 27 | $1,492B |
|
||
| Financial Services | 3 | $174B |
|
||
| Retail | 3 | $44B |
|
||
| Insurance | 3 | $26B |
|
||
| Media / Entertainment | 2 | $115B |
|
||
| Pharmaceuticals / Biotech | 2 | $62B |
|
||
Price history
+2399.0% since first listed12 events — show timeline
- 2026-05-22 Listed $249,900 CRMLS
- 2026-05-20 Listing Removed — CRMLS
- 2026-03-19 Listed $298,900 CRMLS
- 2026-03-06 Listing Removed — CRMLS
- 2025-12-09 Price Changed $299,900 CRMLS
- 2025-11-13 Listed $349,900 CRMLS
- 2004-06-08 Sold (Public Records) $165,000 Public Records
- 2004-06-08 Sold (MLS) $165,000 CRMLS
- 2004-05-03 Listed $175,000 CRMLS
- 1983-02-11 Sold (Public Records) $11,000 Public Records
- 1981-03-05 Sold (Public Records) $10,000 Public Records
- 1981-03-05 Sold (Public Records) $10,000 Public Records
Property tax history
+2.3%/yrLatest (2025): $2,962 · +3.1% YoY. Source: county tax records.
Cash-flow waterfall
monthlySold comps — $/sqft
last 12 mo · ≤1 miLoading sold comps…