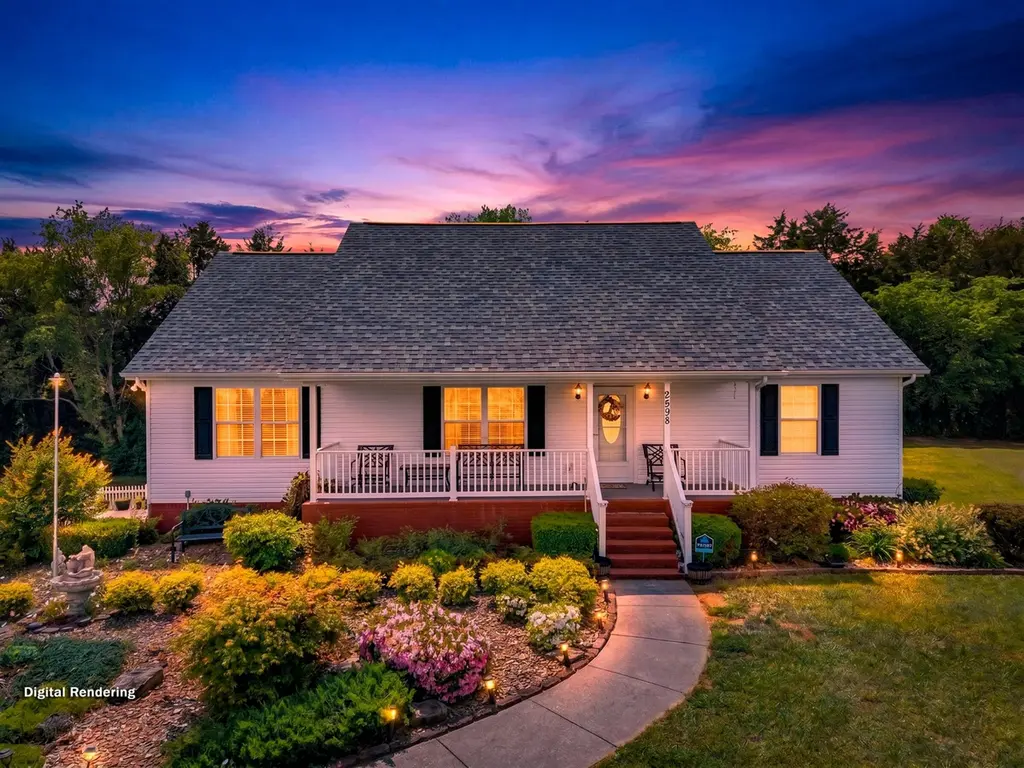
2598 Plantation Dr · Russellville, TN
Flood risk 1/10 · Minimal
- FEMA flood zone
- X (unshaded)
- Chance of flooding over 30 yrs
- 0.0%
- Est. flood insurance / yr
- $473 – $860
Fire risk 5/10 · Moderate
- Est. fire insurance / yr
- $949 – $1,763
Heat risk 5/10 · Moderate
- Hot days now (above 102°F)
- 7 days/yr
- Hot days in 30 yrs
- 21 days/yr
Wind risk 2/10 · Minimal
- Chance of severe wind over 30 yrs
- 1.0%
Air-quality risk 4/10 · Minor
- Unhealthy air days now
- 5 days/yr
- Unhealthy air days in 30 yrs
- 6 days/yr
Risk factors via First Street. Map © Google.
Why this score? — see what drove the F grade
The composite is a weighted blend of 9 inputs, each scored 0–100. Each bar is that input's sub-score; the figure is the points it added to the 100-point composite (weight × sub-score).
- Appreciation +10.0/10.0
- Cash flow +4.2/30.0
- Schools +2.6/10.0
- Rent growth +2.5/5.0
- Livability +2.5/5.0
- Condition / age +2.5/5.0
- 1% rule +0.0/10.0
- DSCR +0.0/10.0
- ARV discount +0.0/15.0
$374,900
🖨 Deal sheet 📄 Offer letter ✓ Due diligence
Listing remarks
Welcome to this beautifully maintained 3-bedroom, 2-bath ranch-style home that perfectly blends comfort, functionality, and scenic charm. Inside, you'll find original hardwood floors that add warmth and character, complemented by a spacious living room featuring elevated ceilings that create an open, airy feel. The kitchen is both stylish and practical, offering granite countertops, ample cabinetry, and a convenient pantry just steps away. The thoughtfully designed layout includes a private master suite situated on its own side of the home, complete with a walk-in closet for added comfort and storage. The additional bedrooms are generously sized, ideal for family, guests, or a home office.
Key facts
- 0.52 acre lot
- 3 garage spots
- Built 2007
Property features AI
Exterior
- Parking: Attached garage with 3 spaces; Asphalt driveway
- Utilities: Public water; Septic tank sewer; Electricity connected (circuit breakers)
- Home design: Single-family residence; One level; One story
- Construction: Block, brick, and vinyl siding construction; Block foundation; Asphalt shingle roof; Finished partial basement with exterior, walk-out and walk-up access
- Exterior features: Covered patio/porch; Deck; Front porch; Rain gutters; Storage structure; No pool
Interior
- Kitchen: Electric cooktop; Electric oven; Electric range; Microwave; Dishwasher; Refrigerator; Granite counters; Pantry; Breakfast bar
- Bedrooms: Three main-level bedrooms
- Flooring: Hardwood; Ceramic tile; Tile
- Bathrooms: Two full bathrooms; One half bathroom; Two main-level bathrooms
- Heating & cooling: Heat pump heating; Central air; Ceiling fan cooling
- Interior features: Breakfast bar; Ceiling fans; Granite counters; Pantry; Walk-in closets; Double pane windows
- Laundry & utility: Washer and dryer included; Laundry closet on main level; Electric water heater
Neighborhood map
What this means for you Summary
Snapshot
- This is a 3-bed/2.0-bath single-family listed at $375k.
Deal economics
- At list price, monthly cash flow is $-1k ($-12k/yr) — negative.
- To cash-flow at today's rent, offer at most $195k (48.0% below list).
- To meet the 1% rule (rent ≥ 1% of price), the offer needs to be $151k (59.6% below list).
- Recommended offer: $151k (59.6% below list) — sets the bar for 1% rule.
Location & tenants
- Location reads: area grade F — affects rentability + tenant quality, not the cash-flow math above.
- Hamblen County (urban): math 31% / reading 30% proficiency, ranked #57 of 139 in TN (top 41%) — families likely to look elsewhere, expect single-tenant / working-renter base with shorter leases.
- Market conditions: 55 active listings in the ZIP; 298 units permitted in Hamblen County in 2024 (48 in 5+ unit buildings).
Forward outlook
- In year one you build about $40k of equity ($3k loan paydown + $37k appreciation (10.0% local appreciation)).
- By year 2, paydown + projected appreciation supports a ~$64k cash-out refi (75% LTV) — recoverable capital for the next deal without selling this one.
Negotiation context
- It's been on market 52 days — a 3% lower offer ($364k) is reasonable based on typical stale-listing flexibility.
- 2 sale attempts with the ask held roughly flat each time — persistent listings suggest the price (not the market) is what's stuck; bring a comps-based counter.
- Current owner paid $174k; list at $375k implies a 115% gain — meaningful room to come down on a strong offer.
Risks & watch-outs
- Climate carrying-cost: moderate wildfire risk; extreme-heat days projected 7→21/yr by 2055 (HVAC capex compounding) — expect insurance premiums to compound above CPI over the hold.
Questions for the listing agent
- What do current leases actually rent for vs. the listed asking? Can we see a recent rent roll and the last 12 months of T-12 income?
- It's been on market 52 days. Have you received any prior offers? Is the seller open to a 60% concession, seller financing, or rate buy-down credit?
- Is there a deadline driving the sale (1031 exchange, divorce, estate, relocation)? That informs how much negotiation room exists.
- The area grade is low — what's the realistic commute time and amenity access for the typical tenant pool here? Any planned neighborhood developments (good or bad) we should know about?
- What's the average days-on-market for RENTAL listings here right now (not sales)? A rising rental-DOM trend means longer vacancies and softer asking-rent achievability than the comps imply.
- What's the recent tenant-quality profile in this submarket — average credit score on applications, eviction rate, late-payment / NSF rate, and stable-employment percentage? A property-management company in the area should have these aggregated.
- How much new for-sale + rental construction is in the pipeline within 1–3 miles? Heavy new supply typically softens prices + rents 12–24 months out; constrained supply supports both.
Investment metrics
- 1% rule
- 0.40% ✗
- Cap rate
- 3.03%
- Cash-on-cash
- -11.65%
- DSCR
- 0.48
- GRM
- 20.6
CMA / ARV
- ARV (median comp)
- $321,062
- List price
- $374,900
- Delta
- 16.77%
- Verdict
- OVERPRICED
- Comps
- 20 within 1.0 mi
Show comp detail 11 sales within ~0.75 mi
| Address | Dist | Beds/Ba | Sqft | Sold | Price | $/sf | Match |
|---|---|---|---|---|---|---|---|
| 2599 Plantation Dr | 0.05mi | 3/2.0 | 1,704 (+11%) | 0mo | $328,000 | $192 | 78 |
| 5556 Denton Dr | 0.27mi | 3/2.0 | 1,456 (-5%) | 1mo | $178,000 | $122 | 78 |
| 2573 Plantation Dr | 0.07mi | 3/2.0 | 1,594 (+4%) | 22mo | $367,500 | $231 | 71 |
| 5624 Remmington Dr | 0.58mi | 3/2.0 | 1,500 (-2%) | 14mo | $330,000 | $220 | 58 |
| 1443 Lonesome Oak Ln | 0.70mi | 3/2.0 | 1,652 (+8%) | 4mo | $320,000 | $194 | 51 |
| 1607 Weatherby Ct | 0.63mi | 3/2.0 | 1,344 (-12%) | 2mo | $287,900 | $214 | 48 |
| 1608 Weatherby Ct | 0.65mi | 3/2.0 | 1,486 (-3%) | 23mo | $325,000 | $219 | 46 |
| 2545 Phillip Ln | 0.57mi | 3/2.0 | 1,635 (+7%) | 21mo | $270,000 | $165 | 44 |
| 5659 Browning Way | 0.61mi | 3/2.0 | 1,744 (+14%) | 7mo | $369,900 | $212 | 42 |
| 2511 Brandi Dr | 0.53mi | 3/2.0 | 1,338 (-12%) | 15mo | $323,000 | $241 | 42 |
| 2324 Old Ford Rd | 0.71mi | 3/1.5 | 1,412 (-8%) | 19mo | $268,000 | $190 | 36 |
Match score weights: distance 35% · size 25% · config 20% · recency 20%. Top-matched comps best support the ARV.
Projected returns pro-forma
10.0% appreciation · 3.0% rent growth · sell at horizon
- IRR
- 16.1%
- Equity multiple
- 2.33×
- Total profit
- $139,092
- Equity at exit
- $337,740
- IRR
- 15.5%
- Equity multiple
- 5.38×
- Total profit
- $460,211
- Equity at exit
- $728,348
Cash invested: $104,972 (down + closing). Projections, not guarantees.
Landlord ↔ Tenant lean methodology
- Overall (STATE)
- 87 Strongly Landlord-Friendly
- State Tennessee
- 87 Strongly Landlord-Friendly · R+13
- County
- — inherits STATE
- City
- — inherits STATE
ZIP-level market 37860
- Home prices YoY
- 4.9%
- Active inventory
- 55
- Price-to-rent
- 20.6×
Monthly cashflow live
- Estimated rent
- $1,514 medium interval (Pro) →
- Mortgage (P&I)
- −$1,966
- Tax from tax record
- −$93 /mo · $1,114/yr
- Insurance
- −$156
- HOA
- −$0
- Vacancy / Maint / Mgmt
- −$318
- Net cashflow
- $-1,019
Break-even live
UW: 25.0% down · 7.5% · 30yr · 1.5% tax · 5.0% vac · 8.0% maint · 8.0% mgmt
Financing live
Cash to close
- Down payment
- $93,725
- Closing costs
- $11,247
- Reserves months
- —
- Total cash needed
- —
Loan-product check · same deal, 3 products live
Conventional
25% down · 7.5% · 30yr
- Down + closing
- —
- Monthly P&I
- —
- Monthly cashflow
- —
- DSCR
- —
- Eligible?
- —
Personal DTI + credit; lowest rate.
DSCR
20% down · 8.5% · 30yr
- Down + closing
- —
- Monthly P&I
- —
- Monthly cashflow
- —
- DSCR
- —
- Eligible?
- —
No personal income docs; deal must DSCR.
Hard money
10% down · 12.0% · 12mo
- Down + closing
- —
- Monthly P&I
- —
- Monthly cashflow
- —
- DSCR
- —
- Eligible?
- —
Short-term bridge; refi at stabilization.
Listing history 19 events
-
2026-06-19days on market $374,900 Active 52 DOM
-
2026-06-18days on market $374,900 Active 51 DOM
-
2026-06-17days on market $374,900 Active 50 DOM
-
2026-06-16days on market $374,900 Active 49 DOM
-
2026-06-15days on market $374,900 Active 48 DOM
-
2026-06-14days on market $374,900 Active 46 DOM
-
2026-06-12days on market $374,900 Active 45 DOM
-
2026-06-09days on market $374,900 Active 42 DOM
-
2026-06-09status $374,900 Active 41 DOM
-
2026-06-08days on market $374,900 Active Under Contract 41 DOM
-
2026-06-07days on market $374,900 Active Under Contract 40 DOM
-
2026-06-05days on market $374,900 Active Under Contract 37 DOM
-
2026-06-02days on market $374,900 Active Under Contract 35 DOM
-
2026-06-01days on market $374,900 Active Under Contract 34 DOM
-
2026-05-31days on market $374,900 Active Under Contract 33 DOM
-
2026-05-30days on market $374,900 Active Under Contract 32 DOM
-
2026-05-15historical Active Under Contract 1431-char remark
-
2026-04-24$374,900 Active 1431-char remark
-
2007-04-11soldstatus $174,000
ⓘ Source: listings_history table (triggers on properties + properties_extension) + one-shot
backfill from property_details.listing_events for pre-trigger history.
Tax reassessment forecast TN · Resets to sale price
- Current annual tax
- $1,114 · $93/mo
- Projected year-2 tax
- $2,662 · $222/mo
- Expected delta
- +$1,548/yr (+$129/mo · 138.9%)
ⓘ Screening estimate from a state-policy table — verify with the county assessor before closing.
Climate risk First Street
- Flood 1/10 Low FEMA zone X (unshaded) · 0% chance over 30 yrs
- Wildfire 5/10 Major
- Heat 5/10 Major 7 d/yr ≥102°F today · 21 d/yr by 30 yrs out
- Wind 2/10 Low 100% chance of damaging wind over 30 yrs
- Air quality 4/10 Moderate 5 unhealthy d/yr today · 6 by 30 yrs out
Nearby sold comps map
Loading sold comps map…
Walkable amenities ~0.75 mi
Loading nearby amenities…
Taxation est. · year 1
- Rental income
- $18,173
- − Mortgage interest
- −$21,000
- − Property taxes
- −$1,114
- − Insurance
- −$1,874
- − Repairs & maintenance
- −$1,454
- − Management
- −$1,454
- − Depreciation
- −$10,906
- Taxable loss
- −$19,630
- Est. tax savings @ 24.0%
- +$4,711
- After-tax cash flow
- $-7,513/yr
For passive investors: Depreciation is non-cash, so a rental often shows a tax loss while cash-flowing — sheltering income. Rental losses are passive: they offset passive income freely, and up to $25,000/yr can offset ordinary (W-2) income if you actively participate and your MAGI is under $100k (phasing out to $0 by $150k); unused losses carry forward. On sale, claimed depreciation is recaptured at up to 25%, and gains may owe capital-gains tax (a 1031 exchange can defer both). Figures are a year-1 estimate at your 24.0% rate — not tax advice; consult a CPA.
Schools (NCES district)
- District
- Hamblen County
- NCES district ID
- 4700001
- Math proficiency
- 31% ▼ -5.00%
- Reading proficiency
- 30% ▼ -4.00%
- Median HH income
- $39,361
- Composite
- 25.61/100
- National rank
- #7412
- State rank
- #57 of 139 in TN
Livability — Russellville
No livability data for this city. (Only ~50 U.S. cities are tracked.)
Census & demographics
- Population (ZIP)
- 3,739
Population outlook (Hamblen County) Hauer SSP2
- Today (2025)
- 65,185 people
- By 2030
- 65,707 · +0.8%
- By 2040
- 66,189 · +1.5%
- By 2050
- 65,798 · +0.9%
- By 2075
- 62,642 · -3.9%
- By 2100
- 55,702 · -14.5%
Race, ethnicity, and origin ACS 2023
- Neighborhood character
- Predominantly White (93%)
- Race & ethnicity
- White 93% Black 3% Hispanic / Latino 2% Two or more races 2%
- Common ancestry
- Slovak 2% Serbian 2% Lithuanian 1%
- Foreign-born
- 2% · Canada
- Languages at home
- 98% English-only · Spanish 2%
Political lean MEDSL · Hamblen
- 2024 margin
- Solid R (+58.9) · D 20.1% · R 79.0%
- 2008→2024 swing
- -20.5pp toward R · 2008: -38.4pp · 2024: -58.9pp
- All cycles
- 2024: R+58.9 2020: R+54.0 2016: R+57.2 2012: R+46.4 2008: R+38.4
Not yet ingested
- Civics
- —
Market trends
- HPI YoY
- ▲ 16.07%
- Current HPI
- 341.0227
- Rent YoY
- —
- Metro
- —
- State GDP YoY
- ▲ 2.78%
- F500 in state
- 22
Industry mix (Fortune 500 HQ in TN)
| Industry | F500 HQs | Revenue |
|---|---|---|
| Healthcare | 3 | $91B |
|
||
| Retail | 3 | $72B |
|
||
| Transportation / Logistics | 1 | $88B |
|
||
| Paper / Packaging | 1 | $19B |
|
||
| Insurance | 1 | $13B |
|
||
| Energy | 1 | $12B |
|
||
Price history
+115.5% since first listed4 events — show timeline
- 2026-06-09 Relisted — LAAR
- 2026-05-15 Contingent — LAAR
- 2026-04-24 Listed $374,900 LAAR
- 2007-04-11 Sold (Public Records) $174,000 Public Records
Property tax history
+3.7%/yrLatest (2025): $1,114 · +18.1% YoY. Source: county tax records.
Cash-flow waterfall
monthlySold comps — $/sqft
last 12 mo · ≤1 miLoading sold comps…