 🏗️ New Construction
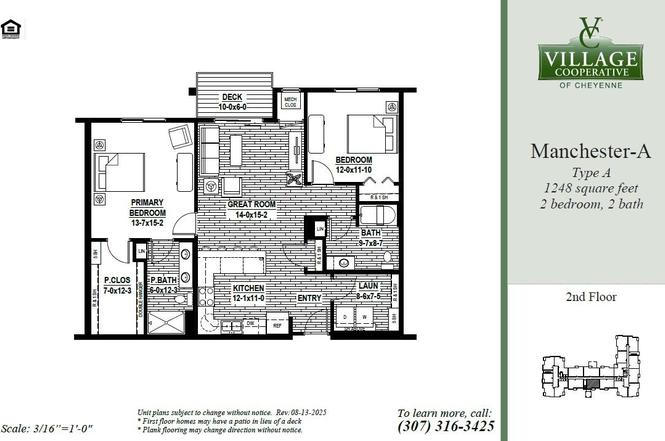
Manchester-A (Handicap Adaptable) Plan · Cheyenne, WY
Flood risk 1/10 · Minimal
- FEMA flood zone
- X (unshaded)
- Chance of flooding over 30 yrs
- 0.0%
- Est. flood insurance / yr
- $507 – $1,088
Fire risk 7/10 · Major
- Est. fire insurance / yr
- $564 – $1,046
Heat risk 2/10 · Minimal
- Hot days now (above 88°F)
- 7 days/yr
- Hot days in 30 yrs
- 20 days/yr
Wind risk 2/10 · Minimal
- Chance of severe wind over 30 yrs
- —
Air-quality risk 3/10 · Minor
- Unhealthy air days now
- 2 days/yr
- Unhealthy air days in 30 yrs
- 2 days/yr
Risk factors via First Street. Map © Google.
Why this score? — see what drove the F grade
The composite is a weighted blend of 9 inputs, each scored 0–100. Each bar is that input's sub-score; the figure is the points it added to the 100-point composite (weight × sub-score).
- ARV discount +7.5/15.0
- Rent growth +4.2/5.0
- Livability +4.2/5.0
- Cash flow +4.0/30.0
- Schools +3.9/10.0
- Condition / age +2.5/5.0
- 1% rule +0.2/10.0
- DSCR +0.0/10.0
- Appreciation +0.0/10.0
$201,000
🖨 Deal sheet (PDF) 📄 Offer letter ✓ Due diligence
Key facts
- Parking
- Listed 144 days
Property features AI
Finance
- Financial info: List price $201,000
Exterior
- Parking: 1 parking space
- Home design: New construction plan; Single-story (plan name indicates adaptable design)
- Construction: Manchester-A plan (handicap adaptable)
- Exterior features: Located near Powderhouse Road and Melton Street, Cheyenne, WY
Interior
- Bedrooms: 2 bedrooms
- Bathrooms: 2 full bathrooms
- Interior features: Plan: Manchester-A (Handicap Adaptable); Active listing status
Neighborhood map
What this means for you Summary
Snapshot
- This is a 2-bed/2.0-bath townhouse listed at $201k.
Deal economics
- At list price, monthly cash flow is $-963 ($-12k/yr) — negative.
- The deal already cash-flows at list — no discount required.
- To meet the 1% rule (rent ≥ 1% of price), the offer needs to be $177k (11.8% below list).
- Recommended offer: $177k (12.0% below list) — sets the bar for market timing.
Location & tenants
- Location reads 83/100 on livability (#2 in WY, #947 nationally) — a professional / high-income tenant draw. Strengths: commute A+, cost of living A+, housing A+; Watch: crime D.
- Laramie County School District #1 (urban): math 41% / reading 48% proficiency, ranked #33 of 41 in WY (top 80%) — families likely to look elsewhere, expect single-tenant / working-renter base with shorter leases.
- Zoned schools: Anderson Elementary (math 57% / reading 67%, grade B, #30 of 151 statewide, top 26%, 327 students, 30% FRL); Carey Junior High School (math 43% / reading 50%, grade D+, #39 of 55 statewide, top 70%, 861 students, 38% FRL); East High School (math 43% / reading 43%, grade F, #46 of 75 statewide, top 61%, 1,513 students, 30% FRL) — zoned schools at 33% FRL track the district average.
- Market conditions: Rents rising fast (+6.7%/yr); 555 active listings in the ZIP; solid renter incomes; 485 units permitted in Laramie County in 2024 (104 in 5+ unit buildings).
Forward outlook
- Local home prices are declining (-3.0%/yr); year-one equity from $2k of loan paydown is wiped out by about $10k of value loss. Plan a longer hold.
- Laramie County population projected at +26% by 2050 — long-run rental-demand tailwind backs the buy-and-hold thesis.
Negotiation context
- It's been on market 144 days — a 12% lower offer ($177k) is reasonable based on typical stale-listing flexibility.
Risks & watch-outs
- Watch-outs: property tax is 2.6% of price.
- Climate carrying-cost: major wildfire risk — expect insurance premiums to compound above CPI over the hold.
Questions for the listing agent
- What do current leases actually rent for vs. the listed asking? Can we see a recent rent roll and the last 12 months of T-12 income?
- It's been on market 144 days. Have you received any prior offers? Is the seller open to a 12% concession, seller financing, or rate buy-down credit?
- Property tax is high relative to price — has the assessment been appealed recently, and will the sale trigger a re-assessment?
- Why hasn't it sold? Are there any deal-killer items the seller is aware of (foundation, flood, title, zoning, code violations)?
- Is there a deadline driving the sale (1031 exchange, divorce, estate, relocation)? That informs how much negotiation room exists.
- Schools are B-rated — typically a magnet for longer-tenancy family renters. What's the average tenant stay here, and is there a school-zone premium baked into asking?
- Crime grade is D in this area — have there been break-ins, vandalism, or insurance claims at this property in the last 3 years? What carrier currently insures it and at what premium?
- The area grade is low — what's the realistic commute time and amenity access for the typical tenant pool here? Any planned neighborhood developments (good or bad) we should know about?
- What's the average days-on-market for RENTAL listings here right now (not sales)? A rising rental-DOM trend means longer vacancies and softer asking-rent achievability than the comps imply.
- What's the recent tenant-quality profile in this submarket — average credit score on applications, eviction rate, late-payment / NSF rate, and stable-employment percentage? A property-management company in the area should have these aggregated.
- How much new for-sale + rental construction is in the pipeline within 1–3 miles? Heavy new supply typically softens prices + rents 12–24 months out; constrained supply supports both.
Investment metrics
- 1% rule
- 0.52% ✗
- Cap rate
- 2.91%
- Cash-on-cash
- -12.07%
- DSCR
- 0.46
- GRM
- 16.1
CMA / ARV
- ARV (on-the-fly)
- $341,952
- Comps found
- 1
Show comp detail 1 sale within ~0.75 mi
| Address | Dist | Beds/Ba | Sqft | Sold | Price | $/sf | Match |
|---|---|---|---|---|---|---|---|
| 6005 Sycamore Rd | 0.46mi | 2/2.0 | 1,185 (-5%) | 15mo | $325,000 | $274 | 58 |
Match score weights: distance 35% · size 25% · config 20% · recency 20%. Top-matched comps best support the ARV.
Projected returns pro-forma
-3.0% appreciation · 6.73% rent growth · sell at horizon
- IRR
- -34.6%
- Equity multiple
- -0.15×
- Total profit
- $-109,837
- Equity at exit
- $50,986
- IRR
- -28.0%
- Equity multiple
- -0.50×
- Total profit
- $-143,963
- Equity at exit
- $29,566
Cash invested: $95,747 (down + closing). Projections, not guarantees.
Landlord ↔ Tenant lean methodology
- Overall (STATE)
- 90 Strongly Landlord-Friendly
- State Wyoming
- 90 Strongly Landlord-Friendly · R+25
- County
- — inherits STATE
- City
- — inherits STATE
ZIP-level market 82009
- Rents YoY
- 6.7%
- Active inventory
- 555
- Price-to-rent
- 9.5×
Monthly cashflow live
- Estimated rent
- $1,772 medium interval (Pro) →
- Mortgage (P&I)
- −$1,793
- Tax est. 1.5%
- −$427 /mo · $5,129/yr
- Insurance
- −$142
- HOA
- −$0
- Vacancy / Maint / Mgmt
- −$372
- Net cashflow
- $-963
Break-even live
Sensitivity live
| Price | -10% $-727 | -5% $-845 | +0% $-963 | +5% $-1,081 | +10% $-1,200 |
|---|---|---|---|---|---|
| Rent | -10% $-1,103 | -5% $-1,033 | +0% $-963 | +5% $-893 | +10% $-823 |
| Rate | -1.0pp $-791 | -0.5pp $-876 | base $-963 | +0.5pp $-1,052 | +1.0pp $-1,142 |
UW: 25.0% down · 7.5% · 30yr · 1.5% tax · 5.0% vac · 8.0% maint · 8.0% mgmt
Financing live
Cash to close
- Down payment
- $85,488
- Closing costs
- $10,259
- Reserves months
- —
- Total cash needed
- —
Loan-product check · same deal, 3 products live
Conventional
25% down · 7.5% · 30yr
- Down + closing
- —
- Monthly P&I
- —
- Monthly cashflow
- —
- DSCR
- —
- Eligible?
- —
Personal DTI + credit; lowest rate.
DSCR
20% down · 8.5% · 30yr
- Down + closing
- —
- Monthly P&I
- —
- Monthly cashflow
- —
- DSCR
- —
- Eligible?
- —
No personal income docs; deal must DSCR.
Hard money
10% down · 12.0% · 12mo
- Down + closing
- —
- Monthly P&I
- —
- Monthly cashflow
- —
- DSCR
- —
- Eligible?
- —
Short-term bridge; refi at stabilization.
Listing history 18 events
-
2026-06-22days on market $201,000 Active 144 DOM
-
2026-06-19days on market $201,000 Active 142 DOM
-
2026-06-18days on market $201,000 Active 141 DOM
-
2026-06-17days on market $201,000 Active 140 DOM
-
2026-06-16days on market $201,000 Active 139 DOM
-
2026-06-15days on market $201,000 Active 138 DOM
-
2026-06-14days on market $201,000 Active 136 DOM
-
2026-06-13days on market $201,000 Active 135 DOM
-
2026-06-10days on market $201,000 Active 133 DOM
-
2026-06-09days on market $201,000 Active 132 DOM
-
2026-06-08days on market $201,000 Active 131 DOM
-
2026-06-07days on market $201,000 Active 130 DOM
-
2026-06-05days on market $201,000 Active 127 DOM
-
2026-06-03days on market $201,000 Active 126 DOM
-
2026-06-02days on market $201,000 Active 125 DOM
-
2026-06-01days on market $201,000 Active 124 DOM
-
2026-05-31days on market $201,000 Active 123 DOM
-
2026-05-30days on market $201,000 Active 122 DOM
ⓘ Source: listings_history table (triggers on properties + properties_extension) + one-shot
backfill from property_details.listing_events for pre-trigger history.
Climate risk First Street
- Flood 1/10 Low FEMA zone X (unshaded) · 0% chance over 30 yrs
- Wildfire 7/10 Severe
- Heat 2/10 Low 7 d/yr ≥88°F today · 20 d/yr by 30 yrs out
- Wind 2/10 Low
- Air quality 3/10 Moderate 2 unhealthy d/yr today · 2 by 30 yrs out
Nearby sold comps map
Loading sold comps map…
Walkable amenities ~0.75 mi
Loading nearby amenities…
Taxation est. · year 1
- Rental income
- $21,264
- − Mortgage interest
- −$19,155
- − Property taxes
- −$5,129
- − Insurance
- −$1,710
- − Repairs & maintenance
- −$1,701
- − Management
- −$1,701
- − Depreciation
- −$9,948
- Taxable loss
- −$18,080
- Est. tax savings @ 24.0%
- +$4,339
- After-tax cash flow
- $-7,220/yr
For passive investors: Depreciation is non-cash, so a rental often shows a tax loss while cash-flowing — sheltering income. Rental losses are passive: they offset passive income freely, and up to $25,000/yr can offset ordinary (W-2) income if you actively participate and your MAGI is under $100k (phasing out to $0 by $150k); unused losses carry forward. On sale, claimed depreciation is recaptured at up to 25%, and gains may owe capital-gains tax (a 1031 exchange can defer both). Figures are a year-1 estimate at your 24.0% rate — not tax advice; consult a CPA.
Schools (NCES district)
- District
- Laramie County School District #1
- NCES district ID
- 5601980
- Math proficiency
- 41% ▼ -2.00%
- Reading proficiency
- 48% ▼ -2.00%
- Median HH income
- $56,842
- Composite
- 38.86/100
- National rank
- #4103
- State rank
- #33 of 41 in WY
Livability — Cheyenne
- Score
- 83/100
- State rank
- #2
- US rank
- #947
Category grades
Schools grade is shown separately in the Schools card above.
Census & demographics
- County
- Laramie County · 94,953 people
- City population
- 94,953
- Metro
- Cheyenne, WY
- Population (ZIP)
- 35,081
- Household income
- $103,835
- Rent vs Own
- Severe rent burden
- 608.0
Population outlook (Laramie County) Hauer SSP2
- Today (2025)
- 109,698 people
- By 2030
- 115,710 · +5.5%
- By 2040
- 127,191 · +15.9%
- By 2050
- 138,476 · +26.2%
- By 2075
- 168,653 · +53.7%
- By 2100
- 188,739 · +72.1%
Race, ethnicity, and origin ACS 2023
- Neighborhood character
- Predominantly White (83%)
- Race & ethnicity
- White 83% Hispanic / Latino 9% Two or more races 6% Asian 1% Black 1%
- Hispanic origin (detail)
- Mexican 6%
- Common ancestry
- Portuguese 3% Slovak 3% Italian 3%
- Foreign-born
- 3% · Canada
- Languages at home
- 96% English-only · Spanish 2% Other Indo-European 1%
Political lean MEDSL · Laramie
- 2024 margin
- Solid R (+32.4) · D 33.0% · R 65.4% · Other 1.6%
- 2008→2024 swing
- -12.1pp toward R · 2008: -20.4pp · 2024: -32.4pp
- All cycles
- 2024: R+32.4 2020: R+28.2 2016: R+33.2 2012: R+24.8 2008: R+20.4
Not yet ingested
- Civics
- —
Market trends
- HPI YoY
- ▼ -339.39%
- Current HPI
- 266.7583
- Rent YoY
- ▲ 6.73%
- Metro
- Cheyenne, WY
- State GDP YoY
- —
- F500 in state
- 0
Cash-flow waterfall
monthlySold comps — $/sqft
last 12 mo · ≤1 miLoading sold comps…