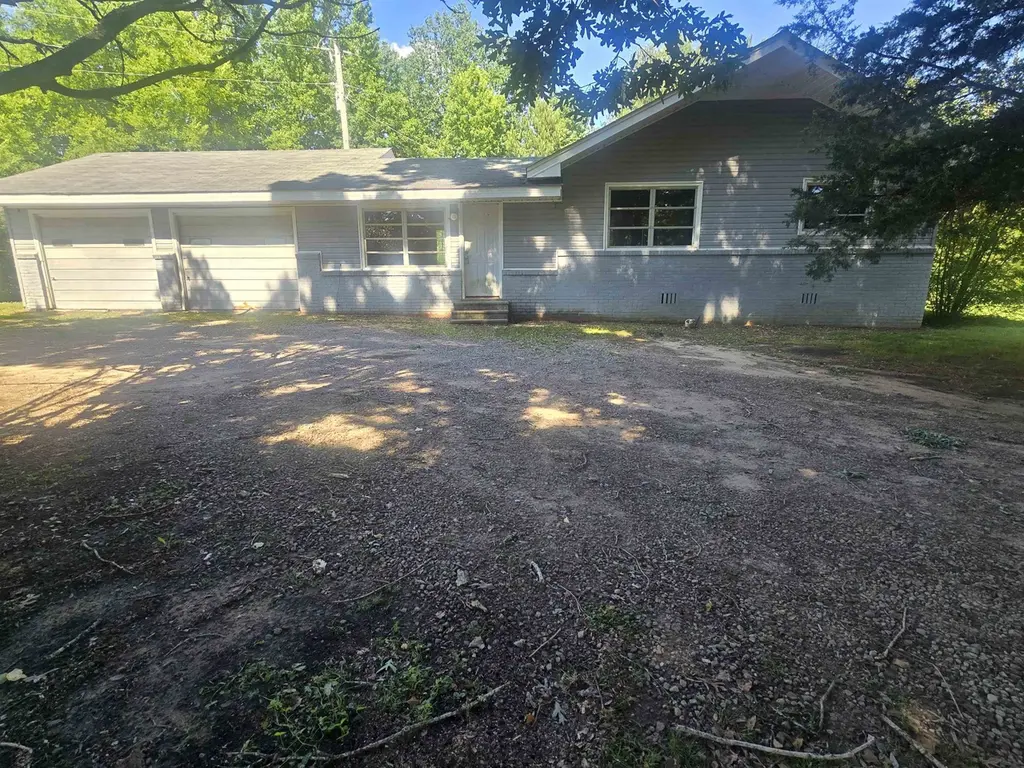
1505 Co Rd 384 · Good Hope, AL
Flood risk 1/10 · Minimal
- FEMA flood zone
- X (unshaded)
- Chance of flooding over 30 yrs
- 0.0%
- Est. flood insurance / yr
- $507 – $1,088
Fire risk 5/10 · Moderate
- Est. fire insurance / yr
- $916 – $1,700
Heat risk 5/10 · Moderate
- Hot days now (above 105°F)
- 7 days/yr
- Hot days in 30 yrs
- 19 days/yr
Wind risk 4/10 · Minor
- Chance of severe wind over 30 yrs
- 21.0%
Air-quality risk 3/10 · Minor
- Unhealthy air days now
- 3 days/yr
- Unhealthy air days in 30 yrs
- 4 days/yr
Risk factors via First Street. Map © Google.
Why this score? — see what drove the D grade
The composite is a weighted blend of 9 inputs, each scored 0–100. Each bar is that input's sub-score; the figure is the points it added to the 100-point composite (weight × sub-score).
- Cash flow +15.5/30.0
- ARV discount +10.0/15.0
- DSCR +4.8/10.0
- Livability +3.2/5.0
- 1% rule +3.0/10.0
- Schools +2.8/10.0
- Rent growth +2.5/5.0
- Condition / age +2.5/5.0
- Appreciation +0.0/10.0
$189,000
🖨 Deal sheet (PDF) 📄 Offer letter ✓ Due diligence
Listing remarks
Located in the sought-after Good Hope school district, this updated 3BR/2BA home sits on approximately 1.4 acres and offers the perfect mix of comfort, space, and convenience. Inside, you’ll find around 1,600± sq ft with hardwood and LVP flooring throughout, plus a functional single-level layout designed for easy living. Major improvements include an HVAC system approximately 5 years old and a roof approximately 8 years old, helping provide peace of mind for years to come. Enjoy the privacy of a rural setting while still being conveniently located to Cullman, Smith Lake, shopping, dining, and schools. If you’ve been searching for move-in ready with acreage and updates at
Key facts
- Move-in ready
- Acreage
- Roof
Tags
Property features AI
Exterior
- Parking: 2-car garage
- Utilities: Septic tank
- Home design: Single-family residential property
- Construction: Vinyl siding; Above-grade finished area reported (1,625)
- Exterior features: Shingle roof; Asphalt road access; 1.4-acre lot; Lot dimensions approximately 104.38 x 338.97 x 411.12 x 208.7
Interior
- Kitchen: Dishwasher; Electric oven; Refrigerator
- Bedrooms: 3 main-level bedrooms
- Flooring: Ceramic tile; Hardwood; Laminate
- Bathrooms: 2 full bathrooms
- Heating & cooling: Central heating; Central air conditioning
- Interior features: Dishwasher; Electric oven; Refrigerator; Crawl space
- Laundry & utility: Main-level laundry room
Neighborhood map
What this means for you Summary
Snapshot
- This is a 3-bed/2.0-bath single-family listed at $189k.
Deal economics
- At list price, monthly cash flow is $75 ($896/yr) — positive.
- The deal already cash-flows at list — no discount required.
- To meet the 1% rule (rent ≥ 1% of price), the offer needs to be $151k (20.2% below list).
- Recommended offer: $151k (20.2% below list) — sets the bar for 1% rule.
- Cap rate 6.8% vs local median 4.1% in Good Hope — top-decile yield for the area; either an underpriced asset or a hidden risk that comps aren't pricing in. Stress-test before assuming the spread holds.
Location & tenants
- Location reads 63/100 on livability (#199 in AL) — a middle-class / working-renter tenant base. Strengths: crime A+, cost of living A+, housing A+; Watch: employment D, amenities F, commute F.
- Cullman County (rural): math 19% / reading 49% proficiency, ranked #49 of 129 in AL (top 38%) — families likely to look elsewhere, expect single-tenant / working-renter base with shorter leases.
- Zoned schools: Good Hope Primary School (425 students, 63% FRL); Good Hope Middle School (math 19% / reading 54%, grade F, #76 of 257 statewide, top 31%, 386 students, 62% FRL); Good Hope High School (math 27% / reading 17%, grade F, #142 of 305 statewide, top 51%, 443 students, 53% FRL).
- Market conditions: 127 active listings in the ZIP; 180 units permitted in Cullman County in 2024 (0 in 5+ unit buildings).
Forward outlook
- Local home prices are declining (-3.0%/yr); year-one equity from $1k of loan paydown is wiped out by about $6k of value loss. Plan a longer hold.
Negotiation context
- It's been on market 18 days — a 2% lower offer ($186k) is reasonable based on typical stale-listing flexibility.
- 3 sale attempts since 22y ago with the ask held roughly flat each time — persistent listings suggest the price (not the market) is what's stuck; bring a comps-based counter.
Risks & watch-outs
- Climate carrying-cost: moderate wildfire risk; extreme-heat days projected 7→19/yr by 2055 (HVAC capex compounding) — expect insurance premiums to compound above CPI over the hold.
Questions for the listing agent
- Built in 1966 — when were the roof, HVAC, electrical panel, plumbing, and water heater last replaced?
- Is there a deadline driving the sale (1031 exchange, divorce, estate, relocation)? That informs how much negotiation room exists.
- Schools are F-rated, which usually means shorter tenancies and higher turnover. Who's the typical renter profile here, and what's been the actual vacancy rate?
- The area grade is low — what's the realistic commute time and amenity access for the typical tenant pool here? Any planned neighborhood developments (good or bad) we should know about?
- What's the average days-on-market for RENTAL listings here right now (not sales)? A rising rental-DOM trend means longer vacancies and softer asking-rent achievability than the comps imply.
- What's the recent tenant-quality profile in this submarket — average credit score on applications, eviction rate, late-payment / NSF rate, and stable-employment percentage? A property-management company in the area should have these aggregated.
- How much new for-sale + rental construction is in the pipeline within 1–3 miles? Heavy new supply typically softens prices + rents 12–24 months out; constrained supply supports both.
Investment metrics
- 1% rule
- 0.80% ✗
- Cap rate
- 6.77%
- Cash-on-cash
- 1.69%
- DSCR
- 1.08
- GRM
- 10.4
CMA / ARV
- ARV (median comp)
- $200,062
- List price
- $189,000
- Delta
- 14.96%
- Verdict
- OVERPRICED
- Comps
- 8 within 1.0 mi
Projected returns pro-forma
-3.0% appreciation · 3.0% rent growth · sell at horizon
- IRR
- -13.7%
- Equity multiple
- 0.51×
- Total profit
- $-25,963
- Equity at exit
- $28,181
- IRR
- -4.9%
- Equity multiple
- 0.68×
- Total profit
- $-16,863
- Equity at exit
- $16,341
Cash invested: $52,920 (down + closing). Projections, not guarantees.
Landlord ↔ Tenant lean methodology
- Overall (STATE)
- 90 Strongly Landlord-Friendly
- State Alabama
- 90 Strongly Landlord-Friendly · R+15
- County
- — inherits STATE
- City
- — inherits STATE
ZIP-level market 35057
- Home prices YoY
- -14.1%
- Active inventory
- 127
- Price-to-rent
- 10.4×
Monthly cashflow live
- Estimated rent
- $1,509 medium interval (Pro) →
- Mortgage (P&I)
- −$991
- Tax from tax record
- −$47 /mo · $570/yr
- Insurance
- −$79
- HOA
- −$0
- Vacancy / Maint / Mgmt
- −$317
- Net cashflow
- $75
Break-even live
Sensitivity live
| Price | -10% $182 | -5% $128 | +0% $75 | +5% $21 | +10% $-32 |
|---|---|---|---|---|---|
| Rent | -10% $-45 | -5% $15 | +0% $75 | +5% $134 | +10% $194 |
| Rate | -1.0pp $170 | -0.5pp $123 | base $75 | +0.5pp $26 | +1.0pp $-24 |
UW: 25.0% down · 7.5% · 30yr · 1.5% tax · 5.0% vac · 8.0% maint · 8.0% mgmt
Financing live
Cash to close
- Down payment
- $47,250
- Closing costs
- $5,670
- Reserves months
- —
- Total cash needed
- —
Loan-product check · same deal, 3 products live
Conventional
25% down · 7.5% · 30yr
- Down + closing
- —
- Monthly P&I
- —
- Monthly cashflow
- —
- DSCR
- —
- Eligible?
- —
Personal DTI + credit; lowest rate.
DSCR
20% down · 8.5% · 30yr
- Down + closing
- —
- Monthly P&I
- —
- Monthly cashflow
- —
- DSCR
- —
- Eligible?
- —
No personal income docs; deal must DSCR.
Hard money
10% down · 12.0% · 12mo
- Down + closing
- —
- Monthly P&I
- —
- Monthly cashflow
- —
- DSCR
- —
- Eligible?
- —
Short-term bridge; refi at stabilization.
Listing history 17 events
-
2026-06-22days on market $189,000 Active 18 DOM
-
2026-06-21days on market $189,000 Active 17 DOM
-
2026-06-19days on market $189,000 Active 15 DOM
-
2026-06-18days on market $189,000 Active 14 DOM
-
2026-06-17days on market $189,000 Active 13 DOM
-
2026-06-16days on market $189,000 Active 12 DOM
-
2026-06-15days on market $189,000 Active 11 DOM
-
2026-06-14days on market $189,000 Active 9 DOM
-
2026-06-12days on market $189,000 Active 8 DOM
-
2026-06-09days on market $189,000 Active 5 DOM
-
2026-06-08days on market $189,000 Active 4 DOM
-
2026-06-07days on market $189,000 Active 3 DOM
-
2026-06-05remarks 680-char remark
-
2026-06-05pricestatusdays on market $189,000 Active 1 DOM
-
2026-04-22price $230,000
-
2015-07-06$89,000
-
2004-12-13$89,900
ⓘ Source: listings_history table (triggers on properties + properties_extension) + one-shot
backfill from property_details.listing_events for pre-trigger history.
Tax reassessment forecast AL · Resets to sale price
- Current annual tax
- $570 · $47/mo
- Projected year-2 tax
- $775 · $65/mo
- Expected delta
- +$205/yr (+$17/mo · 36.0%)
ⓘ Screening estimate from a state-policy table — verify with the county assessor before closing.
Climate risk First Street
- Flood 1/10 Low FEMA zone X (unshaded) · 0% chance over 30 yrs
- Wildfire 5/10 Major
- Heat 5/10 Major 7 d/yr ≥105°F today · 19 d/yr by 30 yrs out
- Wind 4/10 Moderate 21% chance of damaging wind over 30 yrs
- Air quality 3/10 Moderate 3 unhealthy d/yr today · 4 by 30 yrs out
Nearby sold comps map
Loading sold comps map…
Walkable amenities ~0.75 mi
Loading nearby amenities…
Taxation est. · year 1
- Rental income
- $18,107
- − Mortgage interest
- −$10,587
- − Property taxes
- −$570
- − Insurance
- −$945
- − Repairs & maintenance
- −$1,449
- − Management
- −$1,449
- − Depreciation
- −$5,498
- Taxable loss
- −$2,390
- Est. tax savings @ 24.0%
- +$574
- After-tax cash flow
- $1,470/yr
For passive investors: Depreciation is non-cash, so a rental often shows a tax loss while cash-flowing — sheltering income. Rental losses are passive: they offset passive income freely, and up to $25,000/yr can offset ordinary (W-2) income if you actively participate and your MAGI is under $100k (phasing out to $0 by $150k); unused losses carry forward. On sale, claimed depreciation is recaptured at up to 25%, and gains may owe capital-gains tax (a 1031 exchange can defer both). Figures are a year-1 estimate at your 24.0% rate — not tax advice; consult a CPA.
Schools (NCES district)
- District
- Cullman County
- NCES district ID
- 0101020
- Math proficiency
- 19% ▼ -35.00%
- Reading proficiency
- 49% ▲ 1.00%
- Median HH income
- $39,449
- Composite
- 28.39/100
- National rank
- #6767
- State rank
- #49 of 129 in AL
Livability — Good Hope
- Score
- 63/100
- State rank
- #199
- US rank
- #15846
Category grades
Schools grade is shown separately in the Schools card above.
Census & demographics
- Population (ZIP)
- 15,514
Population outlook (Cullman County) Hauer SSP2
- Today (2025)
- 84,522 people
- By 2030
- 85,402 · +1.0%
- By 2040
- 86,152 · +1.9%
- By 2050
- 85,202 · +0.8%
- By 2075
- 79,679 · -5.7%
- By 2100
- 66,943 · -20.8%
Race, ethnicity, and origin ACS 2023
- Neighborhood character
- Predominantly White (94%)
- Race & ethnicity
- White 94% Hispanic / Latino 3% Two or more races 3%
- Common ancestry
- Slovak 2% Serbian 1% Italian 1%
- Foreign-born
- 1% · Canada
- Languages at home
- 99% English-only · Spanish 1%
Political lean MEDSL · Cullman
- 2024 margin
- Solid R (+80.5) · D 9.4% · R 89.9%
- 2008→2024 swing
- -15.3pp toward R · 2008: -65.2pp · 2024: -80.5pp
- All cycles
- 2024: R+80.5 2020: R+77.4 2016: R+77.8 2012: R+69.5 2008: R+65.2
Not yet ingested
- Civics
- —
Market trends
- HPI YoY
- ▼ -43.36%
- Current HPI
- 264.0336
- Rent YoY
- —
- Metro
- —
- State GDP YoY
- ▲ 2.94%
- F500 in state
- 4
Industry mix (Fortune 500 HQ in AL)
| Industry | F500 HQs | Revenue |
|---|---|---|
| Financial Services | 1 | $8B |
|
||
| Healthcare | 1 | $5B |
|
||
Price history
+110.2% since first listed4 events — show timeline
- 2026-06-04 Listed $189,000 SAARMLS
- 2026-04-22 Price Changed $230,000 Greater Alabama MLS
- 2015-07-06 Listed $89,000 SAARMLS
- 2004-12-13 Listed $89,900 SAARMLS
Property tax history
+3.9%/yrLatest (2025): $570 · +6.7% YoY. Source: county tax records.
Cash-flow waterfall
monthlySold comps — $/sqft
last 12 mo · ≤1 miLoading sold comps…