14211 Avalon Path #503 · Rosemount, MN
Flood risk 1/10 · Minimal
- FEMA flood zone
- X (unshaded)
- Chance of flooding over 30 yrs
- 0.0%
- Est. flood insurance / yr
- $507 – $1,088
Fire risk 1/10 · Minimal
- Est. fire insurance / yr
- $888 – $1,650
Heat risk 2/10 · Minimal
- Hot days now (above 100°F)
- 7 days/yr
- Hot days in 30 yrs
- 14 days/yr
Wind risk 2/10 · Minimal
- Chance of severe wind over 30 yrs
- —
Air-quality risk 1/10 · Minimal
- Unhealthy air days now
- 0 days/yr
- Unhealthy air days in 30 yrs
- 0 days/yr
Risk factors via First Street. Map © Google.
Why this score? — see what drove the D- grade
The composite is a weighted blend of 9 inputs, each scored 0–100. Each bar is that input's sub-score; the figure is the points it added to the 100-point composite (weight × sub-score).
- Cash flow +10.2/30.0
- ARV discount +6.2/15.0
- Schools +4.9/10.0
- Livability +4.5/5.0
- Rent growth +4.0/5.0
- 1% rule +3.9/10.0
- DSCR +2.9/10.0
- Condition / age +2.5/5.0
- Appreciation +0.0/10.0
$300,000
🖨 Deal sheet (PDF) 📄 Offer letter ✓ Due diligence
Listing remarks MLS
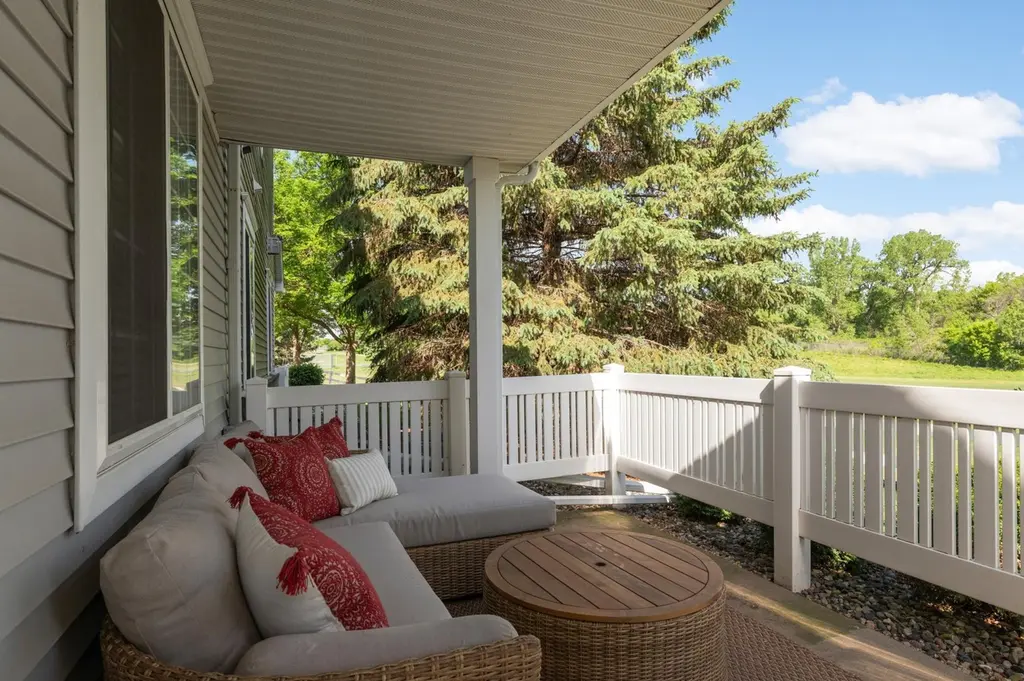
Don't miss this 3 bedroom, 1.5 bathroom Quad unit townhome in great condition! Light and bright throughout. Enjoy the outstanding backyard views of the natural fields of Bloomfield Park with an occasional train off in the distance. Grill out on your private concrete patio!. Recent renovations include dark laminate wood flooring, white trim, newly painted walls throughout, updated kitchen cabinets. 3 year old range, dishwasher, washer and dryer. Newer carpet on stairs and upper level. Updated full bath with double vanity; new fixtures and mirrors. Storage shelving in the attached garage will stay.. Landscaping to be completed Spring-Summer 2020. Well maintained home with flexible closing!
Key facts
- $344 HOA
- 2 garage spots
- Built 2002
Property features AI
Finance
- Other: Association-maintained private road
- HOA & community: Homeowners association managed by Network Management; Monthly HOA fee of $344; HOA covers hazard insurance, lawn care, grounds maintenance, professional management, sewer, snow removal and water
Exterior
- Parking: Attached 2-car garage
- Utilities: City water (connected; city water in street); City sewer (connected); Natural gas
- Home design: Attached residential property; Two levels; Entry via front porch; Private road with association maintenance
- Construction: Built with slab foundation; Roof age 8 years or less
- Exterior features: Covered patio; Front porch; Patio; Stone and vinyl exterior
Interior
- Kitchen: Dishwasher; Disposal; Freezer; Microwave; Range; Stainless steel appliances
- Bedrooms: 3 bedrooms (all on upper level except main-level living areas)
- Bathrooms: One full bathroom on upper level; Half bathroom on main level
- Heating & cooling: Forced air heating; Central air conditioning
- Interior features: Ceiling fan(s); Primary bedroom with walk-in closet; Walk-in closet; In-ground sprinkler; Patio
- Laundry & utility: Upper level laundry; Washer/dryer hookup; Gas water heater; Water softener (owned)
Neighborhood map
What this means for you Summary
Snapshot
- This is a 3-bed/2.0-bath townhouse listed at $300k.
Deal economics
- At list price, monthly cash flow is $-170 ($-2k/yr) — negative.
- To cash-flow at today's rent, offer at most $270k (10.0% below list).
- To meet the 1% rule (rent ≥ 1% of price), the offer needs to be $266k (11.5% below list).
- Recommended offer: $266k (11.5% below list) — sets the bar for 1% rule.
- Cap rate 5.6% vs local median 3.5% in Rosemount — top-decile yield for the area; either an underpriced asset or a hidden risk that comps aren't pricing in. Stress-test before assuming the spread holds.
Location & tenants
- Location reads 89/100 on livability (#5 in MN, #148 nationally) — a professional / high-income tenant draw. Strengths: crime A+, commute A+, employment A+; Watch: amenities D, cost of living D.
- Rosemount-Apple Valley-Eagan (suburban): math 50% / reading 58% proficiency, ranked #58 of 301 in MN (top 19%) — acceptable for families but not a draw, mixed tenant base, ~2y average lease; only 18% free/reduced lunch — higher-income household profile.
- Zoned schools: Rosemount Elementary (math 57% / reading 51%, grade C, #352 of 857 statewide, top 41%, 775 students, 27% FRL); Rosemount Middle (math 48% / reading 58%, grade C+, #53 of 258 statewide, top 22%, 1,205 students, 20% FRL); Rosemount Senior High (math 54% / reading 67%, grade C+, #43 of 471 statewide, top 9%, 2,425 students, 21% FRL).
- Market conditions: Rents rising fast (+6.0%/yr); 402 active listings in the ZIP; 11 comparable units currently listed for rent nearby; rentals leasing fast (median 2d on market — plan ~1-2 weeks tenant-placement turnaround); high-income renter base; 2,134 units permitted in Dakota County in 2024 (898 in 5+ unit buildings).
Forward outlook
- Local home prices are declining (-3.0%/yr); year-one equity from $2k of loan paydown is wiped out by about $9k of value loss. Plan a longer hold.
- Dakota County population projected at +11% by 2050 — modest demand growth; plan on rents tracking national, not racing it.
Negotiation context
- Only 8 days on market — expect competitive offers; lowballing is unlikely to land.
- 3 sale attempts since 6y ago with the ask held roughly flat each time — persistent listings suggest the price (not the market) is what's stuck; bring a comps-based counter.
- Current owner paid $238k; 26% above their basis — modest negotiation headroom, anchor on the comps not their cost.
Questions for the listing agent
- What do current leases actually rent for vs. the listed asking? Can we see a recent rent roll and the last 12 months of T-12 income?
- What does the HOA fee cover, when was the last increase, and are there any pending special assessments or reserve-fund shortfalls?
- Is there a deadline driving the sale (1031 exchange, divorce, estate, relocation)? That informs how much negotiation room exists.
- Schools are A-rated — typically a magnet for longer-tenancy family renters. What's the average tenant stay here, and is there a school-zone premium baked into asking?
- The area grade is low — what's the realistic commute time and amenity access for the typical tenant pool here? Any planned neighborhood developments (good or bad) we should know about?
- What's the average days-on-market for RENTAL listings here right now (not sales)? A rising rental-DOM trend means longer vacancies and softer asking-rent achievability than the comps imply.
- What's the recent tenant-quality profile in this submarket — average credit score on applications, eviction rate, late-payment / NSF rate, and stable-employment percentage? A property-management company in the area should have these aggregated.
- How much new for-sale + rental construction is in the pipeline within 1–3 miles? Heavy new supply typically softens prices + rents 12–24 months out; constrained supply supports both.
Investment metrics
- 1% rule
- 0.89% ✗
- Cap rate
- 5.61%
- Cash-on-cash
- -2.42%
- DSCR
- 0.89
- GRM
- 9.4
CMA / ARV
- ARV (on-the-fly)
- $291,505
- Comps found
- 1
Show comp detail 1 sale within ~0.75 mi
| Address | Dist | Beds/Ba | Sqft | Sold | Price | $/sf | Match |
|---|---|---|---|---|---|---|---|
| 14243 Banyan Ln | 0.30mi | 3/3.0 | 1,606 (-5%) | 0mo | $277,600 | $173 | 74 |
Match score weights: distance 35% · size 25% · config 20% · recency 20%. Top-matched comps best support the ARV.
Projected returns pro-forma
-3.0% appreciation · 6.02% rent growth · sell at horizon
- IRR
- -16.6%
- Equity multiple
- 0.39×
- Total profit
- $-50,952
- Equity at exit
- $44,731
- IRR
- -3.3%
- Equity multiple
- 0.75×
- Total profit
- $-21,346
- Equity at exit
- $25,939
Cash invested: $84,000 (down + closing). Projections, not guarantees.
Landlord ↔ Tenant lean methodology
- Overall (STATE)
- 46 Balanced
- State Minnesota
- 46 Balanced · D+2
- County
- — inherits STATE
- City
- — inherits STATE
ZIP-level market 55068
- Home prices YoY
- -30.8%
- Rents YoY
- 6.0%
- Active inventory
- 402
- Price-to-rent
- 9.4×
Monthly cashflow live
- Estimated rent
- $2,655 high interval (Pro) →
- Mortgage (P&I)
- −$1,573
- Tax from tax record
- −$225 /mo · $2,704/yr
- Insurance
- −$125
- HOA
- −$344
- Vacancy / Maint / Mgmt
- −$558
- Net cashflow
- $-170
Break-even live
Sensitivity live
| Price | -10% $0 | -5% $-85 | +0% $-170 | +5% $-255 | +10% $-340 |
|---|---|---|---|---|---|
| Rent | -10% $-380 | -5% $-275 | +0% $-170 | +5% $-65 | +10% $40 |
| Rate | -1.0pp $-19 | -0.5pp $-93 | base $-170 | +0.5pp $-247 | +1.0pp $-327 |
UW: 25.0% down · 7.5% · 30yr · 1.5% tax · 5.0% vac · 8.0% maint · 8.0% mgmt
Financing live
Cash to close
- Down payment
- $75,000
- Closing costs
- $9,000
- Reserves months
- —
- Total cash needed
- —
Loan-product check · same deal, 3 products live
Conventional
25% down · 7.5% · 30yr
- Down + closing
- —
- Monthly P&I
- —
- Monthly cashflow
- —
- DSCR
- —
- Eligible?
- —
Personal DTI + credit; lowest rate.
DSCR
20% down · 8.5% · 30yr
- Down + closing
- —
- Monthly P&I
- —
- Monthly cashflow
- —
- DSCR
- —
- Eligible?
- —
No personal income docs; deal must DSCR.
Hard money
10% down · 12.0% · 12mo
- Down + closing
- —
- Monthly P&I
- —
- Monthly cashflow
- —
- DSCR
- —
- Eligible?
- —
Short-term bridge; refi at stabilization.
Rent comps 11 comps
| Address | Beds | Baths | Sqft | Rent | $/sqft | DOM | Units | Dist |
|---|---|---|---|---|---|---|---|---|
| 14349 Banyan Ln Rosemount, MN | 3.0 | 2.5 | 1606 | $2,399 | $1.49 | 1d | 1 | 0.44mi |
| 13721 Kaylemore Trl Unit 13721 Rosemount, MN | 4.0 | 3.0 | 1800 | $2,949 | $1.64 | 26d | 1 | 0.62mi |
| 13721 Kaylemore Trl Unit 13721 Rosemount, MN | 4.0 | 3.0 | 1800 | $2,949 | $1.64 | 0d | 1 | 0.62mi |
| 13652 Kaylemore Trl Rosemount, MN | 3.0 | 2.5 | 1665 | $2,599 | $1.56 | 26d | 1 | 0.67mi |
| 14211 Akron Ave Rosemount, MN | 1.0–3.0 | 1.0–2.0 | 1012 | $2,635 | $2.60 | 0d | 39 | 0.87mi |
| 1003 148th St W Rosemount, MN | 1.0–3.0 | 1.0–2.0 | 1131 | $2,545 | $2.25 | 0d | 26 | 0.99mi |
| 14215 Adalyn Ave Rosemount, MN | 3.0 | 1.0–2.0 | 948 | $2,850 | $3.00 | 0d | 120 | 1.03mi |
| 14947 Adare Way Rosemount, MN | 3.0 | 3.0 | 1800 | $2,545 | $1.41 | 26d | 1 | 1.07mi |
| 1211 142nd St E Rosemount, MN | 3.0 | 2.5 | 1770 | $1,200 | $0.68 | 7d | 1 | 1.08mi |
| 14990 Adare Way Rosemount, MN | 3.0 | 3.0 | 1800 | $2,650 | $1.47 | 20d | 1 | 1.14mi |
| 14589 S Robert Trl Rosemount, MN | 2.0 | 1.0–2.0 | 823 | $2,295 | $2.79 | 0d | 13 | 1.20mi |
HOA detail
- Monthly dues
- $344 · $4,128/yr
- Likely covers
- landscaping
Listing history 6 events
-
2026-06-07statusdays on market $300,000 Pending 8 DOM
-
2026-06-04days on market $300,000 Contingent - Inspection 6 DOM
-
2026-06-03days on market $300,000 Contingent - Inspection 5 DOM
-
2026-06-02days on market $300,000 Contingent - Inspection 4 DOM
-
2026-06-01days on market $300,000 Contingent - Inspection 3 DOM
-
2026-05-31statusdays on market $300,000 Contingent - Inspection 2 DOM
ⓘ Source: listings_history table (triggers on properties + properties_extension) + one-shot
backfill from property_details.listing_events for pre-trigger history.
Tax reassessment forecast MN · Partial reset (capped growth)
- Current annual tax
- $2,704 · $225/mo
- Projected year-2 tax
- $3,032 · $253/mo
- Expected delta
- +$328/yr (+$27/mo · 12.1%)
ⓘ Screening estimate from a state-policy table — verify with the county assessor before closing.
Climate risk First Street
- Flood 1/10 Low FEMA zone X (unshaded) · 0% chance over 30 yrs
- Wildfire 1/10 Low
- Heat 2/10 Low 7 d/yr ≥100°F today · 14 d/yr by 30 yrs out
- Wind 2/10 Low
- Air quality 1/10 Low 0 unhealthy d/yr today · 0 by 30 yrs out
Nearby sold comps map
Loading sold comps map…
Walkable amenities ~0.75 mi
Loading nearby amenities…
Taxation est. · year 1
- Rental income
- $31,866
- − Mortgage interest
- −$16,805
- − Property taxes
- −$2,704
- − Insurance
- −$1,500
- − Repairs & maintenance
- −$2,549
- − Management
- −$2,549
- − HOA
- −$4,128
- − Depreciation
- −$8,727
- Taxable loss
- −$7,097
- Est. tax savings @ 24.0%
- +$1,703
- After-tax cash flow
- $-334/yr
For passive investors: Depreciation is non-cash, so a rental often shows a tax loss while cash-flowing — sheltering income. Rental losses are passive: they offset passive income freely, and up to $25,000/yr can offset ordinary (W-2) income if you actively participate and your MAGI is under $100k (phasing out to $0 by $150k); unused losses carry forward. On sale, claimed depreciation is recaptured at up to 25%, and gains may owe capital-gains tax (a 1031 exchange can defer both). Figures are a year-1 estimate at your 24.0% rate — not tax advice; consult a CPA.
Schools (NCES district)
- District
- Rosemount-Apple Valley-Eagan
- NCES district ID
- 2732390
- Math proficiency
- 50% ▼ -14.00%
- Reading proficiency
- 58% ▼ -7.00%
- Median HH income
- $85,559
- Composite
- 49.48/100
- National rank
- #2000
- State rank
- #58 of 301 in MN
Livability — Rosemount
- Score
- 89/100
- State rank
- #5
- US rank
- #148
Category grades
Schools grade is shown separately in the Schools card above.
Census & demographics
- Census place
- Rosemount, MN
- County
- Dakota County · 417,704 people
- City population
- 33,119
- Metro
- Minneapolis-St. Paul-Bloomington, MN-WI
- Population (ZIP)
- 33,119
- Household income
- $127,798
- Rent vs Own
- Severe rent burden
- 295.0
Population outlook (Dakota County) Hauer SSP2
- Today (2025)
- 450,671 people
- By 2030
- 465,068 · +3.2%
- By 2040
- 486,770 · +8.0%
- By 2050
- 498,743 · +10.7%
- By 2075
- 533,865 · +18.5%
- By 2100
- 550,133 · +22.1%
Race, ethnicity, and origin ACS 2023
- Neighborhood character
- Predominantly White (81%)
- Race & ethnicity
- White 81% Two or more races 7% Asian 5% Black 4% Hispanic / Latino 4%
- Common ancestry
- Portuguese 14% Romanian 7% Lithuanian 3%
- Foreign-born
- 7% · Canada, Vietnam, South Korea
- Languages at home
- 92% English-only · Spanish 2% Tagalog/Filipino 1% Other Asian/Pacific 1%
Political lean MEDSL · Dakota
- 2024 margin
- D (+12.9) · D 55.4% · R 42.5% · Other 2.1%
- 2008→2024 swing
- +7.4pp toward D · 2008: 5.5pp · 2024: 12.9pp
- All cycles
- 2024: D+12.9 2020: D+13.9 2016: D+4.7 2012: D+2.9 2008: D+5.5
Not yet ingested
- Civics
- —
Market trends
- HPI YoY
- ▼ -99.45%
- Current HPI
- 223.9769
- Rent YoY
- ▲ 6.02%
- Metro
- Minneapolis-St. Paul-Bloomington, MN-WI
- State GDP YoY
- ▲ 2.41%
- F500 in state
- 34
Industry mix (Fortune 500 HQ in MN)
| Industry | F500 HQs | Revenue |
|---|---|---|
| Healthcare | 2 | $407B |
|
||
| Retail | 2 | $150B |
|
||
| Consumer Goods | 2 | $32B |
|
||
| Industrial Machinery | 2 | $6B |
|
||
| Agriculture | 1 | $40B |
|
||
| Healthcare / Medical Devices | 1 | $32B |
|
||
Price history
+101.3% since first listed11 events — show timeline
- 2026-05-29 Relisted — NORTHSTARMLS as Distributed by MLS Grid
- 2026-05-27 Listing Removed — NORTHSTARMLS as Distributed by MLS Grid
- 2026-04-25 Listed $300,000 NORTHSTARMLS as Distributed by MLS Grid
- 2020-06-18 Sold (Public Records) $238,000 Public Records
- 2020-06-10 Sold (MLS) $238,000 NORTHSTARMLS as Distributed by MLS Grid
- 2020-04-14 Pending — NORTHSTARMLS as Distributed by MLS Grid
- 2020-04-04 Contingent — NORTHSTARMLS as Distributed by MLS Grid
- 2020-04-04 Listed $234,900 NORTHSTARMLS as Distributed by MLS Grid
- 2020-04-03 Coming Soon $234,900 NORTHSTARMLS as Distributed by MLS Grid
- 2014-10-30 Sold (Public Records) $172,500 Public Records
- 2012-08-30 Sold (Public Records) $149,000 Public Records
Property tax history
+3.8%/yrLatest (2025): $2,704 · -3.4% YoY. Source: county tax records.
Cash-flow waterfall
monthlySold comps — $/sqft
last 12 mo · ≤1 miLoading sold comps…