9319 Victoria Cir · Tacna, AZ
Flood risk 1/10 · Minimal
- FEMA flood zone
- X (unshaded)
- Chance of flooding over 30 yrs
- 0.0%
- Est. flood insurance / yr
- $507 – $1,088
Fire risk 2/10 · Minimal
- Est. fire insurance / yr
- $610 – $1,132
Heat risk 10/10 · Severe
- Hot days now (above 115°F)
- 7 days/yr
- Hot days in 30 yrs
- 18 days/yr
Wind risk 1/10 · Minimal
- Chance of severe wind over 30 yrs
- —
Air-quality risk 1/10 · Minimal
- Unhealthy air days now
- 0 days/yr
- Unhealthy air days in 30 yrs
- 0 days/yr
Risk factors via First Street. Map © Google.
Why this score? — see what drove the C grade
The composite is a weighted blend of 9 inputs, each scored 0–100. Each bar is that input's sub-score; the figure is the points it added to the 100-point composite (weight × sub-score).
- Cash flow +20.9/30.0
- ARV discount +7.5/15.0
- DSCR +6.7/10.0
- 1% rule +5.5/10.0
- Appreciation +5.0/10.0
- Schools +3.6/10.0
- Livability +2.7/5.0
- Rent growth +2.5/5.0
- Condition / age +2.5/5.0
$109,000
🖨 Deal sheet 📄 Offer letter ✓ Due diligence
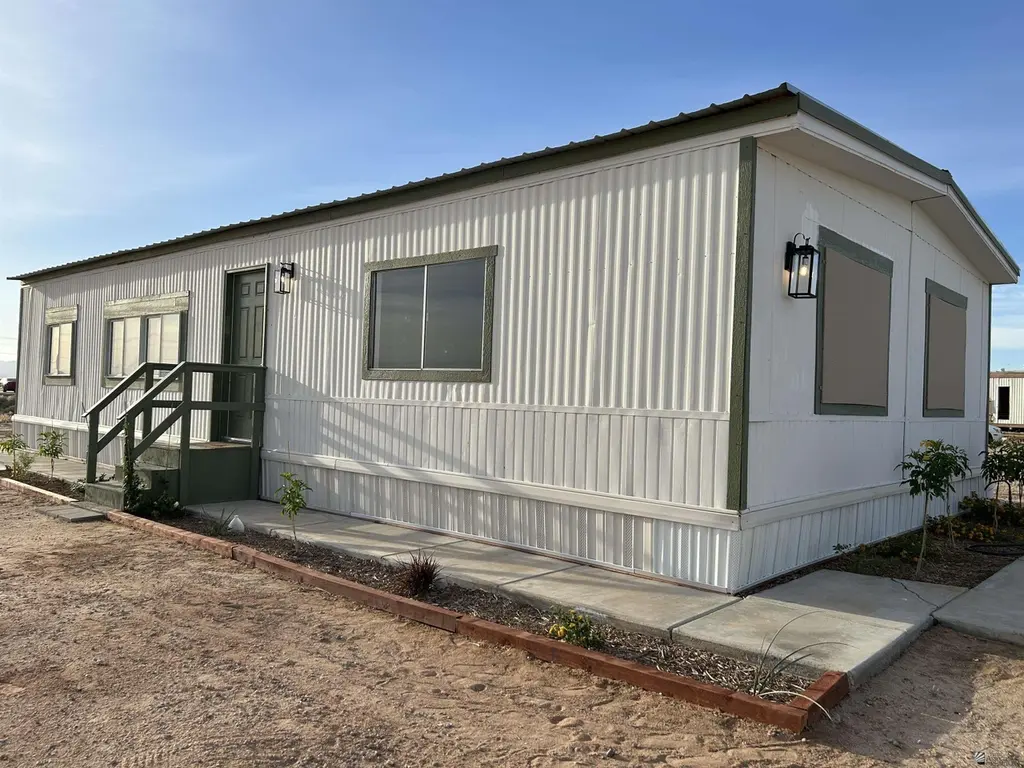
Listing remarks
Just remodeled! This manufactured home was transformed into a sophisticated, open-concept, and light-filled space perfect for a peaceful lifestyle. It features custom solar screens on the south and west windows and new R-19 crawl space insulation for power efficiency. It has new metal roof, new electrical pedestal, new water filtration and reverse osmosis, new automatic garden watering system, and a new almost everything. Two bedrooms, One bathroom with a tub and one bathroom with a shower. Laundry room. Open concept layout living room, dining room and kitchen with an island. Water, power and propane gas available. Will sell: CASH or owner will carry/seller financing.
Key facts
- Custom solar screens
- New roof
- Open concept layout
Tags
Property features AI
Exterior
- Parking: Open parking
- Utilities: Public water; Septic tank
- Home design: Manufactured home (mobile home/manufactured); Residential property
- Exterior features: Lot in Citrus Park subdivision
Interior
- Kitchen: Refrigerator; Gas Range
- Flooring: Laminate flooring
- Bathrooms: 1 full bathroom; 1 three-quarter bathroom
- Heating & cooling: Heating; Cooling
- Interior features: Double pane windows; Smoke detector(s)
Neighborhood map
What this means for you Summary
Snapshot
- This is a 2-bed/2.0-bath manufactured listed at $109k.
Deal economics
- At list price, monthly cash flow is $151 ($2k/yr) — positive.
- The deal already cash-flows at list — no discount required.
- Meets the 1% rule at list price ($1k rent vs $109k).
- Recommended offer: $106k (3.0% below list) — sets the bar for market timing.
Location & tenants
- Location reads 54/100 on livability (#277 in AZ) — a working-class tenant base; expect higher turnover. Strengths: cost of living A+, housing A+; Watch: schools F, crime F, amenities F.
- Mohawk Valley Elementary District (4503) (rural): math 40% / reading 40% proficiency, ranked #211 of 501 in AZ (top 42%) — families likely to look elsewhere, expect single-tenant / working-renter base with shorter leases; 60% free/reduced lunch — lower-income household profile, screen leases tightly.
- Market conditions: 32 active listings in the ZIP; 1,399 units permitted in Yuma County in 2024 (180 in 5+ unit buildings).
Forward outlook
- In year one you build about $4k of equity ($754 loan paydown + $3k appreciation (3.0% local appreciation)).
- Yuma County population projected at +4% by 2050 — modest demand growth; plan on rents tracking national, not racing it.
- At projected returns (3.0% appreciation + 3.0% rent growth), your $31k cash investment doubles in ~5 years — after that, you're playing with house money.
- By year 9, paydown + projected appreciation supports a ~$34k cash-out refi (75% LTV) — recoverable capital for the next deal without selling this one.
Negotiation context
- It's been on market 55 days — a 3% lower offer ($106k) is reasonable based on typical stale-listing flexibility.
- Current owner paid $10k; list at $109k implies a 990% gain — meaningful room to come down on a strong offer.
Risks & watch-outs
- Climate carrying-cost: extreme-heat days projected 7→18/yr by 2055 (HVAC capex compounding) — expect insurance premiums to compound above CPI over the hold.
Questions for the listing agent
- It's been on market 55 days. Have you received any prior offers? Is the seller open to a 3% concession, seller financing, or rate buy-down credit?
- Built in 1971 — when were the roof, HVAC, electrical panel, plumbing, and water heater last replaced?
- Is there a deadline driving the sale (1031 exchange, divorce, estate, relocation)? That informs how much negotiation room exists.
- Schools are F-rated, which usually means shorter tenancies and higher turnover. Who's the typical renter profile here, and what's been the actual vacancy rate?
- Crime grade is F in this area — have there been break-ins, vandalism, or insurance claims at this property in the last 3 years? What carrier currently insures it and at what premium?
- What's the average days-on-market for RENTAL listings here right now (not sales)? A rising rental-DOM trend means longer vacancies and softer asking-rent achievability than the comps imply.
- What's the recent tenant-quality profile in this submarket — average credit score on applications, eviction rate, late-payment / NSF rate, and stable-employment percentage? A property-management company in the area should have these aggregated.
- How much new for-sale + rental construction is in the pipeline within 1–3 miles? Heavy new supply typically softens prices + rents 12–24 months out; constrained supply supports both.
Investment metrics
- 1% rule
- 1.05% ✓
- Cap rate
- 7.96%
- Cash-on-cash
- 5.96%
- DSCR
- 1.27
- GRM
- 7.9
CMA / ARV
No comps found within radius.
Projected returns pro-forma
3.0% appreciation · 3.0% rent growth · sell at horizon
- IRR
- 13.1%
- Equity multiple
- 1.75×
- Total profit
- $22,796
- Equity at exit
- $49,011
- IRR
- 15.0%
- Equity multiple
- 3.22×
- Total profit
- $67,671
- Equity at exit
- $75,532
Cash invested: $30,520 (down + closing). Projections, not guarantees.
Landlord ↔ Tenant lean methodology
- Overall (STATE)
- 87 Strongly Landlord-Friendly
- State Arizona
- 87 Strongly Landlord-Friendly · R+3
- County
- — inherits STATE
- City
- — inherits STATE
ZIP-level market 85352
- Active inventory
- 32
- Price-to-rent
- 7.9×
Monthly cashflow live
- Estimated rent
- $1,145 medium interval (Pro) →
- Mortgage (P&I)
- −$572
- Tax est. 1.5%
- −$136 /mo · $1,635/yr
- Insurance
- −$45
- HOA
- −$0
- Vacancy / Maint / Mgmt
- −$241
- Net cashflow
- $151
Break-even live
UW: 25.0% down · 7.5% · 30yr · 1.5% tax · 5.0% vac · 8.0% maint · 8.0% mgmt
Financing live
Cash to close
- Down payment
- $27,250
- Closing costs
- $3,270
- Reserves months
- —
- Total cash needed
- —
Loan-product check · same deal, 3 products live
Conventional
25% down · 7.5% · 30yr
- Down + closing
- —
- Monthly P&I
- —
- Monthly cashflow
- —
- DSCR
- —
- Eligible?
- —
Personal DTI + credit; lowest rate.
DSCR
20% down · 8.5% · 30yr
- Down + closing
- —
- Monthly P&I
- —
- Monthly cashflow
- —
- DSCR
- —
- Eligible?
- —
No personal income docs; deal must DSCR.
Hard money
10% down · 12.0% · 12mo
- Down + closing
- —
- Monthly P&I
- —
- Monthly cashflow
- —
- DSCR
- —
- Eligible?
- —
Short-term bridge; refi at stabilization.
Listing history 20 events
-
2026-06-19days on market $109,000 Active 55 DOM
-
2026-06-18days on market $109,000 Active 54 DOM
-
2026-06-17days on market $109,000 Active 53 DOM
-
2026-06-16days on market $109,000 Active 52 DOM
-
2026-06-15days on market $109,000 Active 51 DOM
-
2026-06-14remarks 676-char remark
-
2026-06-14days on market $109,000 Active 49 DOM
-
2026-06-13days on market $109,000 Active 48 DOM
-
2026-06-10days on market $109,000 Active 46 DOM
-
2026-06-09days on market $109,000 Active 45 DOM
-
2026-06-08days on market $109,000 Active 44 DOM
-
2026-06-07days on market $109,000 Active 43 DOM
-
2026-06-05days on market $109,000 Active 40 DOM
-
2026-06-03days on market $109,000 Active 39 DOM
-
2026-06-02days on market $109,000 Active 38 DOM
-
2026-06-01days on market $109,000 Active 37 DOM
-
2026-05-31days on market $109,000 Active 36 DOM
-
2026-05-30days on market $109,000 Active 35 DOM
-
2026-04-25$109,000 Active
-
2023-09-18soldstatus $10,000
ⓘ Source: listings_history table (triggers on properties + properties_extension) + one-shot
backfill from property_details.listing_events for pre-trigger history.
Climate risk First Street
- Flood 1/10 Low FEMA zone X (unshaded) · 0% chance over 30 yrs
- Wildfire 2/10 Low
- Heat 10/10 Extreme 7 d/yr ≥115°F today · 18 d/yr by 30 yrs out
- Wind 1/10 Low
- Air quality 1/10 Low 0 unhealthy d/yr today · 0 by 30 yrs out
Nearby sold comps map
Loading sold comps map…
Walkable amenities ~0.75 mi
Loading nearby amenities…
Taxation est. · year 1
- Rental income
- $13,743
- − Mortgage interest
- −$6,106
- − Property taxes
- −$1,635
- − Insurance
- −$545
- − Repairs & maintenance
- −$1,099
- − Management
- −$1,099
- − Depreciation
- −$3,171
- Taxable income
- $88
- Est. tax owed @ 24.0%
- −$21
- After-tax cash flow
- $1,797/yr
For passive investors: Depreciation is non-cash, so a rental often shows a tax loss while cash-flowing — sheltering income. Rental losses are passive: they offset passive income freely, and up to $25,000/yr can offset ordinary (W-2) income if you actively participate and your MAGI is under $100k (phasing out to $0 by $150k); unused losses carry forward. On sale, claimed depreciation is recaptured at up to 25%, and gains may owe capital-gains tax (a 1031 exchange can defer both). Figures are a year-1 estimate at your 24.0% rate — not tax advice; consult a CPA.
Schools (NCES district)
- District
- Mohawk Valley Elementary District (4503)
- NCES district ID
- 0405220
- Math proficiency
- 40% ▲ 5.00%
- Reading proficiency
- 40% ▬ 0.00%
- Median HH income
- $37,007
- Composite
- 35.68/100
- National rank
- #9677
- State rank
- #211 of 501 in AZ
Livability — Tacna
- Score
- 54/100
- State rank
- #277
- US rank
- #23970
Category grades
Schools grade is shown separately in the Schools card above.
Census & demographics
- Population (ZIP)
- 335
Population outlook (Yuma County) Hauer SSP2
- Today (2025)
- 211,633 people
- By 2030
- 214,114 · +1.2%
- By 2040
- 217,856 · +2.9%
- By 2050
- 220,276 · +4.1%
- By 2075
- 222,359 · +5.1%
- By 2100
- 198,880 · -6.0%
Race, ethnicity, and origin ACS 2023
- Neighborhood character
- Predominantly Hispanic (69%)
- Race & ethnicity
- Hispanic / Latino 69% Two or more races 48% White 31% Native American 17%
- Hispanic origin (detail)
- Mexican 69%
- Common ancestry
- Lithuanian 7%
- Foreign-born
- 10% · Canada
- Languages at home
- 47% English-only · Spanish 53%
Political lean MEDSL · Yuma
- 2024 margin
- Strong R (+20.4) · D 39.3% · R 59.8%
- 2008→2024 swing
- -6.6pp toward R · 2008: -13.8pp · 2024: -20.4pp
- All cycles
- 2024: R+20.4 2020: R+6.2 2016: R+5.5 2012: R+16.1 2008: R+13.8
Not yet ingested
- Civics
- —
Market trends
- HPI YoY
- —
- Current HPI
- —
- Rent YoY
- —
- Metro
- —
- State GDP YoY
- ▲ 4.54%
- F500 in state
- 20
Industry mix (Fortune 500 HQ in AZ)
| Industry | F500 HQs | Revenue |
|---|---|---|
| Technology | 2 | $13B |
|
||
| Mining / Metals | 1 | $23B |
|
||
| Environmental Services | 1 | $16B |
|
||
| Metals / Steel | 1 | $14B |
|
||
| Technology Distribution | 1 | $9B |
|
||
| Homebuilding | 1 | $8B |
|
||
Price history
+990.0% since first listed2 events — show timeline
- 2026-04-25 Listed $109,000 YAR
- 2023-09-18 Sold (Public Records) $10,000 Public Records
Property tax history
-10.9%/yrLatest (2025): $34 · +10.2% YoY. Source: county tax records.
Cash-flow waterfall
monthlySold comps — $/sqft
last 12 mo · ≤1 miLoading sold comps…