5503 US Hwy 271 N · Gilmer, TX
Flood risk No data
- FEMA flood zone
- —
- Chance of flooding over 30 yrs
- —
- Est. flood insurance / yr
- —
Fire risk No data
- Est. fire insurance / yr
- —
Heat risk No data
- Hot days now (above threshold)
- —
- Hot days in 30 yrs
- —
Wind risk No data
- Chance of severe wind over 30 yrs
- —
Air-quality risk No data
- Unhealthy air days now
- —
- Unhealthy air days in 30 yrs
- —
Risk factors via First Street. Map © Google.
Why this score? — see what drove the C- grade
The composite is a weighted blend of 9 inputs, each scored 0–100. Each bar is that input's sub-score; the figure is the points it added to the 100-point composite (weight × sub-score).
- Cash flow +15.5/30.0
- Appreciation +10.0/10.0
- ARV discount +7.5/15.0
- DSCR +4.8/10.0
- 1% rule +4.4/10.0
- Schools +3.4/10.0
- Livability +2.9/5.0
- Rent growth +2.5/5.0
- Condition / age +2.2/5.0
$175,000
🖨 Deal sheet 📄 Offer letter ✓ Due diligence
Listing remarks MLS
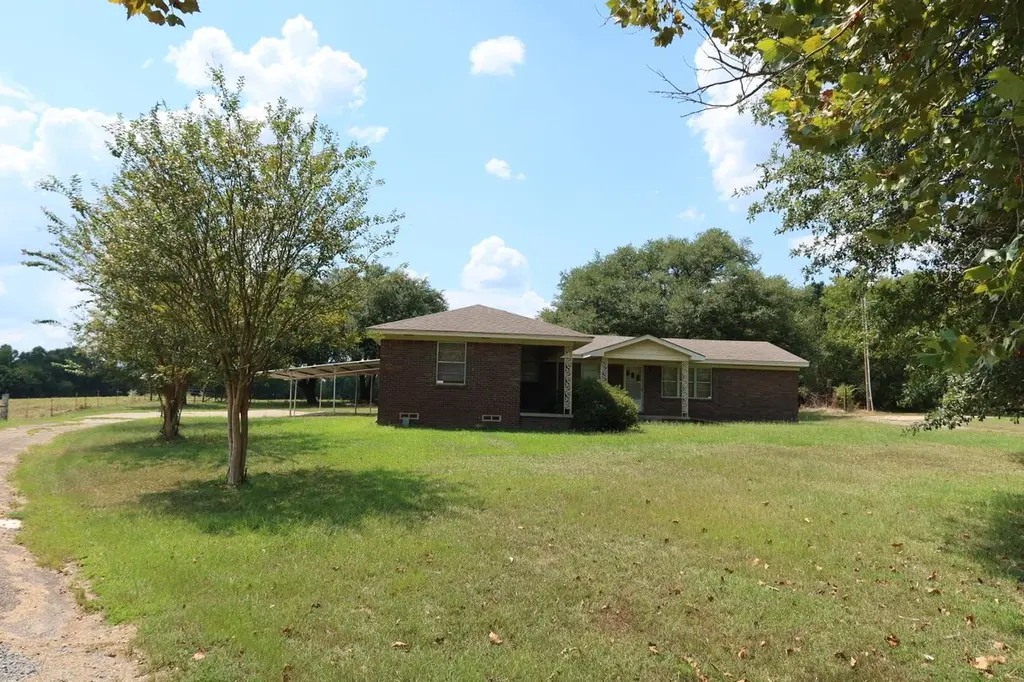
Ready for a project? This little farmhouse on 1 acre has all the markings of a cozy country home. With its vintage character and prime location near the highway. It's ideal for someone who values both convenience and satisfaction of bringing new lights to an old place.
Key facts
- 0.95 acre lot
- Garage
- Built 1954
Neighborhood map
What this means for you Summary
Snapshot
- This is a 3-bed/2.0-bath single-family listed at $175k. Condition is rated fair.
Deal economics
- At list price, monthly cash flow is $70 ($843/yr) — positive.
- The deal already cash-flows at list — no discount required.
- To meet the 1% rule (rent ≥ 1% of price), the offer needs to be $164k (6.1% below list).
- Recommended offer: $159k (9.0% below list) — sets the bar for market timing.
- Cap rate 6.8% vs local median 2.9% in Gilmer — top-decile yield for the area; either an underpriced asset or a hidden risk that comps aren't pricing in. Stress-test before assuming the spread holds.
Location & tenants
- Location reads 57/100 on livability (#1,257 in TX) — a working-class tenant base; expect higher turnover. Strengths: cost of living A+, housing A+; Watch: schools D-, amenities F, commute F.
- Union Hill ISD (rural): math 35% / reading 40% proficiency, ranked #814 of 1,141 in TX (top 71%) — families likely to look elsewhere, expect single-tenant / working-renter base with shorter leases.
- Market conditions: 181 active listings in the ZIP; 34 units permitted in Upshur County in 2024 (0 in 5+ unit buildings).
Forward outlook
- In year one you build about $19k of equity ($1k loan paydown + $18k appreciation (10.0% local appreciation)).
- Upshur County population projected at +9% by 2050 — modest demand growth; plan on rents tracking national, not racing it.
- At projected returns (10.0% appreciation + 3.0% rent growth), your $49k cash investment doubles in ~3 years — after that, you're playing with house money.
- By year 2, paydown + projected appreciation supports a ~$30k cash-out refi (75% LTV) — recoverable capital for the next deal without selling this one.
Negotiation context
- It's been on market 115 days — a 9% lower offer ($159k) is reasonable based on typical stale-listing flexibility.
Risks & watch-outs
- Watch-outs: built in 1954 — expect roof / HVAC / electrical / plumbing capex.
Questions for the listing agent
- It's been on market 115 days. Have you received any prior offers? Is the seller open to a 9% concession, seller financing, or rate buy-down credit?
- Have any recent inspections been done? Can we get a copy of the seller's disclosures and any deferred-maintenance estimates?
- Built in 1954 — when were the roof, HVAC, electrical panel, plumbing, and water heater last replaced?
- Why hasn't it sold? Are there any deal-killer items the seller is aware of (foundation, flood, title, zoning, code violations)?
- Is there a deadline driving the sale (1031 exchange, divorce, estate, relocation)? That informs how much negotiation room exists.
- Schools are D-rated, which usually means shorter tenancies and higher turnover. Who's the typical renter profile here, and what's been the actual vacancy rate?
- What's the average days-on-market for RENTAL listings here right now (not sales)? A rising rental-DOM trend means longer vacancies and softer asking-rent achievability than the comps imply.
- What's the recent tenant-quality profile in this submarket — average credit score on applications, eviction rate, late-payment / NSF rate, and stable-employment percentage? A property-management company in the area should have these aggregated.
- How much new for-sale + rental construction is in the pipeline within 1–3 miles? Heavy new supply typically softens prices + rents 12–24 months out; constrained supply supports both.
Investment metrics
- 1% rule
- 0.94% ✗
- Cap rate
- 6.77%
- Cash-on-cash
- 1.72%
- DSCR
- 1.08
- GRM
- 8.9
CMA / ARV
- ARV (median comp)
- $373,811
- List price
- $175,000
- Delta
- -53.18%
- Verdict
- UNDERPRICED
- Comps
- 2 within 2.0 mi
Projected returns pro-forma
10.0% appreciation · 3.0% rent growth · sell at horizon
- IRR
- 25.5%
- Equity multiple
- 3.04×
- Total profit
- $99,820
- Equity at exit
- $157,654
- IRR
- 22.5%
- Equity multiple
- 6.93×
- Total profit
- $290,508
- Equity at exit
- $339,987
Cash invested: $49,000 (down + closing). Projections, not guarantees.
Landlord ↔ Tenant lean methodology
- Overall (STATE)
- 87 Strongly Landlord-Friendly
- State Texas
- 87 Strongly Landlord-Friendly · R+5
- County
- — inherits STATE
- City
- — inherits STATE
ZIP-level market 75645
- Home prices YoY
- 12.7%
- Active inventory
- 181
- Price-to-rent
- 8.9×
Monthly cashflow live
- Estimated rent
- $1,644 medium interval (Pro) →
- Mortgage (P&I)
- −$918
- Tax from tax record
- −$238 /mo · $2,853/yr
- Insurance
- −$73
- HOA
- −$0
- Vacancy / Maint / Mgmt
- −$345
- Net cashflow
- $70
Break-even live
UW: 25.0% down · 7.5% · 30yr · 1.5% tax · 5.0% vac · 8.0% maint · 8.0% mgmt
Financing live
Cash to close
- Down payment
- $43,750
- Closing costs
- $5,250
- Reserves months
- —
- Total cash needed
- —
Loan-product check · same deal, 3 products live
Conventional
25% down · 7.5% · 30yr
- Down + closing
- —
- Monthly P&I
- —
- Monthly cashflow
- —
- DSCR
- —
- Eligible?
- —
Personal DTI + credit; lowest rate.
DSCR
20% down · 8.5% · 30yr
- Down + closing
- —
- Monthly P&I
- —
- Monthly cashflow
- —
- DSCR
- —
- Eligible?
- —
No personal income docs; deal must DSCR.
Hard money
10% down · 12.0% · 12mo
- Down + closing
- —
- Monthly P&I
- —
- Monthly cashflow
- —
- DSCR
- —
- Eligible?
- —
Short-term bridge; refi at stabilization.
Listing history 16 events
-
2026-06-18days on market $175,000 Active 115 DOM
-
2026-06-17days on market $175,000 Active 114 DOM
-
2026-06-16days on market $175,000 Active 113 DOM
-
2026-06-15days on market $175,000 Active 112 DOM
-
2026-06-15days on market $175,000 Active 111 DOM
-
2026-06-13days on market $175,000 Active 110 DOM
-
2026-06-12days on market $175,000 Active 109 DOM
-
2026-06-09days on market $175,000 Active 106 DOM
-
2026-06-08days on market $175,000 Active 105 DOM
-
2026-06-08days on market $175,000 Active 104 DOM
-
2026-06-05days on market $175,000 Active 102 DOM
-
2026-06-03days on market $175,000 Active 100 DOM
-
2026-06-02days on market $175,000 Active 99 DOM
-
2026-06-01days on market $175,000 Active 98 DOM
-
2026-05-31days on market $175,000 Active 97 DOM
-
2026-01-12$190,000 Active 269-char remark
Show marketing remark (269 chars)
Ready for a project? This little farmhouse on 1 acre has all the markings of a cozy country home. With its vintage character and prime location near the highway. It's ideal for someone who values both convenience and satisfaction of bringing new lights to an old place.
ⓘ Source: listings_history table (triggers on properties + properties_extension) + one-shot
backfill from property_details.listing_events for pre-trigger history.
Tax reassessment forecast TX · Resets to sale price
- Current annual tax
- $2,853 · $238/mo
- Projected year-2 tax
- $3,202 · $267/mo
- Expected delta
- +$350/yr (+$29/mo · 12.3%)
ⓘ Screening estimate from a state-policy table — verify with the county assessor before closing.
Nearby sold comps map
Loading sold comps map…
Walkable amenities ~0.75 mi
Loading nearby amenities…
Taxation est. · year 1
- Rental income
- $19,726
- − Mortgage interest
- −$9,803
- − Property taxes
- −$2,853
- − Insurance
- −$875
- − Repairs & maintenance
- −$1,578
- − Management
- −$1,578
- − Depreciation
- −$5,091
- Taxable loss
- −$2,052
- Est. tax savings @ 24.0%
- +$492
- After-tax cash flow
- $1,335/yr
For passive investors: Depreciation is non-cash, so a rental often shows a tax loss while cash-flowing — sheltering income. Rental losses are passive: they offset passive income freely, and up to $25,000/yr can offset ordinary (W-2) income if you actively participate and your MAGI is under $100k (phasing out to $0 by $150k); unused losses carry forward. On sale, claimed depreciation is recaptured at up to 25%, and gains may owe capital-gains tax (a 1031 exchange can defer both). Figures are a year-1 estimate at your 24.0% rate — not tax advice; consult a CPA.
Condition & rehab AI · 6 photos
This property requires moderate repairs and maintenance to improve its condition and value. Exterior siding and roof repairs are needed, along with interior painting and HVAC upgrades.
Repairs flagged
- Moderate Exterior siding — Weathered and possibly peeling
- Minor Roof — May have some minor damage
Value-add opportunities
- Both Paint exterior siding — Enhances curb appeal and value
- Both Replace roof — Improves structural integrity and aesthetic
- Both Paint interior walls — Enhances interior appearance and value
- Both Upgrade HVAC system — Improves comfort and energy efficiency
Renovation cost estimate screening
| Repair item | Severity | Est. cost |
|---|---|---|
| Exterior siding · Weathered and possibly peeling | Moderate | $3,000–15,000 |
| Roof · May have some minor damage | Minor | $500–3,000 |
| Total estimated repair cost · 2 items | $3,500–18,000 |
Value-add ROI direction
- Both Paint exterior siding — Enhances curb appeal and value ↑
- Both Replace roof — Improves structural integrity and aesthetic ↑
- Both Paint interior walls — Enhances interior appearance and value ↑
- Both Upgrade HVAC system — Improves comfort and energy efficiency ↑
ⓘ Cost ranges are severity-bucket heuristics (US national rule-of-thumb). Get contractor quotes + a written scope before underwriting a rehab budget.
Schools (NCES district)
- District
- Union Hill ISD
- NCES district ID
- 4843560
- Math proficiency
- 35% ▲ 10.00%
- Reading proficiency
- 40% ▬ 0.00%
- Median HH income
- $43,917
- Composite
- 34.36/100
- National rank
- #10198
- State rank
- #814 of 1141 in TX
Livability — Gilmer
- Score
- 57/100
- State rank
- #1257
- US rank
- #21903
Category grades
Schools grade is shown separately in the Schools card above.
Census & demographics
- Population (ZIP)
- 10,511
Population outlook (Upshur County) Hauer SSP2
- Today (2025)
- 42,771 people
- By 2030
- 43,788 · +2.4%
- By 2040
- 45,574 · +6.6%
- By 2050
- 46,683 · +9.1%
- By 2075
- 49,137 · +14.9%
- By 2100
- 47,457 · +11.0%
Race, ethnicity, and origin ACS 2023
- Neighborhood character
- Predominantly White (81%)
- Race & ethnicity
- White 81% Hispanic / Latino 10% Two or more races 6% Black 4%
- Hispanic origin (detail)
- Mexican 9%
- Common ancestry
- Slovak 3% Serbian 2% Lithuanian 1%
- Foreign-born
- 3% · Canada
- Languages at home
- 97% English-only · Spanish 2% Tagalog/Filipino 0%
Political lean MEDSL · Upshur
- 2024 margin
- Solid R (+71.0) · D 14.2% · R 85.2%
- 2008→2024 swing
- -22.0pp toward R · 2008: -49.0pp · 2024: -71.0pp
- All cycles
- 2024: R+71.0 2020: R+68.5 2016: R+68.0 2012: R+59.8 2008: R+49.0
Not yet ingested
- Civics
- —
Market trends
- HPI YoY
- ▲ 35.93%
- Current HPI
- 319.83
- Rent YoY
- —
- Metro
- —
- State GDP YoY
- ▲ 3.95%
- F500 in state
- 110
Industry mix (Fortune 500 HQ in TX)
| Industry | F500 HQs | Revenue |
|---|---|---|
| Energy | 16 | $1,198B |
|
||
| Technology | 5 | $198B |
|
||
| Engineering / Construction | 4 | $72B |
|
||
| Energy Services | 3 | $60B |
|
||
| Utilities | 3 | $41B |
|
||
| Healthcare | 2 | $330B |
|
||
Price history
1 event — show timeline
- 2026-01-12 Listed $190,000 LAAR
Property tax history
+3.5%/yrLatest (2025): $2,853 · +3.5% YoY. Source: county tax records.
Cash-flow waterfall
monthlySold comps — $/sqft
last 12 mo · ≤1 miLoading sold comps…