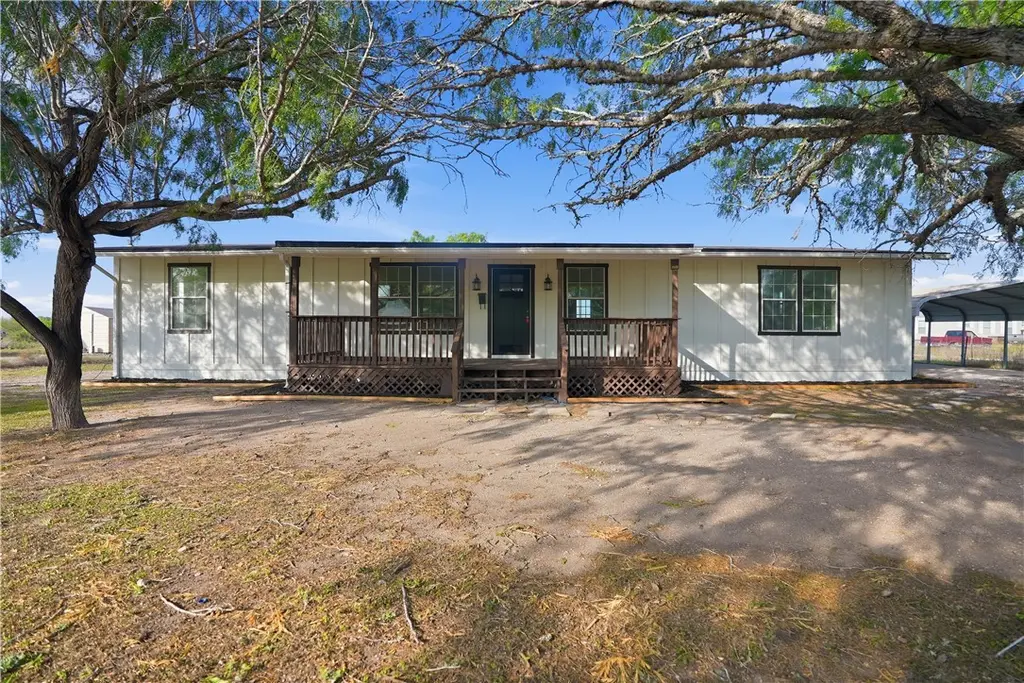
262 Cr 3522 Cir · Orange Grove, TX
Flood risk 1/10 · Minimal
- FEMA flood zone
- X (unshaded)
- Chance of flooding over 30 yrs
- 0.0%
- Est. flood insurance / yr
- $507 – $1,088
Fire risk 4/10 · Minor
- Est. fire insurance / yr
- $1,222 – $2,270
Heat risk 9/10 · Severe
- Hot days now (above 110°F)
- 7 days/yr
- Hot days in 30 yrs
- 21 days/yr
Wind risk 9/10 · Severe
- Chance of severe wind over 30 yrs
- 99.0%
Air-quality risk 1/10 · Minimal
- Unhealthy air days now
- 0 days/yr
- Unhealthy air days in 30 yrs
- 0 days/yr
Risk factors via First Street. Map © Google.
Why this score? — see what drove the D grade
The composite is a weighted blend of 9 inputs, each scored 0–100. Each bar is that input's sub-score; the figure is the points it added to the 100-point composite (weight × sub-score).
- ARV discount +11.1/15.0
- Cash flow +10.1/30.0
- Appreciation +5.7/10.0
- Schools +4.2/10.0
- Livability +3.6/5.0
- DSCR +2.9/10.0
- Rent growth +2.5/5.0
- Condition / age +2.5/5.0
- 1% rule +1.9/10.0
$185,000
🖨 Deal sheet (PDF) 📄 Offer letter ✓ Due diligence
Listing remarks MLS
This beautifully remodeled 3 Bedroom 2bath home feels like new and is ready for it's next owner! Nestled on a spacious lot just shy of an acre, This property offers the perfect blend of peaceful country living with the convenience of being just minutes from your local schools. Enjoy the shade of mature trees and relax on the large front porch that is perfect for morning coffee or evening sunsets. inside, the home has been completely updated, giving it a fresh modern feel throughout.
Key facts
- Remodeled
- Large front porch
- Updated
Tags
Neighborhood map
What this means for you Summary
Snapshot
- This is a 3-bed/2.0-bath single-family listed at $185k.
Deal economics
- At list price, monthly cash flow is $-109 ($-1k/yr) — negative.
- To cash-flow at today's rent, offer at most $166k (10.4% below list).
- To meet the 1% rule (rent ≥ 1% of price), the offer needs to be $128k (30.6% below list).
- Recommended offer: $128k (30.6% below list) — sets the bar for 1% rule.
Location & tenants
- Location reads 72/100 on livability (#235 in TX) — a middle-class / working-renter tenant base. Strengths: cost of living A+, housing A+, health & safety A+; Watch: amenities F, commute F.
- Orange Grove ISD (rural): math 49% / reading 49% proficiency, ranked #196 of 826 in TX (top 24%) — families likely to look elsewhere, expect single-tenant / working-renter base with shorter leases.
- Zoned schools: Orange Grove Pri (443 students, 64% FRL); Orange Grove J H (math 41% / reading 46%, grade D, #530 of 1,662 statewide, top 32%, 396 students, 62% FRL); Orange Grove H S (math 57% / reading 52%, grade C-, #379 of 1,632 statewide, top 26%, 558 students, 60% FRL).
- Market conditions: 95 active listings in the ZIP; 6 units permitted in Jim Wells County in 2024 (0 in 5+ unit buildings).
Forward outlook
- In year one you build about $4k of equity ($1k loan paydown + $2k appreciation (1.3% local appreciation)).
- Jim Wells County population projected at +10% by 2050 — modest demand growth; plan on rents tracking national, not racing it.
- By year 9, paydown + projected appreciation supports a ~$33k cash-out refi (75% LTV) — recoverable capital for the next deal without selling this one.
Negotiation context
- It's been on market 67 days — a 6% lower offer ($174k) is reasonable based on typical stale-listing flexibility.
Risks & watch-outs
- Watch-outs: built in 1900 — expect roof / HVAC / electrical / plumbing capex.
- Climate carrying-cost: severe wind risk, 99% chance of damaging wind over 30y; extreme-heat days projected 7→21/yr by 2055 (HVAC capex compounding) — expect insurance premiums to compound above CPI over the hold.
Questions for the listing agent
- What do current leases actually rent for vs. the listed asking? Can we see a recent rent roll and the last 12 months of T-12 income?
- It's been on market 67 days. Have you received any prior offers? Is the seller open to a 31% concession, seller financing, or rate buy-down credit?
- Built in 1900 — when were the roof, HVAC, electrical panel, plumbing, and water heater last replaced?
- Why hasn't it sold? Are there any deal-killer items the seller is aware of (foundation, flood, title, zoning, code violations)?
- Is there a deadline driving the sale (1031 exchange, divorce, estate, relocation)? That informs how much negotiation room exists.
- The area grade is low — what's the realistic commute time and amenity access for the typical tenant pool here? Any planned neighborhood developments (good or bad) we should know about?
- What's the average days-on-market for RENTAL listings here right now (not sales)? A rising rental-DOM trend means longer vacancies and softer asking-rent achievability than the comps imply.
- What's the recent tenant-quality profile in this submarket — average credit score on applications, eviction rate, late-payment / NSF rate, and stable-employment percentage? A property-management company in the area should have these aggregated.
- How much new for-sale + rental construction is in the pipeline within 1–3 miles? Heavy new supply typically softens prices + rents 12–24 months out; constrained supply supports both.
Investment metrics
- 1% rule
- 0.69% ✗
- Cap rate
- 5.58%
- Cash-on-cash
- -2.53%
- DSCR
- 0.89
- GRM
- 12.0
CMA / ARV
- ARV (median comp)
- $201,283
- List price
- $185,000
- Delta
- -8.09%
- Verdict
- FAIR
- Comps
- 3 within 2.0 mi
Projected returns pro-forma
1.34% appreciation · 3.0% rent growth · sell at horizon
- IRR
- -0.2%
- Equity multiple
- 0.99×
- Total profit
- $-476
- Equity at exit
- $66,452
- IRR
- 4.4%
- Equity multiple
- 1.56×
- Total profit
- $28,930
- Equity at exit
- $90,916
Cash invested: $51,800 (down + closing). Projections, not guarantees.
Landlord ↔ Tenant lean methodology
- Overall (STATE)
- 87 Strongly Landlord-Friendly
- State Texas
- 87 Strongly Landlord-Friendly · R+5
- County
- — inherits STATE
- City
- — inherits STATE
ZIP-level market 78372
- Home prices YoY
- 1.1%
- Active inventory
- 95
- Price-to-rent
- 12.0×
Monthly cashflow live
- Estimated rent
- $1,285 medium interval (Pro) →
- Mortgage (P&I)
- −$970
- Tax from tax record
- −$77 /mo · $922/yr
- Insurance
- −$77
- HOA
- −$0
- Vacancy / Maint / Mgmt
- −$270
- Net cashflow
- $-109
Break-even live
Sensitivity live
| Price | -10% $-5 | -5% $-57 | +0% $-109 | +5% $-162 | +10% $-214 |
|---|---|---|---|---|---|
| Rent | -10% $-211 | -5% $-160 | +0% $-109 | +5% $-59 | +10% $-8 |
| Rate | -1.0pp $-16 | -0.5pp $-62 | base $-109 | +0.5pp $-157 | +1.0pp $-206 |
UW: 25.0% down · 7.5% · 30yr · 1.5% tax · 5.0% vac · 8.0% maint · 8.0% mgmt
Financing live
Cash to close
- Down payment
- $46,250
- Closing costs
- $5,550
- Reserves months
- —
- Total cash needed
- —
Loan-product check · same deal, 3 products live
Conventional
25% down · 7.5% · 30yr
- Down + closing
- —
- Monthly P&I
- —
- Monthly cashflow
- —
- DSCR
- —
- Eligible?
- —
Personal DTI + credit; lowest rate.
DSCR
20% down · 8.5% · 30yr
- Down + closing
- —
- Monthly P&I
- —
- Monthly cashflow
- —
- DSCR
- —
- Eligible?
- —
No personal income docs; deal must DSCR.
Hard money
10% down · 12.0% · 12mo
- Down + closing
- —
- Monthly P&I
- —
- Monthly cashflow
- —
- DSCR
- —
- Eligible?
- —
Short-term bridge; refi at stabilization.
Listing history 18 events
-
2026-06-21days on market $185,000 Active 67 DOM
-
2026-06-21days on market $185,000 Active 66 DOM
-
2026-06-18days on market $185,000 Active 64 DOM
-
2026-06-17days on market $185,000 Active 63 DOM
-
2026-06-16days on market $185,000 Active 62 DOM
-
2026-06-15days on market $185,000 Active 61 DOM
-
2026-06-15days on market $185,000 Active 60 DOM
-
2026-06-13days on market $185,000 Active 59 DOM
-
2026-06-12days on market $185,000 Active 58 DOM
-
2026-06-10days on market $185,000 Active 55 DOM
-
2026-06-08days on market $185,000 Active 54 DOM
-
2026-06-08days on market $185,000 Active 53 DOM
-
2026-06-07days on market $185,000 Active 52 DOM
-
2026-06-03days on market $185,000 Active 49 DOM
-
2026-06-02days on market $185,000 Active 48 DOM
-
2026-06-01days on market $185,000 Active 47 DOM
-
2026-05-31days on market $185,000 Active 46 DOM
-
2026-04-15$185,000 Active 487-char remark
Show marketing remark (487 chars)
This beautifully remodeled 3 Bedroom 2bath home feels like new and is ready for it's next owner! Nestled on a spacious lot just shy of an acre, This property offers the perfect blend of peaceful country living with the convenience of being just minutes from your local schools. Enjoy the shade of mature trees and relax on the large front porch that is perfect for morning coffee or evening sunsets. inside, the home has been completely updated, giving it a fresh modern feel throughout.
ⓘ Source: listings_history table (triggers on properties + properties_extension) + one-shot
backfill from property_details.listing_events for pre-trigger history.
Tax reassessment forecast TX · Resets to sale price
- Current annual tax
- $922 · $77/mo
- Projected year-2 tax
- $3,386 · $282/mo
- Expected delta
- +$2,463/yr (+$205/mo · 267.1%)
ⓘ Screening estimate from a state-policy table — verify with the county assessor before closing.
Climate risk First Street
- Flood 1/10 Low FEMA zone X (unshaded) · 0% chance over 30 yrs
- Wildfire 4/10 Moderate
- Heat 9/10 Extreme 7 d/yr ≥110°F today · 21 d/yr by 30 yrs out
- Wind 9/10 Extreme 99% chance of damaging wind over 30 yrs
- Air quality 1/10 Low 0 unhealthy d/yr today · 0 by 30 yrs out
Nearby sold comps map
Loading sold comps map…
Walkable amenities ~0.75 mi
Loading nearby amenities…
Taxation est. · year 1
- Rental income
- $15,415
- − Mortgage interest
- −$10,363
- − Property taxes
- −$922
- − Insurance
- −$925
- − Repairs & maintenance
- −$1,233
- − Management
- −$1,233
- − Depreciation
- −$5,382
- Taxable loss
- −$4,643
- Est. tax savings @ 24.0%
- +$1,114
- After-tax cash flow
- $-197/yr
For passive investors: Depreciation is non-cash, so a rental often shows a tax loss while cash-flowing — sheltering income. Rental losses are passive: they offset passive income freely, and up to $25,000/yr can offset ordinary (W-2) income if you actively participate and your MAGI is under $100k (phasing out to $0 by $150k); unused losses carry forward. On sale, claimed depreciation is recaptured at up to 25%, and gains may owe capital-gains tax (a 1031 exchange can defer both). Figures are a year-1 estimate at your 24.0% rate — not tax advice; consult a CPA.
Schools (NCES district)
- District
- Orange Grove ISD
- NCES district ID
- 4833720
- Math proficiency
- 49% ▼ -6.00%
- Reading proficiency
- 49% ▲ 4.00%
- Median HH income
- $49,348
- Composite
- 41.9/100
- National rank
- #3367
- State rank
- #196 of 826 in TX
Livability — Orange Grove
- Score
- 72/100
- State rank
- #235
- US rank
- #5722
Category grades
Schools grade is shown separately in the Schools card above.
Census & demographics
- Population (ZIP)
- 5,066
Population outlook (Jim Wells County) Hauer SSP2
- Today (2025)
- 43,325 people
- By 2030
- 44,156 · +1.9%
- By 2040
- 45,790 · +5.7%
- By 2050
- 47,455 · +9.5%
- By 2075
- 51,800 · +19.6%
- By 2100
- 52,006 · +20.0%
Race, ethnicity, and origin ACS 2023
- Neighborhood character
- Majority Hispanic (56%)
- Race & ethnicity
- Hispanic / Latino 56% White 41% Two or more races 14%
- Hispanic origin (detail)
- Mexican 54%
- Common ancestry
- Arab 2% Italian 1% Romanian 1%
- Foreign-born
- 7% · Canada
- Languages at home
- 60% English-only · Spanish 36% Arabic 4%
Political lean MEDSL · Jim Wells
- 2024 margin
- R (+15.5) · D 42.0% · R 57.5%
- 2008→2024 swing
- -31.6pp toward R · 2008: 16.1pp · 2024: -15.5pp
- All cycles
- 2024: R+15.5 2020: R+9.8 2016: D+10.3 2012: D+17.0 2008: D+16.1
Not yet ingested
- Civics
- —
Market trends
- HPI YoY
- ▲ 1.34%
- Current HPI
- 126.8482
- Rent YoY
- —
- Metro
- —
- State GDP YoY
- ▲ 3.95%
- F500 in state
- 110
Industry mix (Fortune 500 HQ in TX)
| Industry | F500 HQs | Revenue |
|---|---|---|
| Energy | 16 | $1,198B |
|
||
| Technology | 5 | $198B |
|
||
| Engineering / Construction | 4 | $72B |
|
||
| Energy Services | 3 | $60B |
|
||
| Utilities | 3 | $41B |
|
||
| Healthcare | 2 | $330B |
|
||
Price history
1 event — show timeline
- 2026-04-15 Listed $185,000 CBMLS
Property tax history
+2.9%/yrLatest (2025): $922 · +2.9% YoY. Source: county tax records.
Cash-flow waterfall
monthlySold comps — $/sqft
last 12 mo · ≤1 miLoading sold comps…