1900 Alamanda Dr #204 · Naples, FL
Flood risk 6/10 · Moderate
- FEMA flood zone
- X (unshaded)
- Chance of flooding over 30 yrs
- 0.54%
- Est. flood insurance / yr
- $507 – $1,088
Fire risk 1/10 · Minimal
- Est. fire insurance / yr
- $947 – $1,759
Heat risk 10/10 · Severe
- Hot days now (above 107°F)
- 7 days/yr
- Hot days in 30 yrs
- 29 days/yr
Wind risk 10/10 · Severe
- Chance of severe wind over 30 yrs
- 99.0%
Air-quality risk 2/10 · Minimal
- Unhealthy air days now
- 2 days/yr
- Unhealthy air days in 30 yrs
- 2 days/yr
Risk factors via First Street. Map © Google.
Why this score? — see what drove the A- grade
The composite is a weighted blend of 9 inputs, each scored 0–100. Each bar is that input's sub-score; the figure is the points it added to the 100-point composite (weight × sub-score).
- Cash flow +30.0/30.0
- 1% rule +10.0/10.0
- DSCR +10.0/10.0
- ARV discount +7.5/15.0
- Appreciation +7.0/10.0
- Schools +5.0/10.0
- Rent growth +4.7/5.0
- Livability +4.0/5.0
- Condition / age +2.5/5.0
$324,000
🖨 Deal sheet 📄 Offer letter ✓ Due diligence
Listing remarks
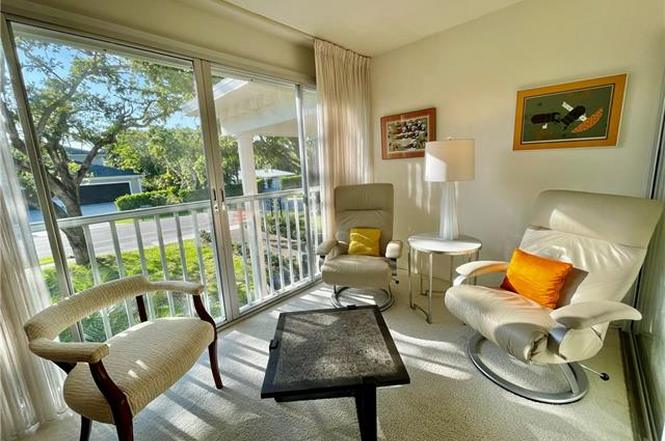
Sunshine, natural beauty, relaxation. This furnished beach condo has an optional private membership at the Moorings Beach club with 465 feet of white sandy beachfront. The morning Sunshine streams into the kitchen bringing a light airy start to the day. This convenient location is just 1 mile from the beach and walking distance to the restaurants, shopping and grocery stores. This community enjoys an active day at the beach, pool, biking, walking trails, nature preserves, local parks, and the zoo just to name a few. An active healthy lifestyle is complimented with relaxing evenings as you take in the painted skies at sunset from the lanai. No assessments, remodeled and updated.
Key facts
- $481 HOA
- Garage
- Community pool
Tags
Property features AI
Finance
- Other: Part of Moorings development (Naples Mimosa Club sub-condo); Complex contains 28 units in a single-floor building; 2 units per floor
- Financial info: Semi-annual land lease fee
- HOA & community: Condo association with professional management; Semi-annual condo fee; Condo fee includes cable, insurance, internet/WiFi, irrigation water, laundry facilities, lawn/land maintenance, manager, pest control (exterior), reserves, street lights, street maintenance, trash removal, and water; Community amenities include beach club access, bike storage, common laundry, community pool, extra storage, internet access, library, sidewalks, and streetlights; Community is non-gated; see remarks; Total annual recurring fees listed as $9,592; total one-time fees listed as $150
Exterior
- Parking: Common paved parking; Guest parking
- Security: Impact resistant doors and windows
- Utilities: Central water; Central sewer; Cable available; Electric service for heating and cooling
- Home design: Residential low-rise building (1–3 stories); Built in 1970; Concrete block construction; Brick and stucco exterior; Built-up/flat or rolled roof; Rear exposure facing west; Unit/lot number 204
- Construction: Concrete block construction; Brick and stucco finish; Built-up or rolled roof; Originally built in 1970
- Exterior features: Impact resistant windows and doors; Landscaped area view; Zero lot line; City and county maintained roads
Interior
- Kitchen: Dishwasher; Microwave; Range; Refrigerator / Freezer; Eat-in kitchen
- Bedrooms: 2 bedrooms (split bedroom layout)
- Flooring: Carpet; Tile
- Bathrooms: 2 full bathrooms; Master bath with shower only
- Heating & cooling: Central electric heat; Central electric air conditioning; Ceiling fans
- Interior features: Cable pre-wired and high-speed internet available; Smoke detectors; Window coverings; Turnkey furnished; Great room floor plan; Split bedroom layout; Florida room / glass porch; Screened lanai/porch; Guest bath; Guest room; Dining area (family) and eat-in kitchen; Common elevator access
- Laundry & utility: Common laundry facilities; Smoke detector (equipment listed)
Neighborhood map
What this means for you Summary
Snapshot
- This is a 2-bed/2.0-bath condo listed at $324k.
Deal economics
- At list price, monthly cash flow is $2k ($19k/yr) — positive.
- The deal already cash-flows at list — no discount required.
- Meets the 1% rule at list price ($5k rent vs $324k).
- Recommended offer: $285k (12.0% below list) — sets the bar for market timing.
Location & tenants
- Location reads 80/100 on livability (#126 in FL, #1,903 nationally) — a professional / high-income tenant draw. Strengths: crime A+, amenities A+, employment A+; Watch: commute D+, cost of living F.
- Collier (suburban): math 60% / reading 56% proficiency, ranked #16 of 73 in FL (top 22%) — acceptable for families but not a draw, mixed tenant base, ~2y average lease.
- Market conditions: Rents rising fast (+8.8%/yr); 614 active listings in the ZIP; 19 comparable units currently listed for rent nearby; rentals at typical pace (median 23d on market — plan ~3-4 weeks tenant-placement turnaround); high-income renter base; 3,520 units permitted in Collier County in 2024 (959 in 5+ unit buildings).
- At $5,109/mo this rent would consume 47% of the median local household income ($131k/yr) (locally 333% of renters already pay >50% of income on rent) — very limited rent-growth headroom before tenants either downsize or default.
Forward outlook
- In year one you build about $15k of equity ($2k loan paydown + $13k appreciation (4.1% local appreciation)).
- Collier County population projected at +30% by 2050 — long-run rental-demand tailwind backs the buy-and-hold thesis.
- At projected returns (4.1% appreciation + 8.0% rent growth), your $91k cash investment doubles in ~3 years — after that, you're playing with house money.
- By year 3, paydown + projected appreciation supports a ~$38k cash-out refi (75% LTV) — recoverable capital for the next deal without selling this one.
Negotiation context
- It's been on market 154 days — a 12% lower offer ($285k) is reasonable based on typical stale-listing flexibility.
- Current owner paid $75k; list at $324k implies a 332% gain — meaningful room to come down on a strong offer.
Risks & watch-outs
- Climate carrying-cost: major flood risk; severe wind risk, 99% chance of damaging wind over 30y; extreme-heat days projected 7→29/yr by 2055 (HVAC capex compounding) — expect insurance premiums to compound above CPI over the hold.
Questions for the listing agent
- It's been on market 154 days. Have you received any prior offers? Is the seller open to a 12% concession, seller financing, or rate buy-down credit?
- Built in 1970 — when were the roof, HVAC, electrical panel, plumbing, and water heater last replaced?
- What does the HOA fee cover, when was the last increase, and are there any pending special assessments or reserve-fund shortfalls?
- Any open or pending special assessments — roof, HVAC, plumbing, elevator, façade? What's the per-unit balance and payoff schedule, and is the seller paying it off at close or rolling it to the buyer?
- Why hasn't it sold? Are there any deal-killer items the seller is aware of (foundation, flood, title, zoning, code violations)?
- Is there a deadline driving the sale (1031 exchange, divorce, estate, relocation)? That informs how much negotiation room exists.
- Schools are B-rated — typically a magnet for longer-tenancy family renters. What's the average tenant stay here, and is there a school-zone premium baked into asking?
- What's the average days-on-market for RENTAL listings here right now (not sales)? A rising rental-DOM trend means longer vacancies and softer asking-rent achievability than the comps imply.
- What's the recent tenant-quality profile in this submarket — average credit score on applications, eviction rate, late-payment / NSF rate, and stable-employment percentage? A property-management company in the area should have these aggregated.
- How much new apartment / multifamily construction is in the pipeline within 1–3 miles? Heavy new supply (>2% of stock underway) typically softens rents 12–24 months out; light construction supports rent growth.
Investment metrics
- 1% rule
- 1.58% ✓
- Cap rate
- 12.05%
- Cash-on-cash
- 20.55%
- DSCR
- 1.91
- GRM
- 5.3
CMA / ARV
No comps found within radius.
Projected returns pro-forma
4.08% appreciation · 8.0% rent growth · sell at horizon
- IRR
- 32.7%
- Equity multiple
- 3.03×
- Total profit
- $184,151
- Equity at exit
- $165,856
- IRR
- 34.7%
- Equity multiple
- 7.01×
- Total profit
- $545,196
- Equity at exit
- $272,543
Cash invested: $90,720 (down + closing). Projections, not guarantees.
Landlord ↔ Tenant lean methodology
- Overall (STATE)
- 87 Strongly Landlord-Friendly
- State Florida
- 87 Strongly Landlord-Friendly · R+3
- County
- — inherits STATE
- City
- — inherits STATE
ZIP-level market 34102
- Home prices YoY
- 1.3%
- Rents YoY
- 8.8%
- Active inventory
- 614
- Price-to-rent
- 5.3×
Monthly cashflow live
- Estimated rent
- $5,109 medium interval (Pro) →
- Mortgage (P&I)
- −$1,699
- Tax from tax record
- −$168 /mo · $2,012/yr
- Insurance
- −$135
- HOA
- −$481
- Vacancy / Maint / Mgmt
- −$1,073
- Net cashflow
- $1,553
Break-even live
UW: 25.0% down · 7.5% · 30yr · 1.5% tax · 5.0% vac · 8.0% maint · 8.0% mgmt
Financing live
Cash to close
- Down payment
- $81,000
- Closing costs
- $9,720
- Reserves months
- —
- Total cash needed
- —
Loan-product check · same deal, 3 products live
Conventional
25% down · 7.5% · 30yr
- Down + closing
- —
- Monthly P&I
- —
- Monthly cashflow
- —
- DSCR
- —
- Eligible?
- —
Personal DTI + credit; lowest rate.
DSCR
20% down · 8.5% · 30yr
- Down + closing
- —
- Monthly P&I
- —
- Monthly cashflow
- —
- DSCR
- —
- Eligible?
- —
No personal income docs; deal must DSCR.
Hard money
10% down · 12.0% · 12mo
- Down + closing
- —
- Monthly P&I
- —
- Monthly cashflow
- —
- DSCR
- —
- Eligible?
- —
Short-term bridge; refi at stabilization.
Rent comps 19 comps
| Address | Beds | Baths | Sqft | Rent | $/sqft | DOM | Units | Dist |
|---|---|---|---|---|---|---|---|---|
| 1910 Gulf Shore Blvd N Naples, FL | 2.0 | 2.0 | 1290 | $9,200 | $7.13 | 23d | 2 | 0.54mi |
| 1950 Gulf Shore Blvd N Naples, FL | 2.0 | 2.0 | 1060 | $7,250 | $6.84 | 23d | 2 | 0.55mi |
| 1550 Gulf Shore Blvd N Unit E6 Naples, FL | 1.0 | 1.0 | 817 | $7,000 | $8.57 | 21d | 1 | 0.59mi |
| 1550 Gulf Shore Blvd N Unit E6 Naples, FL | 1.0 | 1.0 | 817 | $7,000 | $8.57 | 13d | 1 | 0.59mi |
| 1334 Crayton Rd #1 Naples, FL | 2.0 | 2.0 | 1100 | $6,800 | $6.18 | 23d | 1 | 0.59mi |
| 2011 Gulf Shore Blvd N #45 Naples, FL | 2.0 | 2.0 | 1100 | $8,500 | $7.73 | 23d | 1 | 0.63mi |
| 2170 Gulf Shore Blvd N Unit 41E Naples, FL | 1.0 | 1.0 | 682 | $6,000 | $8.80 | 23d | 1 | 0.64mi |
| 1300 Gulf Shore Blvd N #304 Naples, FL | 2.0 | 2.0 | 850 | $5,500 | $6.47 | 23d | 1 | 0.69mi |
| 1300 Gulf Shore Blvd N #406 Naples, FL | 2.0 | 2.0 | 850 | $6,500 | $7.65 | 23d | 1 | 0.69mi |
| 1300 Gulf Shore Blvd N #700 Naples, FL | 2.0 | 2.0 | 850 | $6,250 | $7.35 | 23d | 1 | 0.69mi |
| 1300 Gulf Shore Blvd N #205 Naples, FL | 2.0 | 2.0 | 850 | $5,900 | $6.94 | 23d | 1 | 0.69mi |
| 1100 Gulf Shore Blvd N Naples, FL | 2.0 | 2.0 | 945 | $6,000 | $6.35 | 23d | 2 | 0.81mi |
| 820 Ketch Dr #3 Naples, FL | 2.0 | 2.0 | 1100 | $5,500 | $5.00 | 23d | 1 | 0.84mi |
| 820 Ketch Dr #2 Naples, FL | 2.0 | 2.0 | 1100 | $5,700 | $5.18 | 23d | 1 | 0.84mi |
| 3030 Binnacle Dr #201 Naples, FL | 2.0 | 2.0 | 1092 | $5,000 | $4.58 | 23d | 1 | 0.92mi |
| 333 Harbour Dr #211 Naples, FL | 2.0 | 2.0 | 975 | $5,500 | $5.64 | 13d | 1 | 0.93mi |
| 45 High Point Cir S #303 Naples, FL | 2.0 | 2.0 | 1015 | $5,500 | $5.42 | 23d | 1 | 1.14mi |
| 3200 Gulf Shore Blvd N #105 Naples, FL | 2.0 | 2.0 | 1116 | $8,500 | $7.62 | 23d | 1 | 1.17mi |
| 788 Park Shore Dr Naples, FL | 1.0–2.0 | 1.5–2.0 | 931 | $5,500 | $5.90 | 13d | 3 | 1.42mi |
HOA detail condo
- Monthly dues
- $481 · $5,772/yr
- Likely covers
- pool
- Assessments
- None detected in remarks — confirm with the listing agent.
Listing history 16 events
-
2026-06-18days on market $324,000 Active 154 DOM
-
2026-06-17days on market $324,000 Active 153 DOM
-
2026-06-16days on market $324,000 Active 152 DOM
-
2026-06-15days on market $324,000 Active 151 DOM
-
2026-06-14days on market $324,000 Active 149 DOM
-
2026-06-10days on market $324,000 Active 146 DOM
-
2026-06-09days on market $324,000 Active 145 DOM
-
2026-06-08days on market $324,000 Active 144 DOM
-
2026-06-07days on market $324,000 Active 143 DOM
-
2026-06-03days on market $324,000 Active 139 DOM
-
2026-06-02days on market $324,000 Active 138 DOM
-
2026-06-01days on market $324,000 Active 137 DOM
-
2026-05-31days on market $324,000 Active 136 DOM
-
2026-05-30days on market $324,000 Active 135 DOM
-
2026-01-15$324,000 Active
-
2015-07-06soldstatus $75,000
ⓘ Source: listings_history table (triggers on properties + properties_extension) + one-shot
backfill from property_details.listing_events for pre-trigger history.
Tax reassessment forecast FL · Resets to sale price
- Current annual tax
- $2,012 · $168/mo
- Projected year-2 tax
- $2,689 · $224/mo
- Expected delta
- +$677/yr (+$56/mo · 33.6%)
ⓘ Screening estimate from a state-policy table — verify with the county assessor before closing.
Climate risk First Street
- Flood 6/10 Major FEMA zone X (unshaded) · 54% chance over 30 yrs
- Wildfire 1/10 Low
- Heat 10/10 Extreme 7 d/yr ≥107°F today · 29 d/yr by 30 yrs out
- Wind 10/10 Extreme 99% chance of damaging wind over 30 yrs
- Air quality 2/10 Low 2 unhealthy d/yr today · 2 by 30 yrs out
Nearby sold comps map
Loading sold comps map…
Walkable amenities ~0.75 mi
Loading nearby amenities…
Taxation est. · year 1
- Rental income
- $61,308
- − Mortgage interest
- −$18,149
- − Property taxes
- −$2,012
- − Insurance
- −$1,620
- − Repairs & maintenance
- −$4,905
- − Management
- −$4,905
- − HOA
- −$5,772
- − Depreciation
- −$9,425
- Taxable income
- $14,520
- Est. tax owed @ 24.0%
- −$3,485
- After-tax cash flow
- $15,155/yr
For passive investors: Depreciation is non-cash, so a rental often shows a tax loss while cash-flowing — sheltering income. Rental losses are passive: they offset passive income freely, and up to $25,000/yr can offset ordinary (W-2) income if you actively participate and your MAGI is under $100k (phasing out to $0 by $150k); unused losses carry forward. On sale, claimed depreciation is recaptured at up to 25%, and gains may owe capital-gains tax (a 1031 exchange can defer both). Figures are a year-1 estimate at your 24.0% rate — not tax advice; consult a CPA.
Schools (NCES district)
- District
- Collier
- NCES district ID
- 1200330
- Math proficiency
- 60% ▼ -4.00%
- Reading proficiency
- 56% ▼ -2.00%
- Median HH income
- $58,275
- Composite
- 50.23/100
- National rank
- #1892
- State rank
- #16 of 73 in FL
Livability — Naples
- Score
- 80/100
- State rank
- #126
- US rank
- #1903
Category grades
Schools grade is shown separately in the Schools card above.
Census & demographics
- Census place
- Naples, FL
- County
- Collier County · 396,295 people
- City population
- 344,941
- Metro
- Naples-Marco Island, FL
- Population (ZIP)
- 11,179
- Household income
- $130,929
- Rent vs Own
- Severe rent burden
- 333.0
Population outlook (Collier County) Hauer SSP2
- Today (2025)
- 420,858 people
- By 2030
- 450,054 · +6.9%
- By 2040
- 502,232 · +19.3%
- By 2050
- 544,932 · +29.5%
- By 2075
- 627,203 · +49.0%
- By 2100
- 659,015 · +56.6%
Race, ethnicity, and origin ACS 2023
- Neighborhood character
- Predominantly White (79%)
- Race & ethnicity
- White 79% Hispanic / Latino 9% Two or more races 8% Black 8% Asian 1%
- Hispanic origin (detail)
- Cuban 6%
- Common ancestry
- Hispanic 4% Lithuanian 4% Romanian 4%
- Foreign-born
- 17% · Canada, China
- Languages at home
- 87% English-only · Spanish 7% French/Haitian/Cajun 4% German/W. Germanic 1%
Political lean MEDSL · Collier
- 2024 margin
- Solid R (+33.1) · D 33.1% · R 66.2%
- 2008→2024 swing
- -10.6pp toward R · 2008: -22.5pp · 2024: -33.1pp
- All cycles
- 2024: R+33.1 2020: R+24.7 2016: R+26.0 2012: R+30.1 2008: R+22.5
Not yet ingested
- Civics
- —
Market trends
- HPI YoY
- ▲ 4.08%
- Current HPI
- 328.2755
- Rent YoY
- ▲ 8.75%
- Metro
- Naples-Marco Island, FL
- State GDP YoY
- ▲ 3.28%
- F500 in state
- 36
Industry mix (Fortune 500 HQ in FL)
| Industry | F500 HQs | Revenue |
|---|---|---|
| Industrial Technology | 2 | $29B |
|
||
| Insurance | 2 | $17B |
|
||
| Retail | 1 | $60B |
|
||
| Technology Distribution | 1 | $58B |
|
||
| Homebuilding | 1 | $35B |
|
||
| Technology Manufacturing | 1 | $35B |
|
||
Price history
+332.0% since first listed2 events — show timeline
- 2026-01-15 Listed $324,000 NAPLESMLS
- 2015-07-06 Sold (Public Records) $75,000 Public Records
Property tax history
+6.7%/yrLatest (2025): $2,012 · +0.3% YoY. Source: county tax records.
Cash-flow waterfall
monthlySold comps — $/sqft
last 12 mo · ≤1 miLoading sold comps…