 Fourplex
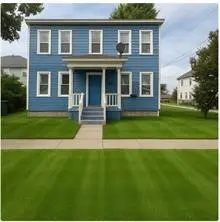
1517 Gentry St · Houston, TX
Flood risk 5/10 · Moderate
- FEMA flood zone
- X (unshaded)
- Chance of flooding over 30 yrs
- 0.52%
- Est. flood insurance / yr
- $507 – $1,088
Fire risk 1/10 · Minimal
- Est. fire insurance / yr
- $1,222 – $2,270
Heat risk 9/10 · Severe
- Hot days now (above 109°F)
- 7 days/yr
- Hot days in 30 yrs
- 24 days/yr
Wind risk 9/10 · Severe
- Chance of severe wind over 30 yrs
- 99.0%
Air-quality risk 3/10 · Minor
- Unhealthy air days now
- 2 days/yr
- Unhealthy air days in 30 yrs
- 3 days/yr
Risk factors via First Street. Map © Google.
Why this score? — see what drove the C+ grade
The composite is a weighted blend of 9 inputs, each scored 0–100. Each bar is that input's sub-score; the figure is the points it added to the 100-point composite (weight × sub-score).
- Cash flow +30.0/30.0
- 1% rule +10.0/10.0
- DSCR +10.0/10.0
- Livability +3.7/5.0
- Rent growth +2.7/5.0
- Schools +2.7/10.0
- Condition / age +2.2/5.0
- ARV discount +0.0/15.0
- Appreciation +0.0/10.0
$400,000
🖨 Deal sheet (PDF) 📄 Offer letter ✓ Due diligence
Multi-family units
County records classify this as Multi-Family (2-4 Unit). Listing-text estimate: 4 units. confirmed
Listing remarks MLS
Discover a rare investment opportunity in the heart of the city! This impressive 4-unit multi-family home, complete with two additional garage apartments in the rear, sits on a spacious corner lot surrounded by brand-new construction townhomes—offering a blend of charm, potential, and modern convenience. Located just minutes from Downtown Houston, the Texas Medical Center, Dakin Park, Toyota Center, and Shell Energy Stadium, this property is perfect for families or professionals seeking proximity to the city’s top destinations while enjoying the benefits of private. Whether you're looking for a home with income potential or a full investment opportunity, this property delivers. Each unit offers comfortable living space, and the garage apartments provide added flexibility for guests, tenants, or home office use. Don’t miss your chance to own in this rapidly growing area—make this multi-family gem your new home or portfolio centerpiece today!
Key facts
- Garage apartments
- Multi-family home
- Texas medical center
Tags
Neighborhood map
What this means for you Summary
Snapshot
- This is a 4 × 4-bed/1.0-bath units multifamily listed at $400k. Condition is rated fair.
Deal economics
- At list price, monthly cash flow is $5k ($58k/yr) — positive. Per door: $1k/mo.
- The deal already cash-flows at list — no discount required.
- Meets the 1% rule at list price ($10k rent vs $400k).
- Recommended offer: $352k (12.0% below list) — sets the bar for market timing.
- Cap rate 20.7% vs local median 3.2% in Houston — top-decile yield for the area; either an underpriced asset or a hidden risk that comps aren't pricing in. Stress-test before assuming the spread holds.
Location & tenants
- Location reads 74/100 on livability (#184 in TX, #4,771 nationally) — a middle-class / working-renter tenant base. Strengths: amenities A+, cost of living A+, housing A+; Watch: crime F.
- Houston ISD (urban): math 27% / reading 35% proficiency, ranked #593 of 826 in TX (top 72%) — families likely to look elsewhere, expect single-tenant / working-renter base with shorter leases; 71% free/reduced lunch — lower-income household profile, screen leases tightly.
- Zoned schools: Sherman El (math 22% / reading 22%, grade F, #3,333 of 4,322 statewide, top 80%, 528 students, 99% FRL); Marshall Middle (math 14% / reading 22%, grade F, #1,491 of 1,662 statewide, top 91%, 607 students, 97% FRL); Northside H S (math 15% / reading 26%, grade F, #1,389 of 1,632 statewide, top 86%, 1,168 students, 94% FRL) — zoned schools average 97% FRL vs 71% district-wide (25 pts higher); higher-poverty schools than district average — tighter screening recommended.
- Market conditions: Rents flat; 609 active listings in the ZIP; solid renter incomes; 29,883 units permitted in Harris County in 2024 (8,621 in 5+ unit buildings).
- At $9,596/mo this rent would consume 138% of the median local household income ($83k/yr) (locally 994% of renters already pay >50% of income on rent) — very limited rent-growth headroom before tenants either downsize or default.
Forward outlook
- Local home prices are declining (-3.0%/yr); year-one equity from $3k of loan paydown is wiped out by about $12k of value loss. Plan a longer hold.
- Harris County population projected at +47% by 2050 — long-run rental-demand tailwind backs the buy-and-hold thesis.
- At projected returns (-3.0% appreciation + 0.8% rent growth), your $112k cash investment doubles in ~3 years — after that, you're playing with house money.
Negotiation context
- It's been on market 126 days — a 12% lower offer ($352k) is reasonable based on typical stale-listing flexibility.
- 2 sale attempts; this cycle's ask has dropped $125k (24%) from the opening price — seller is motivated, your offer sets the floor, not the list.
Risks & watch-outs
- Watch-outs: built in 1920 — expect roof / HVAC / electrical / plumbing capex.
- Climate carrying-cost: moderate flood risk; severe wind risk, 99% chance of damaging wind over 30y; extreme-heat days projected 7→24/yr by 2055 (HVAC capex compounding) — expect insurance premiums to compound above CPI over the hold.
Questions for the listing agent
- It's been on market 126 days. Have you received any prior offers? Is the seller open to a 12% concession, seller financing, or rate buy-down credit?
- Can we see the unit-by-unit rent roll, current vacancy, and any below-market leases? What's the average tenancy length?
- What capital expenditures (roof, boiler, parking lot, exteriors) have been made in the last 5 years, and what's planned in the next 2?
- Have any recent inspections been done? Can we get a copy of the seller's disclosures and any deferred-maintenance estimates?
- Built in 1920 — when were the roof, HVAC, electrical panel, plumbing, and water heater last replaced?
- Why hasn't it sold? Are there any deal-killer items the seller is aware of (foundation, flood, title, zoning, code violations)?
- Is there a deadline driving the sale (1031 exchange, divorce, estate, relocation)? That informs how much negotiation room exists.
- Schools are D-rated, which usually means shorter tenancies and higher turnover. Who's the typical renter profile here, and what's been the actual vacancy rate?
- Crime grade is F in this area — have there been break-ins, vandalism, or insurance claims at this property in the last 3 years? What carrier currently insures it and at what premium?
- What's the average days-on-market for RENTAL listings here right now (not sales)? A rising rental-DOM trend means longer vacancies and softer asking-rent achievability than the comps imply.
- What's the recent tenant-quality profile in this submarket — average credit score on applications, eviction rate, late-payment / NSF rate, and stable-employment percentage? A property-management company in the area should have these aggregated.
- How much new apartment / multifamily construction is in the pipeline within 1–3 miles? Heavy new supply (>2% of stock underway) typically softens rents 12–24 months out; light construction supports rent growth.
Investment metrics
- 1% rule
- 2.40% ✓
- Cap rate
- 20.74%
- Cash-on-cash
- 51.61%
- DSCR
- 3.30
- GRM
- 3.5
CMA / ARV
- ARV (median comp)
- $335,725
- List price
- $400,000
- Delta
- 19.15%
- Verdict
- OVERPRICED
- Comps
- 15 within 1.0 mi
Projected returns pro-forma
-3.0% appreciation · 0.84% rent growth · sell at horizon
- IRR
- 47.0%
- Equity multiple
- 2.98×
- Total profit
- $221,679
- Equity at exit
- $59,641
- IRR
- 51.8%
- Equity multiple
- 5.54×
- Total profit
- $508,411
- Equity at exit
- $34,585
Cash invested: $112,000 (down + closing). Projections, not guarantees.
Landlord ↔ Tenant lean methodology
- Overall (STATE)
- 87 Strongly Landlord-Friendly
- State Texas
- 87 Strongly Landlord-Friendly · R+5
- County
- — inherits STATE
- City
- — inherits STATE
ZIP-level market 77009
- Rents YoY
- 0.8%
- Active inventory
- 609
- Price-to-rent
- 13.9×
Monthly cashflow live
- Estimated rent
- $9,596 medium interval (Pro) →
- Mortgage (P&I)
- −$2,098
- Tax est. 1.5%
- −$500 /mo · $6,000/yr
- Insurance
- −$167
- HOA
- −$0
- Lot rent
- −$0
- Vacancy / Maint / Mgmt
- −$2,015
- Net cashflow
- $4,817
Break-even live
Sensitivity live
| Price | -10% $5,093 | -5% $4,955 | +0% $4,817 | +5% $4,678 | +10% $4,540 |
|---|---|---|---|---|---|
| Rent | -10% $4,058 | -5% $4,437 | +0% $4,817 | +5% $5,196 | +10% $5,575 |
| Rate | -1.0pp $5,018 | -0.5pp $4,918 | base $4,817 | +0.5pp $4,713 | +1.0pp $4,607 |
4-unit breakdown (identical units grouped — click to expand)
| Units | Beds | Baths | Est. rent |
|---|---|---|---|
| 4× units | 4 | 1 | $9,596 |
| #1 | 4 | 1 | $2,399 |
| #2 | 4 | 1 | $2,399 |
| #3 | 4 | 1 | $2,399 |
| #4 | 4 | 1 | $2,399 |
| Total (4 units) | $9,596 | ||
UW: 25.0% down · 7.5% · 30yr · 1.5% tax · 5.0% vac · 8.0% maint · 8.0% mgmt
Financing live
Cash to close
- Down payment
- $100,000
- Closing costs
- $12,000
- Reserves months
- —
- Total cash needed
- —
Loan-product check · same deal, 3 products live
Conventional
25% down · 7.5% · 30yr
- Down + closing
- —
- Monthly P&I
- —
- Monthly cashflow
- —
- DSCR
- —
- Eligible?
- —
Personal DTI + credit; lowest rate.
DSCR
20% down · 8.5% · 30yr
- Down + closing
- —
- Monthly P&I
- —
- Monthly cashflow
- —
- DSCR
- —
- Eligible?
- —
No personal income docs; deal must DSCR.
Hard money
10% down · 12.0% · 12mo
- Down + closing
- —
- Monthly P&I
- —
- Monthly cashflow
- —
- DSCR
- —
- Eligible?
- —
Short-term bridge; refi at stabilization.
Listing history 19 events
-
2026-06-22days on market $400,000 Active 126 DOM
-
2026-06-21days on market $400,000 Active 125 DOM
-
2026-06-18days on market $400,000 Active 122 DOM
-
2026-06-17days on market $400,000 Active 121 DOM
-
2026-06-16days on market $400,000 Active 120 DOM
-
2026-06-15days on market $400,000 Active 119 DOM
-
2026-06-13days on market $400,000 Active 117 DOM
-
2026-06-10days on market $400,000 Active 113 DOM
-
2026-06-08days on market $400,000 Active 112 DOM
-
2026-06-07days on market $400,000 Active 111 DOM
-
2026-06-04days on market $400,000 Active 108 DOM
-
2026-06-01days on market $400,000 Active 105 DOM
-
2026-05-31days on market $400,000 Active 104 DOM
-
2026-04-04price $400,000 987-char remark
Show marketing remark (987 chars)
Discover a rare investment opportunity in the heart of the city! This impressive 4-unit multi-family home, complete with two additional garage apartments in the rear, sits on a spacious corner lot surrounded by brand-new construction townhomes—offering a blend of charm, potential, and modern convenience. Located just minutes from Downtown Houston, the Texas Medical Center, Dakin Park, Toyota Center, and Shell Energy Stadium, this property is perfect for families or professionals seeking proximity to the city’s top destinations while enjoying the benefits of private. Whether you're looking for a home with income potential or a full investment opportunity, this property delivers. Each unit offers comfortable living space, and the garage apartments provide added flexibility for guests, tenants, or home office use. Don’t miss your chance to own in this rapidly growing area—make this multi-family gem your new home or portfolio centerpiece today!
-
2026-02-16$525,000 Active 987-char remark
Show marketing remark (987 chars)
Discover a rare investment opportunity in the heart of the city! This impressive 4-unit multi-family home, complete with two additional garage apartments in the rear, sits on a spacious corner lot surrounded by brand-new construction townhomes—offering a blend of charm, potential, and modern convenience. Located just minutes from Downtown Houston, the Texas Medical Center, Dakin Park, Toyota Center, and Shell Energy Stadium, this property is perfect for families or professionals seeking proximity to the city’s top destinations while enjoying the benefits of private. Whether you're looking for a home with income potential or a full investment opportunity, this property delivers. Each unit offers comfortable living space, and the garage apartments provide added flexibility for guests, tenants, or home office use. Don’t miss your chance to own in this rapidly growing area—make this multi-family gem your new home or portfolio centerpiece today!
-
2026-02-15historical
-
2025-12-07price $589,990
-
2025-11-03price $599,900
-
2025-10-19$650,000 Active
ⓘ Source: listings_history table (triggers on properties + properties_extension) + one-shot
backfill from property_details.listing_events for pre-trigger history.
Climate risk First Street
- Flood 5/10 Major FEMA zone X (unshaded) · 52% chance over 30 yrs
- Wildfire 1/10 Low
- Heat 9/10 Extreme 7 d/yr ≥109°F today · 24 d/yr by 30 yrs out
- Wind 9/10 Extreme 99% chance of damaging wind over 30 yrs
- Air quality 3/10 Moderate 2 unhealthy d/yr today · 3 by 30 yrs out
Nearby sold comps map
Loading sold comps map…
Walkable amenities ~0.75 mi
Loading nearby amenities…
Taxation est. · year 1
- Rental income
- $115,152
- − Mortgage interest
- −$22,406
- − Property taxes
- −$6,000
- − Insurance
- −$2,000
- − Repairs & maintenance
- −$9,212
- − Management
- −$9,212
- − Depreciation
- −$11,636
- Taxable income
- $54,685
- Est. tax owed @ 24.0%
- −$13,124
- After-tax cash flow
- $44,674/yr
For passive investors: Depreciation is non-cash, so a rental often shows a tax loss while cash-flowing — sheltering income. Rental losses are passive: they offset passive income freely, and up to $25,000/yr can offset ordinary (W-2) income if you actively participate and your MAGI is under $100k (phasing out to $0 by $150k); unused losses carry forward. On sale, claimed depreciation is recaptured at up to 25%, and gains may owe capital-gains tax (a 1031 exchange can defer both). Figures are a year-1 estimate at your 24.0% rate — not tax advice; consult a CPA.
Condition & rehab AI · 6 photos
This multi-family property requires significant exterior and landscaping repairs to improve its curb appeal and overall condition.
Repairs flagged
- Major fence — Damaged and overgrown
- Major landscaping — Overgrown vegetation
Value-add opportunities
- Both landscaping and exterior repairs — Improves curb appeal and property value
- Both HVAC and mechanicals — Ensures comfort and energy efficiency
- Both interior painting — Enhances property value and appeal
Renovation cost estimate screening
| Repair item | Severity | Est. cost |
|---|---|---|
| fence · Damaged and overgrown | Major | $15,000–50,000 |
| landscaping · Overgrown vegetation | Major | $15,000–50,000 |
| Total estimated repair cost · 2 items | $30,000–100,000 |
Value-add ROI direction
- Both landscaping and exterior repairs — Improves curb appeal and property value ↑
- Both HVAC and mechanicals — Ensures comfort and energy efficiency ↑
- Both interior painting — Enhances property value and appeal ↑
ⓘ Cost ranges are severity-bucket heuristics (US national rule-of-thumb). Get contractor quotes + a written scope before underwriting a rehab budget.
Schools (NCES district)
- District
- Houston ISD
- NCES district ID
- 4823640
- Math proficiency
- 27% ▼ -18.00%
- Reading proficiency
- 35% ▼ -6.00%
- Median HH income
- $46,054
- Composite
- 26.63/100
- National rank
- #7173
- State rank
- #593 of 826 in TX
Livability — Houston
- Score
- 74/100
- State rank
- #184
- US rank
- #4771
Category grades
Schools grade is shown separately in the Schools card above.
Census & demographics
- Census place
- Houston, TX
- County
- Harris County · 4,702,590 people
- City population
- 3,226,434
- Metro
- Houston-The Woodlands-Sugar Land, TX
- Population (ZIP)
- 35,769
- Household income
- $83,148
- Rent vs Own
- Severe rent burden
- 994.0
Population outlook (Harris County) Hauer SSP2
- Today (2025)
- 5,571,493 people
- By 2030
- 6,089,821 · +9.3%
- By 2040
- 7,142,806 · +28.2%
- By 2050
- 8,185,864 · +46.9%
- By 2075
- 10,574,329 · +89.8%
- By 2100
- 12,109,958 · +117.4%
Race, ethnicity, and origin ACS 2023
- Neighborhood character
- Diverse neighborhood (Simpson 0.60)
- Race & ethnicity
- Hispanic / Latino 53% White 33% Two or more races 22% Black 8% Asian 3%
- Hispanic origin (detail)
- Mexican 46%
- Common ancestry
- Italian 2% Lithuanian 2% Slovak 1%
- Foreign-born
- 20% · Canada
- Languages at home
- 55% English-only · Spanish 40% Other Indo-European 2% Other Asian/Pacific 1%
Political lean MEDSL · Harris
- 2024 margin
- Lean D (+5.5) · D 52.0% · R 46.4% · Other 1.6%
- 2008→2024 swing
- +3.9pp toward D · 2008: 1.6pp · 2024: 5.5pp
- All cycles
- 2024: D+5.5 2020: D+13.3 2016: D+12.4 2012: D+0.1 2008: D+1.6
Not yet ingested
- Civics
- —
Market trends
- HPI YoY
- ▼ -533.57%
- Current HPI
- 219.5037
- Rent YoY
- ▲ 0.84%
- Metro
- Houston-The Woodlands-Sugar Land, TX
- State GDP YoY
- ▲ 3.95%
- F500 in state
- 110
Industry mix (Fortune 500 HQ in TX)
| Industry | F500 HQs | Revenue |
|---|---|---|
| Energy | 16 | $1,198B |
|
||
| Technology | 5 | $198B |
|
||
| Engineering / Construction | 4 | $72B |
|
||
| Energy Services | 3 | $60B |
|
||
| Utilities | 3 | $41B |
|
||
| Healthcare | 2 | $330B |
|
||
Price history
-38.5% since first listed6 events — show timeline
- 2026-04-04 Price Changed $400,000 HARMLS
- 2026-02-16 Listed $525,000 HARMLS
- 2026-02-15 Listing Removed — HARMLS
- 2025-12-07 Price Changed $589,990 HARMLS
- 2025-11-03 Price Changed $599,900 HARMLS
- 2025-10-19 Listed $650,000 HARMLS
Cash-flow waterfall
monthlySold comps — $/sqft
last 12 mo · ≤1 miLoading sold comps…